VSI Availability Manager User’s Guide
- Software Version:
- VSI Availability Manager Version 4.0
- Operating System and Version:
- VSI OpenVMS Alpha Version 8.4-2L1 or higher
VSI OpenVMS IA-64 Version 8.4-1H1 or higher
VSI OpenVMS x86-64 Version 9.2-3 or higher
Microsoft Windows 10 or higher
Preface
This guide explains how to use the VSI Availability Manager software to detect and correct system availability problems.
1. About VSI
VMS Software, Inc. (VSI) is an independent software company licensed by Hewlett Packard Enterprise to develop and support the OpenVMS operating system.
2. Intended Audience
This guide is intended for system managers who install and use the VSI Availability Manager software. It is assumed that the system managers who use this product are familiar with Microsoft Windows terms and functions.
Note
The term Windows, as it is used in this manual, refers to Windows 10 or higher.
3. Document Structure
Chapter 1, "Overview" provides an overview of the Availability Manager software, including security features.
Chapter 2, "Getting Started" tells how to set up and configure the Data Analyzer and Data Server, how to start the Data Server and Data Analyzer, use the main System Overview window, and select a group of OpenVMS systems and individual OpenVMS systems, called nodes.
Chapter 3, "Getting Information About Nodes" tells how to select nodes and display node data; it also explains what node data is.
Chapter 4, "Displaying OpenVMS Cluster Data" tells how to display OpenVMS Cluster summary and detailed data; it also explains what cluster data is.
Chapter 5, "Getting Information About Events" tells how to display and interpret events.
Chapter 6, "Performing Fixes on OpenVMS Nodes" tells how to take a variety of corrective actions, called fixes, to improve system availability.
Chapter 7, "Customizing the Availability Manager Data Analyzer" describes the tasks you can perform to filter, select, and customize the display of data and events.
Appendix A, "Location of the Availability Manager Configuration and Log Files" lists the Availability Manager configuration and log files, their default locations, and describes how to change the location of these files.
Appendix B, "CPU Process States" contains a table of CPU process states that are referred to in Sections 3.2.2.4 and 3.3.1.
Appendix C, "Tables of Events" contains a table of OpenVMS and Windows events that can be displayed in the Event pane discussed in Chapter 5, "Getting Information About Events".
Appendix D, "OpenVMS Events by Types of Data Collections" describes the events that can be signaled for each type of OpenVMS data that is collected.
4. Related Documents
VSI OpenVMS System Manager's Manual describes tasks for managing an OpenVMS system. It also describes installing a product with the POLYCENTER Software Installation utility.
VSI OpenVMS System Management Utilities Reference Manual describes utilities you can use to manage an OpenVMS system.
VSI OpenVMS Programming Concepts Manual explains OpenVMS lock management concepts.
For additional information about VSI OpenVMS products and services, please visit
the VSI OpenVMS website at http://www.vmssoftware.com or contact us at
<info@vmssoftware.com>.
5. VSI Encourages Your Comments
You may send comments or suggestions regarding this manual or any VSI document by sending electronic mail to the following Internet address: <docinfo@vmssoftware.com>. Users who have VSI OpenVMS support contracts through VSI can contact <support@vmssoftware.com> for help with this product.
6. Typographical Conventions
| Convention | Meaning |
|---|---|
|
Ctrl/x |
A sequence such as Ctrl/x indicates that you must hold down the key labeled Ctrl while you press another key or a pointing device button. |
|
PF1 x |
A sequence such as PF1 x indicates that you must first press and release the key labeled PF1 and then press and release another key or a pointing device button. |
... |
A horizontal ellipsis in examples indicates one of the
following possibilities:
|
. . . |
A vertical ellipsis indicates the omission of items from a code example or command format; the items are omitted because they are not important to the topic being discussed. |
|
( ) |
In command format descriptions, parentheses indicate that you must enclose the options in parentheses if you choose more than one. |
|
[ ] |
In command format descriptions, brackets indicate optional choices. You can choose one or more items or no items. Do not type the brackets on the command line. However, you must include the brackets in the syntax for OpenVMS directory specifications and for a substring specification in an assignment statement. |
|
[ | ] |
In command format descriptions, vertical bars separate choices within brackets or braces. Within brackets, the choices are options; within braces, at least one choice is required. Do not type the vertical bars on the command line. |
|
{ } |
In command format descriptions, braces indicate required choices; you must choose at least one of the items listed. Do not type the braces on the command line. |
|
bold text |
This typeface represents the introduction of a new term. It also represents the name of an argument, an attribute, or a reason. |
|
italic text |
Italic text indicates important information, complete titles of manuals, or variables. Variables include information that varies in system output (Internal error number), in command lines (/PRODUCER= name), and in command parameters in text (where dd represents the predefined code for the device type). |
|
UPPERCASE TEXT |
Uppercase text indicates a command, the name of a routine, the name of a file, or the abbreviation for a system privilege. |
|
|
Monospace type indicates code examples and interactive screen displays. In the C programming language, monospace type in text identifies the following elements: keywords, the names of independently compiled external functions and files, syntax summaries, and references to variables or identifiers introduced in an example. |
- |
A hyphen at the end of a command format description, command line, or code line indicates that the command or statement continues on the following line. |
|
numbers |
All numbers in text are assumed to be decimal unless otherwise noted. Nondecimal radixes – binary, octal, or hexadecimal – are explicitly indicated. |
Chapter 1. Overview
What is the Availability Manager?
How does the Availability Manager work?
How does the Availability Manager maintain security?
How does the Availability Manager identify possible performance problems?
1.1. What is the Availability Manager?
Note
The Availability Manager documentation uses the term node to refer to an OpenVMS or Windows system.
The Availability Manager helps system managers and analysts target a specific node, process, or device for detailed analysis. This tool collects system, process, and device data from multiple OpenVMS nodes simultaneously, analyzes the data, and displays the output using a graphical user interface (GUI).
Features and Benefits
|
Feature |
Description |
|---|---|
|
Immediate notification of problems |
Based on its analysis of data, the Availability Manager notifies you immediately if any node you are monitoring is experiencing a performance problem, especially one that affects the node's accessibility to users. At a glance, you can see whether a problem is a persistent one that warrants further investigation and correction. |
|
Centralized management |
Provides centralized management of remote nodes within an extended local area network (LAN). |
|
Intuitive interface |
Provides an easy-to-use graphical user interface (GUI). |
|
Correction capability |
Allows real-time intervention, including adjustment of node and process parameters, even when remote nodes are hung. |
|
Uses its own protocol |
An important advantage of the Availability Manager is that it uses its own network protocol. Unlike most performance monitors, the Availability Manager does not rely on TCP/IP or any other standard protocol. Therefore, even if a standard protocol is unavailable, the Availability Manager can continue to operate. |
|
Customization |
Using a wide range of customization options, you can customize the Availability Manager to meet the requirements of your particular site. For example, you can change the severity levels of the events that are displayed and escalate their importance. |
|
Scalability |
Makes it easier to monitor multiple OpenVMS nodes. |
Figure 1.1, ''System Overview Window'' is an example of the initial System Overview window of the Availability Manager.
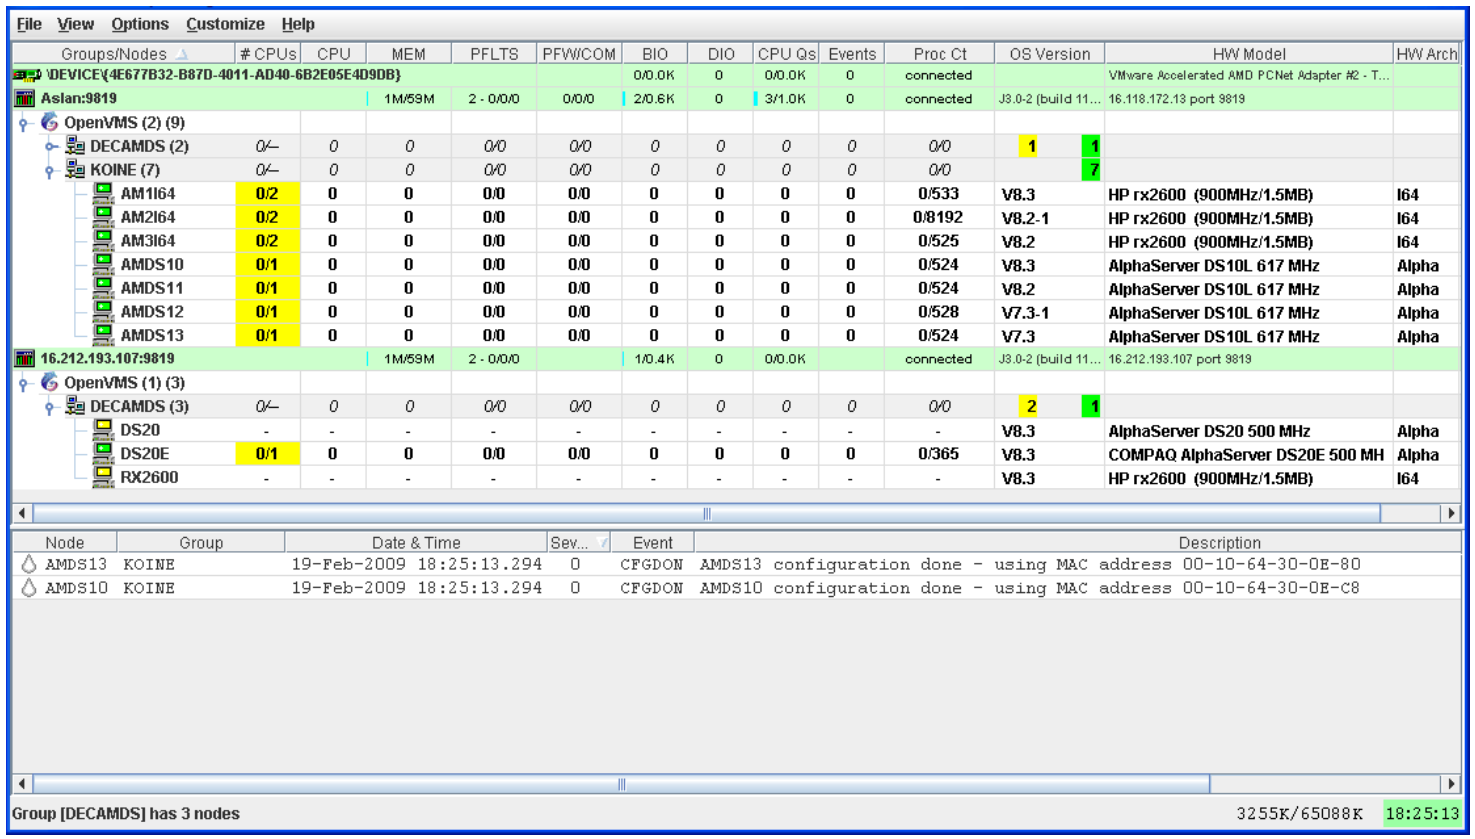 |
In the upper section of the display, there is a list of user-defined groups and a list of nodes in each group. You can compress the display to only the name of a group by clicking the handle preceding the group name. The summary group line remains, showing the collected information for all the nodes in the group, as in the DECAMDS group in Figure 1.1, ''System Overview Window''.
If a node name displays a red icon, you can hold the cursor over the icon, the node name, or the number in the Events column to display a tool tip explaining what the problem is; for example, for the node DBGAVC, the following message is displayed:HIHRDP, high hard page fault rate
This section of the window is called the Group/Node pane.
In the lower section of the window, events are posted, alerting you to possible problems on your system. The items on the pane vary, depending on the severity of the problem: the most severe problems are displayed first. This section of the window is called the Event pane.
1.2. How Does the Availability Manager Work?
Data Collector
This runs on OpenVMS nodes and collects data from them.
Data Analyzer
This runs on an OpenVMS or Windows node; it displays collected data in an easy-to-use graphical user interface (GUI).
Data Server
This runs on an OpenVMS or Windows node; it allows the Data Collector and Data Analyzer to communicate over a wide area network (WAN) using the Internet Protocol (IP) suite.
The way these parts work together on an extended LAN and on a WAN is described in the next two sections.
1.2.1. Data Analyzer and Data Collector on the Same Extended LAN
The Data Analyzer and Data Collector communicate over an extended LAN using an IEEE 802.3 Extended Packet format protocol. Once a connection between a Data Analyzer and a Data Collector is established, the Data Analyzer instructs the Data Collector to gather specific system, process, and device data.
Although the Data Analyzer can be run on a member of a monitored OpenVMS cluster, it is typically run on a system that is not a member of a monitored cluster. This setup allows the Data Analyzer to continue to function even when the monitored cluster hangs.
Only one Data Analyzer can run on a system at a time.
Communication between the Data Analyzer and Data Collectors is not routable in an IP network.
Note
        Protocol ID:        08-00-2B-80-48
        Multicast Address:  09-00-2B-02-01-09
If your routers filter protocols in your network, add these values to your network protocols so that the private transport is propagated over the routers.
Figure 1.2, ''Availability Manager Node Configuration for an Extended LAN'' shows a possible configuration of nodes running Data Analyzers and Data Collectors on an extended LAN.
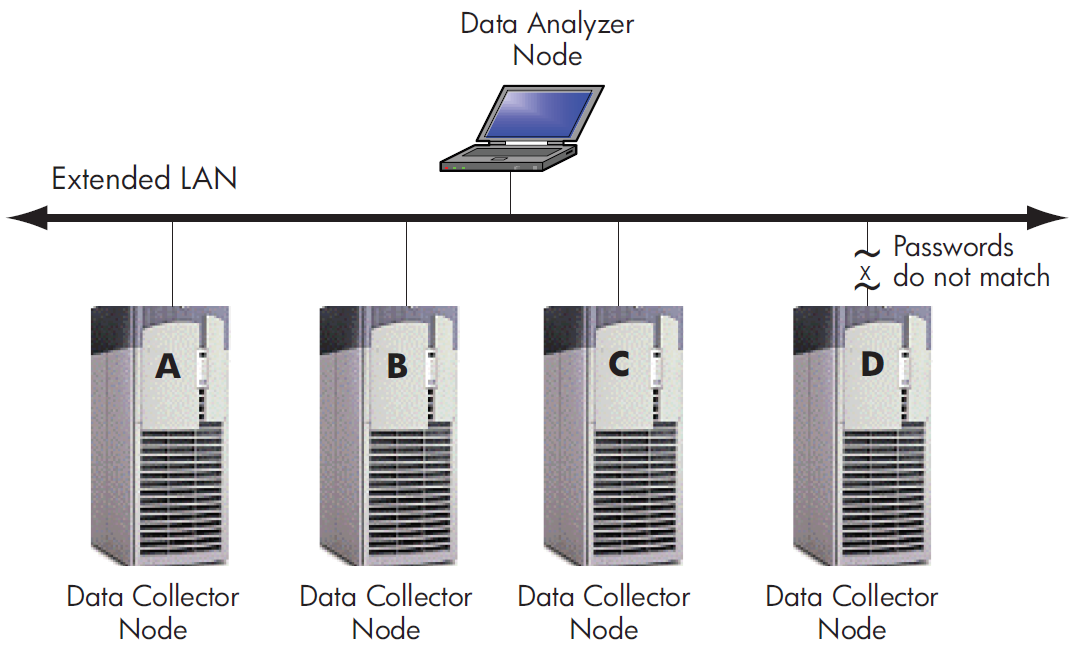
In Figure 1.2, ''Availability Manager Node Configuration for an Extended LAN'', the Data Analyzer can monitor nodes A, B, and C across the network. The password for the Data Collector on node D does not match the password of the Data Analyzer; therefore, the Data Analyzer cannot monitor node D. For information about password security, see Section 1.3, ''How Does the Availability Manager Maintain Security?''.
Requesting and Receiving Information Over an Extended LAN
After installing the Availability Manager software, you can begin to request information from Data Collectors on one or more nodes.
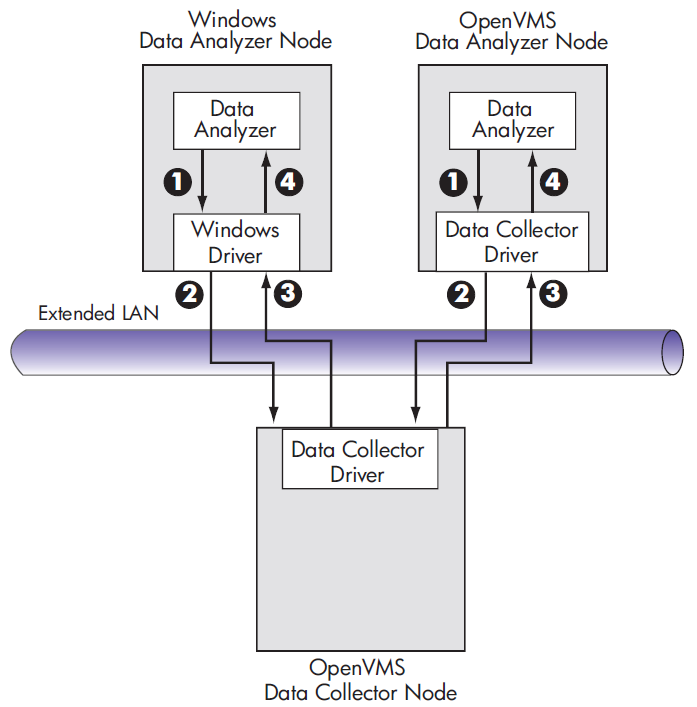
Requesting and receiving information requires the Availability Manager to perform a number of steps, which are shown in Figure 1.3, ''Requesting and Receiving Information Over an Extended LAN'' and explained in the text following the figure.
 |
The Data Analyzer passes a user's request for data to the driver on the Data
Analyzer node:
|
 |
The driver on the Data Analyzer transmits the request across the network to the driver on the Data Collector node. |
 |
The driver on the Data Collector transmits the requested information as data over the network to the driver on the Data Analyzer node. |
 |
The driver on the Data Analyzer node passes the data to the Data Analyzer, which displays the data. |
In step 4, the Data Analyzer also checks the data against various thresholds and conditions, and posts events if the thresholds are exceeded or the conditions met. Section 1.4, ''How Does the Availability Manager Data Analyzer Identify Performance Problems?'' explains how data analysis and event detection work.
Data Collector Notes
There are some characteristics to note about the Data Collector drivers on OpenVMS and Windows.
The Data Collector on a Data Collector node can collect data for more than one Data Analyzer node at the same time.
The Data Collector driver on an OpenVMS Data Analyzer node can only support one Data Analyzer at a time.
The Data Collector driver on a Windows Data Analyzer node can only support one Data Analyzer connection to a network adapter at a time.
1.2.2. Data Analyzer and Data Collector Connected Over a WAN
The Data Analyzer can communicate only with Data Collectors that are on an extended LAN. (LANs are usually limited to a building or even just to a computer room.) However, you might need to run a Data Analyzer on a node that is not part of an extended LAN – for example, from home or at another site. To do this, you must add a Data Server node to your extended LAN.
The purpose of the Data Server node is to relay data between the Data Analyzer and Data Collectors. The Data Server formats data for transport to and from the Data Analyzer over a Wide Area Network.
Figure 1.2, ''Availability Manager Node Configuration for an Extended LAN'' is an example of an extended LAN. Figure 1.4, ''Availability Manager Node Configuration for a WAN'' is an example of adding a Data Server and WAN connection to Figure 1.2, ''Availability Manager Node Configuration for an Extended LAN''.
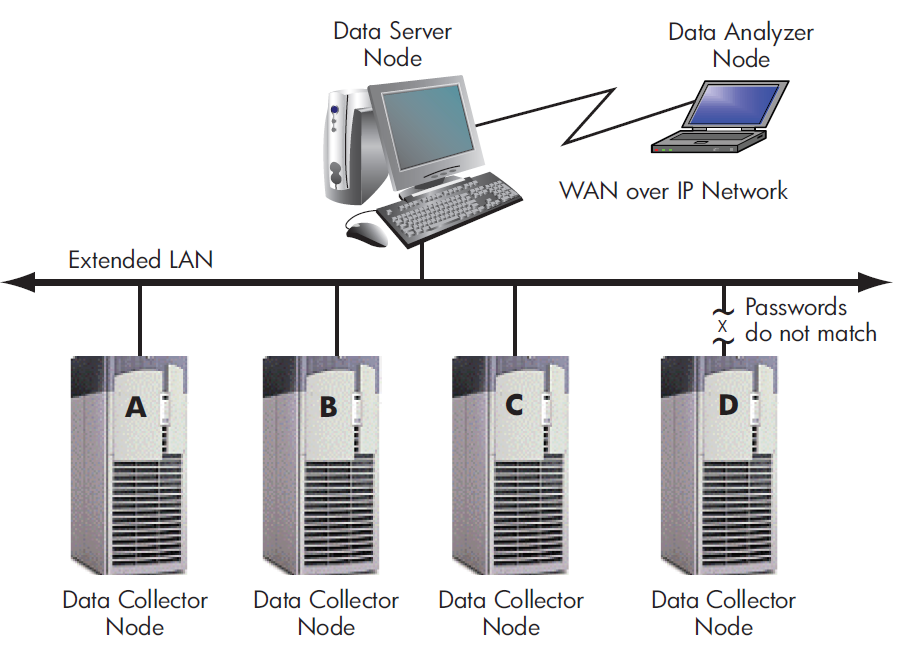
In Figure 1.4, ''Availability Manager Node Configuration for a WAN'', the Data Analyzer monitors Data Collector nodes by passing data through the Data Server. When you start the Data Analyzer, you direct it to connect to the Data Server over the WAN. Once the connection is established, the Data Analyzer can connect to Data Collectors through the Data Server and start collecting data.
Requesting and Receiving Information Over a WAN
After installing the Availability Manager software, you can begin to request information from Data Collectors on one or more nodes.
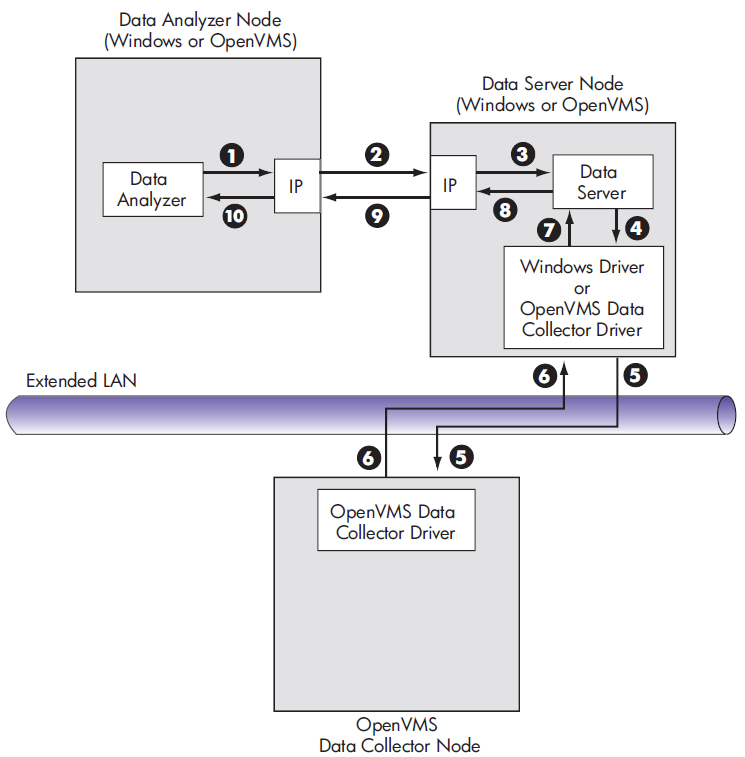
Requesting and receiving information requires the Availability Manager to perform a number of steps, which are shown in Figure 1.5, ''Requesting and Receiving Information Over a WAN'' and explained in the text following the figure.
|
The Data Analyzer passes a user's request for data to the IP socket connection on the Data Analyzer node. |
|
Using a secure socket, the IP socket transmits the request to the IP socket connection on the Data Server node. |
|
The IP socket on the Data Server node passes the request to the Data Server. |
|
The Data Server passes the request to the Windows driver or OpenVMS Data
Collector driver:
|
 |
The driver on the Data Server transmits the request across the network to the driver on the Data Collector node. |
 |
The driver on the Data Collector transmits the requested information as data over the network to the driver on the Data Server node. |
 |
The driver on the Data Server node passes the data to the Data Server. |
 |
The Data Server passes the data to the IP socket connection. |
 |
The IP socket on the Data Server node transmits the data to the IP socket on the Data Analyzer node. |
 |
The IP socket on the Data Analyzer node passes the data to the Data Analyzer, which displays the data. |
Note
More than one Windows or OpenVMS Data Analyzer node can connect to a Data Server node.
A Data Analyzer can connect to one or more Data Servers.
1.3. How Does the Availability Manager Maintain Security?
The Availability Manager uses passwords to maintain security. Passwords are eight alphanumeric characters long. The Data Analyzer stores passwords in its customization file. On OpenVMS Data Collector nodes, passwords are part of a three-part security code called a security triplet.
The following sections explain these security methods further.
1.3.1. Data Analyzer Password Security
For monitoring to take place, the password on a Data Analyzer node must match the password section of a security triplet on each OpenVMS Data Collector node. OpenVMS Data Collectors also impose other security measures, which are explained in Section 1.3.2, ''OpenVMS Data Collector Security''. This password match is used whether or not a Data Server is involved in the connection between the Data Analyzer and the Data Collector.
Figure 1.6, ''Availability Manager Password Matching'' illustrates how you can use passwords to limit access to node information.
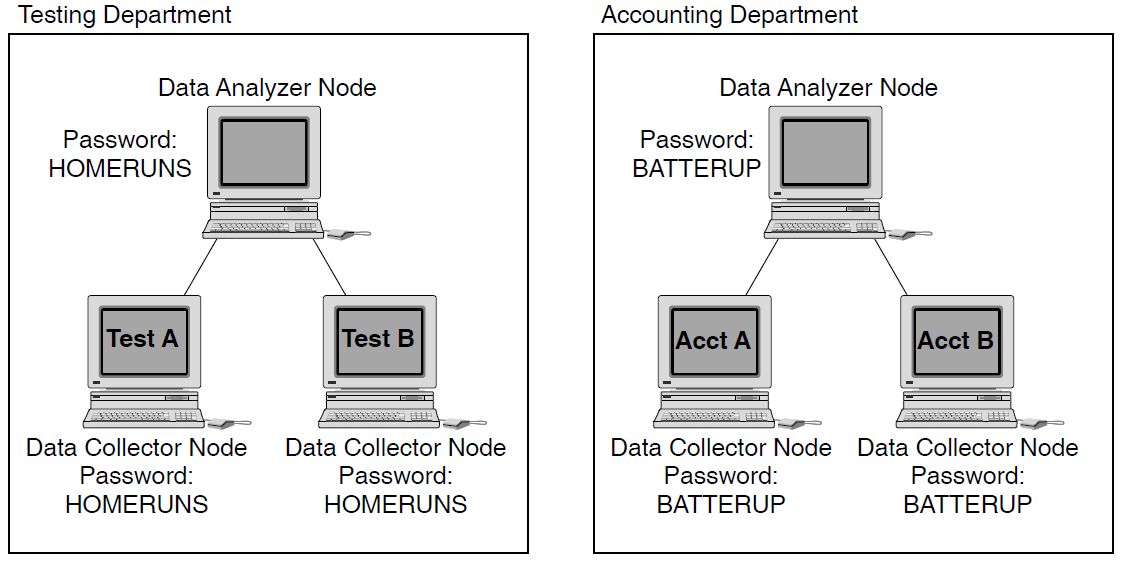
As shown in Figure 1.6, ''Availability Manager Password Matching'', the Testing Department's Data Analyzer, whose password is HOMERUNS, can access only OpenVMS Data Collector nodes with the HOMERUNS password as part of their security triplets. The same is true of the Accounting Department's Data Analyzer, whose password is BATTERUP; it can access only OpenVMS Data Collector nodes with the BATTERUP password as part of their security triplets.
The Availability Manager sets a default password when you install the Data Analyzer. To change that password, you must use the OpenVMS Security Customization page (see Figure 7.21, ''OpenVMS Security Customization''), which is explained in Chapter 7, "Customizing the Availability Manager Data Analyzer".
1.3.2. OpenVMS Data Collector Security
Availability Manager data-transfer security
Each OpenVMS node running as a Data Collector has a file containing a list of security triplets. For Data Analyzer and Data Collector nodes to exchange data, the Data Analyzer password must match one of the passwords in the list of security triplets.
In addition, the triplet specifies the type of access a Data Analyzer has. By specifying the hardware address of the Data Analyzer, the triplet can also restrict which Data Analyzer nodes are able to access the Data Collector.
Section 1.3.3, ''Changing Security Triplets on OpenVMS Data Collector Nodes'' explains security triplets and how to edit them.
Availability Manager security log
An OpenVMS Data Collector logs all access denials and executed write instructions to the operator communications manager (OPCOM). Messages are displayed on all terminals that have OPCOM enabled (with the REPLY/ENABLE command). OPCOM also puts messages in the SYS$MANAGER:OPERATOR.LOG file.
Each security log entry contains the network address of the initiator. If access is denied, the log entry also indicates whether a read or write was attempted. If a write operation was performed, the log entry indicates the process identifier (PID) of the affected process.
OpenVMS file protection and process privileges
When the Availability Manager is installed, it creates a directory (SYS$COMMON:[AMDS$AM]) and sets directory and file protections on it so that only the SYSTEM account can read the files in that directory. For additional security on these system-level directories and files, you can create access control lists (ACLs) to restrict and set alarms on write access to the security files. For more information about creating ACLs, see the VSI OpenVMS Guide to System Security.
1.3.3. Changing Security Triplets on OpenVMS Data Collector Nodes
To change security triplets on an OpenVMS Data Collector node, you must edit the AMDS$DRIVER_ACCESS.DAT file, which is installed on all Data Collector nodes. The following sections explain what a security triplet is, how the Data Collector uses it, and how to change it.
1.3.3.1. Understanding OpenVMS Security Triplets
A security triplet determines which nodes can access system data from an OpenVMS Data Collector node. The AMDS$DRIVER_ACCESS.DAT file on OpenVMS Data Collector nodes lists security triplets.
On OpenVMS Data Collector nodes, the AMDS$AM_SYSTEM logical translates to the location of the default security file, AMDS$DRIVER_ACCESS.DAT. This file is installed on all OpenVMS Data Collector nodes.
A network address (hardware address or wildcard character)
An 8-character alphanumeric password
The password is not case sensitive (so the passwords "testtest" and "TESTTEST" are considered to be the same).
A read, write, or control (R, W, or C) access verification code
The exclamation point (!) is a comment delimiter; any characters to the right of the comment delimiter are ignored.
Example
*\FINGROUP\R   ! Let anyone with FINGROUP password monitor
               ! system, process, or device data
               !
2.1\DEVGROUP\W ! Let only DECnet node 2.1 with
               ! DEVGROUP password perform fixes (writes)
1.3.3.2. How to Change a Security Triplet
Network address\password\access
Use a backslash character (\) to separate the three fields.
Edit the network address.
The network address can be either of the following:Hardware address
The hardware address field is the physical hardware address in the LAN device chip. It is used if you have multiple LAN devices or are running the DECnet-Plus for OpenVMS networking software on the system (not the DECnet Phase IV for OpenVMS networking software).
For devices provided by VSI, the hardware address is in the form 08-00-2B-xx-xx-xx, where the 08-00-2B portion is VSI's valid range of LAN addresses as defined by the IEEE 802 standards, and the xx-xx-xx portion is chip specific.
To determine the value of the hardware address on a node, use the OpenVMS System Dump Analyzer (SDA) as follows:$ ANALYZE/SYSTEM SDA> SHOW LAN
These commands display a list of available devices. Choose the template device of the LAN device you will be using, and then enter the following command:SDA> SHOW LAN/DEVICE=xxA0
DECnet Phase IV address
For nodes running DECnet for OpenVMS Phase IV, the Phase IV address can be used. To determine the Phase IV address, use the SHOW NETWORK command. If the node has a Phase IV address, it will be in the Address(es) field of the output.
Wildcard address
The wildcard character (*) allows any incoming triplet with a matching password field to access the Data Collector node. Use the wildcard character to allow read access and to run the console application from any node in your network.
Caution: Use of the wildcard character for write-access or control-access security triplets enables any person using that node to perform system-altering fixes.
Edit the password field.
The password field must be an 8-byte alphanumeric field. The Availability Manager forces upper-case on the password, so "aaaaaaaa" and "AAAAAAAA" are essentially the same password to the Data Collector.
The password field gives you a second level of protection when you want to use the wildcard address denotation to allow multiple modes of access to your monitored system.
- Enter R, W, or C as an access code:
R means READONLY access to the Data Analyzer.
W means READ/WRITE access to the Data Analyzer. (WRITE implies READ.)
C means CONTROL access to the Data Analyzer. CONTROL allows you to manipulate objects from which data are derived. (CONTROL implies both WRITE and READ.)
*\1decamds\r   ! Anyone with password "1decamds" can monitor
*\1decamds\w   ! Anyone with password "1decamds" can monitor or write
2.1\1decamds\r ! Only node 2.1 with password "1decamds" can monitor
2.1\1decamds\w ! Only node 2.1 with password "1decamds" can monitor and
               ! write
08-00-2b-03-23-cd\1decamds\w ! Allows a particular hardware address to
                             ! write
08-00-2b-03-23-cd\1decamds\r ! Allows a particular hardware address to
! read node*\1DECAMDS\R *\KOINECLS\R *\KOINEFIX\W *\AVAILMAN\C
In this example, Data Analyzer nodes with the passwords 1DECAMDS and KOINECLS are able to access monitored data from the Data Collector, but only the Data Analyzer node with the KOINEFIX password is able to write or change information, including performing fixes, on the Data Collector node. The Data Analyzer node with the AVAILMAN password is able to perform switched LAN fixes and other control functions.
*\1DECAMDS\R
08-00-2B-03-23-CD\2NODEFIX\C
Note
After editing the AMDS$DRIVER_ACCESS.DAT file, you must stop and then restart the Data Collector. This action loads the new data into the driver.
1.3.4. Processing Security Triplets
A multicast "Hello" message is broadcast at regular intervals to all nodes within the LAN indicating the availability of a Data Collector node to communicate with a Data Analyzer node.
The node running the Data Analyzer receives the message, returns a password to the Data Collector, and requests system data from the Data Collector.
- The password and network address of the Data Analyzer are used to search the security triplets in the AMDS$DRIVER_ACCESS.DAT file.
If the Data Analyzer password and network address match one of the security triplets on the Data Collector, then the Data Collector and the Data Analyzer can exchange information.
If the Data Analyzer password and network address do not match any of the security triplets, then access is denied and a message is logged to OPCOM. (See Table 1.2, ''Logical Names for OPCOM Messages'' for more information on logging this type of message.) In addition, the Data Analyzer receives a message stating that access to that node is not permitted.
|
Security Triplet |
Interpretation |
|---|---|
|
08-00-2B-12-34-56\HOMETOWN\W |
The Data Analyzer has write access to the node only when the Data Analyzer is run from a node with this hardware address (multi-adapter or DECnet-Plus system) and with the password HOMETOWN. |
|
2.1\HOMETOWN\R |
The Data Analyzer has read access to the node when run from a node with DECnet for OpenVMS Phase IV address 2.1 and the password HOMETOWN. |
|
*\HOMETOWN\R |
Any Data Analyzer with the password HOMETOWN has read access to the node. |
Sending Messages to OPCOM
|
AMDS$RM_OPCOM_READ |
A value of TRUE logs read failures to OPCOM. |
|
AMDS$RM_OPCOM_WRITE |
A value of TRUE logs write failures to OPCOM. |
$ @SYS$STARTUP:AMDS$STARTUP RESTART1.4. How Does the Availability Manager Data Analyzer Identify Performance Problems?
When the Data Analyzer detects problems on your system, it uses a combination of methods to bring these problems to your attention. It examines both the types of data collected and how often it is collected and analyzes the data to determine problem areas to be signaled. Performance problems are also posted in the Event pane, which is in the lower portion of the System Overview window (Figure 1.1, ''System Overview Window'').
Collecting and analyzing data
Posting events
1.4.1. Collecting and Analyzing Data
This section explains how the Data Analyzer collects and analyzes data. It also defines related terms.
1.4.1.1. Events and Data Collection
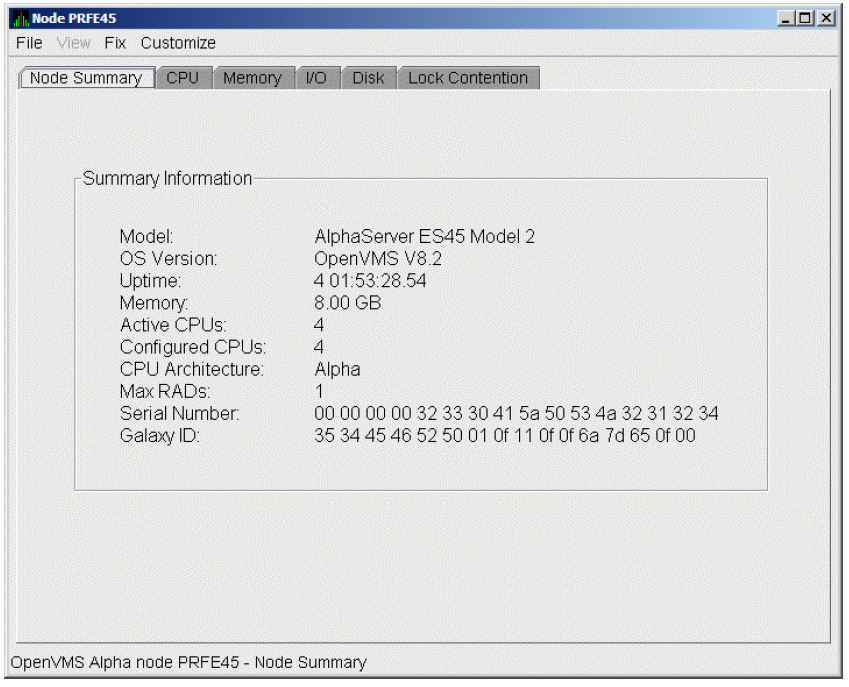
The data that the Data Analyzer collects is grouped into data collections. These collections are composed of related data – for example, CPU data, memory data, and so on. Usually, the data items on the tabs (like the ones displayed in Figure 1.7, ''Sample Node Summary'') consist of one data collection.
An event is a problem or potential problem associated with resource availability. Events are associated with various data collections. For example, the CPU Process data collection shown in Figure 1.8, ''Data Collection Customization'' is associated with the PRCCUR, PRCMWT, and PRCPWT events. (Appendix C, "Tables of Events" describes events, and Appendix D, "OpenVMS Events by Types of Data Collections" describes the events that each type of data collection can signal.) For these events to be signalled, you must enable the CPU Process data collection, as described in Section 1.4.1.2, ''Types of Data Collection''.
Users can also customize criteria for events, which is described in Section 1.4.2, ''Posting Events''.
1.4.1.2. Types of Data Collection
You can use the Data Analyzer to collect data either as a background activity or as a foreground activity.
Background data collection
When you enable background collection of a specific type of data collection on a specific node, the Data Analyzer collects that data whether or not any windows are currently displaying data for that node.
To enable background data collection, select the checkbox for a specific type of data collection on the Data Collection Customization page (Figure 1.8, ''Data Collection Customization''). The title bar at the top of the dialog shows the level of the customization settings. The title bar in Figure 1.8, ''Data Collection Customization'' indicates that the settings are for all OpenVMS nodes. For group level and node level settings, the title bar indicates the group name or node name. If the window applies to a specific node, the properties you set apply only to that node.
Chapter 7, "Customizing the Availability Manager Data Analyzer" contains additional instructions for customizing data collection properties.
Figure 1.8. Data Collection Customization 
Foreground data collection
Foreground data collection occurs automatically when you open any data page for a specific node. To open a node data page, double-click a node name in the Node pane of the System Overview window (Figure 1.1, ''System Overview Window''). The Node Summary page is the first page displayed (by default); Figure 1.7, ''Sample Node Summary'' is an example. At the top of the page are tabs that you can select to display other data pages for that node.
Foreground data collection for all data collections related to the node begins automatically when any node data page is displayed. Foreground data collection ends when all node data pages have been closed.
Chapter 3, "Getting Information About Nodes" contains instructions for selecting nodes and displaying node data.
1.4.1.3. Data Collection Intervals
|
Interval |
Type of Data Collection |
Description |
|---|---|---|
|
NoEvent |
Background |
How often data is collected if no events have been posted for that type of data. The Data Analyzer starts background data collection at the NoEvent interval (for example, every 75 seconds). If no events have been posted for that type of data, the Data Analyzer starts a new collection cycle every 75 seconds. |
|
Event |
Background |
How often data is collected if any events have been posted for that type of data. The Data Analyzer continues background data collection at the Event interval until all events for that type of data have been removed from the Event pane. Data collection then resumes at the NoEvent interval. |
|
Display |
Foreground |
How often data is collected when the page for a specific node is open. The Data Analyzer starts foreground data collection at the Display interval and continues this rate of collection until the display is closed. Data collection then resumes as a background activity. |
1.4.2. Posting Events
The Data Analyzer evaluates each data collection for events. The Data Analyzer posts events when data values in a data collection meet or exceed user-defined thresholds and occurrences. Values for thresholds and occurrences are displayed on Event Customization pages similar to the one shown in Figure 1.9, ''Sample Event Customization''. Thresholds and occurrences are described in the next section.

1.4.2.1. Thresholds and Occurrences
Thresholds and occurrences are criteria that the Data Analyzer uses for posting events.
A threshold is a value against which data in a data collection is compared. An occurrence is a value that represents the number of consecutive data collections that meet or exceed the threshold.
Both thresholds and occurrences are customizable values that you can adjust according to the needs of your system. For details about how to change the values for thresholds and occurrences, see Chapter 7, "Customizing the Availability Manager Data Analyzer".
Relationship Between Thresholds and Occurrences
For a particular event, when the data collected meet or exceed the threshold, the data collection enters a threshold-exceeded state. When the number of consecutive data collections to enter this state meets or exceeds the value in the Occurrence box (see Figure 1.9, ''Sample Event Customization''), the Data Analyzer displays (posts) the event in the Event pane.
A closer look at Figure 1.9, ''Sample Event Customization'' shows the relationship between
thresholds and occurrences. For the DSKERR, high disk device error count
event, a threshold of 15 errors has been set. A value of 2 in the Occurrence box indicates
that the number of errors during 2 consecutive data collections must meet or exceed the
threshold of 15 for the DSKERR event to be posted.
Another example of the relationship between thresholds and occurrences is for the
HINTER, High interrupt mode time event. If the threshold setting is 30%,
and the occurrence setting is 3, then the event is signaled if three consecutive data
collections have the interrupt mode time greater or equal to 30%. Using the occurrence
setting of 3 helps to show more long-term trends in the interrupt time, and not occasional
spikes where only 1 or 2 data collections have exceeded the threshold.
Chapter 2. Getting Started
How to configure and start the Availability Manager Data Collector
How to start the Availability Manager Data Server
How to start the Availability Manager Data Analyzer
How to use the main System Overview window
How to display basic node data
For information about installing the VSI Availability Manager on OpenVMS or Windows systems, see the VSI Availability Manager Installation Instructions.
2.1. Configuring and Starting the Data Collector
Configuration tasks include defining logical names and setting passwords. After you complete these tasks, you can start the Data Collector. The following sections describe all of these operations.
2.1.1. Defining Logical Names
The Availability Manager provides a template file that system managers can modify to define the logical names used by the Data Collector. You can copy the file SYS$MANAGER:AMDS$SYSTARTUP.TEMPLATE to SYS$MANAGER:AMDS$SYSTARTUP.COM and edit it to change the default logicals that are used to start the Data Collector and to find its configuration files.
|
Logical |
Description |
|---|---|
|
AMDS$GROUP_NAME |
Specifies the group that this node will be associated with when it is monitored. |
|
AMDS$DEVICE |
For nodes with more than one network adapter, allows you to specify which adapter the Data Collector should use. |
|
AMDS$RM_DEFAULT_INTERVAL |
The number of seconds between multicast "Hello" messages from the Data Collector to the Data Analyzer node when the Data Collector is not servicing one or more Data Analyzers with data. The minimum value is 5. The maximum value is 300. |
|
AMDS$RM_SECONDARY_INTERVAL |
The number of seconds between multicast "Hello" messages from the Data Collector to the Data Analyzer node when the Data Collector is servicing one or more Data Analyzers with data. The minimum value is 5. The maximum value is 600. |
Note
Multicast "Hello" messages are notifications from nodes to the Data Analyzer. This is the way the Data Analyzer discovers Data Collectors on the network.
- AMDS$RM_DEFAULT_INTERVAL
- AMDS$RM_SECONDARY_INTERVAL
The file containing these logicals is in SYS$MANAGER:AMDS$LOGICALS.COM. The shorter the time interval, the faster the node is discovered and configured with a minimal increase in network traffic.
2.1.2. Setting Passwords
SYS$MANAGER:AMDS$DRIVER_ACCESS.DATThe passwords section of the file is close to the end of the file, after the Password documentation section. The passwords in this file correspond to the passwords in the Security page shown in Section 7.9.1, ''Customizing Passwords for Groups and Nodes''. Note that you can specify a list of passwords in this file. See the comments in the file for details.
2.1.3. Starting the Data Collector
Beginning with OpenVMS Version 7.2, the files needed to run the Data Collector on OpenVMS nodes are shipped with the OpenVMS operating system. However, if you want the latest Data Collector software, you need to install it from the Availability Manager Data Collector kit. Once the Data Collector is running on a node, you can monitor that node using the Availability Manager Data Analyzer.
$ @SYS$STARTUP:AMDS$STARTUP START $ @SYS$STARTUP:AMDS$STARTUP START $ @SYS$STARTUP:AMDS$STARTUP RESTARTNote
$ RUN SYS$SYSTEM:SYSMAN
SYSMAN> SET ENVIRONMENT/CLUSTER
SYSMAN> DO @SYS$STARTUP:AMDS$STARTUP START
SYSMAN> EXIT
$
2.2. How to start the Data Analyzer
This section describes what you need to do after the Availability Manager Data Analyzer is installed. Starting the Data Analyzer is somewhat different on OpenVMS than on Windows systems. However, on both systems, starting the Data Analyzer automatically starts the Java™ graphical user interface (GUI), which allows you to view information that is collected from Data Collectors running on OpenVMS nodes.
The following sections contain the sequence of steps required to start the Data Analyzer on an OpenVMS node and a Windows node.
Note
The locations of the Data Analyzer and Data Server files are listed in Appendix A, "Location of the Availability Manager Configuration and Log Files". The method for changing the locations are also listed in this appendix.
2.2.1. Starting the Data Analyzer on an OpenVMS Node
To start a Data Analyzer on an OpenVMS Alpha, an IA64, or an x86-64 node, make sure that:
The Data Analyzer is installed on the node from which you want to monitor other nodes.
The Data Collector is started (see Section 2.1.3, ''Starting the Data Collector'').
Starting the Data Collector accomplishes the following important tasks:
Defines the various AMDS$* logicals needed by the Data Analyzer.
Allows the Data Analyzer to communicate with the Data Collector on the network.
To start the Data Analyzer, enter the following command:
$ AVAIL/ANALYZER
The Data Analyzer displays the Network Connection dialog box, which is shown in Figure 2.1, ''Network Connection Dialog Box''.
Note
For a list of qualifiers you can use with the AVAIL/ANALYZER command, see the VSI Availability Manager Installation Instructions, or enter HELP AVAIL at the DCL dollar prompt and then enter the qualifier.
2.2.2. Starting the Data Analyzer on a Windows Node
To start the Data Analyzer on a Windows node, first make sure that the Availability Manager for Windows is installed on the node.
Click the Windows button and type "Data" in the search box to display the components of the Availability Manager.
Click Data Analyzer Startup. The Availability Manager displays the application window.
2.3. Do You Need to Set Up a Data Server?
At this point, you must determine whether you need to use a Data Server to communicate with the Data Collectors. For an overview of what a Data Server is and how it works, see Section 1.2.2, ''Data Analyzer and Data Collector Connected Over a WAN''.
If the analyzer system is on the same extended LAN as the Data Collectors, you can use a network adapter on the analyzer system to connect with the Data Collectors. If this is the case, you do not need to set up the Data Server. To continue starting the Data Analyzer without a Data Server, go to Section 2.6, ''Using the Network Connection Dialog Box to Start Collecting Data''.
If the Data Analyzer is on a different extended LAN than the Data Collectors, you must set up the Data Server on a server system that is on the same extended LAN as the Data Collectors. To set up secure communication between the Data Analyzer and Data Server, see Section 2.4, ''Setting Up Secure Server Communications Between the Data Analyzer and Data Server''.
Note
The Data Collector on an OpenVMS system only allows one Data Analyzer or Data Server to use it for communicating with other Data Collectors (see the section called “Data Collector Notes” under Section 1.2.1, ''Data Analyzer and Data Collector on the Same Extended LAN''). If you want to run both the Data Server and Data Analyzer on the same OpenVMS system, VSI recommends that you run the Data Server to communicate with the other Data Collectors, and then let the Data Analyzer connect to the Data Server. This setup is similar to the one shown in Figure 1.4, ''Availability Manager Node Configuration for a WAN'' and the section called “Requesting and Receiving Information Over a WAN” under Section 1.2.2, ''Data Analyzer and Data Collector Connected Over a WAN''. In this case, the Data Analyzer and Data Server are running on the same node (Data Server node), and use an internal IP connection for communications.
2.4. Setting Up Secure Server Communications Between the Data Analyzer and Data Server
Note
The following terminology is used in the next sections:
Data Server refers to the Availability Manager Data Server software.
Server system refers to the hardware that runs the Data Server software.
Analyzer system refers to the hardware that runs the Data Analyzer software.
Combined kit refers to the kit that includes both the Data Analyzer and the Data Server kit.
Note the following:
The server system and analyzer system can be either an OpenVMS system or a Windows system.
Any analyzer system can connect to any server system. The operating system and hardware platform make no difference to the operation of the Availability Manager.
To collect data over a WAN, the Data Analyzer communicates with a Data Server. The Data Server is a Java-based program that runs on OpenVMS or Windows. Except for differences in starting the Data Server on OpenVMS and Windows, the following section applies to both operating systems.
The Availability Manager uses an encrypted connection for secure communication between the Data Analyzer and the Data Server. The following sections describe how to set up the Data Analyzer and Data Server to use a secure communication link.
2.4.1. Introduction to Secure Communications
The Availability Manager uses Transport Layer Security (TLS) Version 1 for secure communication between the Data Analyzer and the Data Server. TLS is an extension of Secure Sockets Layer (SSL) Version 3.0, which is the most widely used protocol for security on the web.
TLS uses public key cryptography (also called asymmetric cryptography) to guarantee secure communication over a network. This type of cryptography uses an encryption algorithm that produces a pair of keys:
A public key provides authentication, and is made public to any interested party as a trusted certificate.
A private key that works with trusted certificates to provide privacy and data integrity
What one key encrypts, only the other key can decrypt. Together, these two keys are known as an asymmetric key pair.
Key Pairs, Key Stores, and Trust Stores
Before you can use the Data Server, you must create an asymmetric key pair. This key pair is associated with the Data Server, and is used by the Data Server and Data Analyzer to establish an encrypted communication link between them.
The Data Server stores the public and private key associated with it in a key store. The Data Server key store is the file AM$KeyStore.jks that resides on the server system. Currently, VSI supports configurations in which the Data Server has only one key pair in a key store.
Note
For the default locations for the AM$KeyStore.jks and AM$TrustStore.jks files on OpenVMS and Windows systems and how to change these locations, see Appendix A, "Location of the Availability Manager Configuration and Log Files".
You create and store the key pair after installing either the combined kit (for OpenVMS) or the Availability Manager kit (for Windows). The next sections describe how to perform the following tasks:
Creating the key pair from either the server or analyzer system
Store the key pair in a key store on a server system
Store the public key in a trust store on an analyzer system
2.4.2. Methods of Setting Up Secure Communications
The key store and trust store are created and maintained by dialog boxes in the Data Analyzer. The Data Analyzer is used for key management because it is the part of the Availability Manager that uses a GUI interface. By using the GUI interface, keys are managed the same way on OpenVMS and Windows platforms. This also keeps the Data Server from having the overhead of the dialog boxes used for creating and maintaining key and trust stores.
There are two basic methods of setting up secure communications. Both methods create a key store for the Data Server and a trust store for the Data Analyzer. The difference is that one creates the key store using the server system, and the other creates the key store from the analyzer system. Using one method or the other is sufficient to set up secure communications between the Data Analyzer and Data Server.
2.4.2.1. Setup Using the Server System
Creating the key store from the server system is the simplest method. You create the key store and export the public key using the Data Analyzer on the server system, copy the public key to the analyzer system, and import the public key with the Data Analyzer on the analyzer system. For a description of this method, see Section 2.4.3, ''Steps for Setting Up Secure Communications from the Server System''.
Using this method assumes that you can use the Data Analyzer's GUI interface on the server system. You can start the Data Analyzer on the server system and display the GUI on the following:
the server graphics console
another OpenVMS system that does have a graphics console
a Windows system that has software to accept and display an X Windows GUI
If this is not possible, use the alternate method to create and maintain key stores described in Section 2.4.2.2, ''Setup Using the Analyzer System''.
2.4.2.2. Setup Using the Analyzer System
With this method, you create the key store and export the public key using the Data Analyzer on the analyzer system, and copy the key store to the server system. This method is described in Section 2.4.4, ''Steps for Setting Up Secure Communications from the Analyzer System''.
2.4.3. Steps for Setting Up Secure Communications from the Server System
The following section describes how to set up the Data Server from the server system. It also describes the key setup for the Data Analyzer that runs on the server system. The procedure involves the following tasks:
Creating the key pair for the Data Server, including the option of generating and storing the trust store for the Data Analyzer on the server system,
Storing the key pair in the Data Server's key store on the server system
Storing the public key for another Data Analyzer to use
When you complete these steps, the Data Server can accept connections from any Data Analyzer on the server system or on other systems.
2.4.3.1. Creating the Key Pair for the Data Server
Start the Data Analyzer on the server system according to the instructions in Section 2.2, ''How to start the Data Analyzer''. When the Data Analyzer starts, it displays the Network Connection dialog box as shown in Figure 2.1, ''Network Connection Dialog Box''.
Figure 2.1. Network Connection Dialog Box 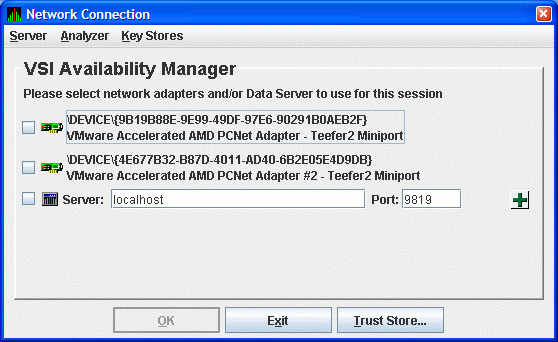
From the menu, select to open the default key store for this system.
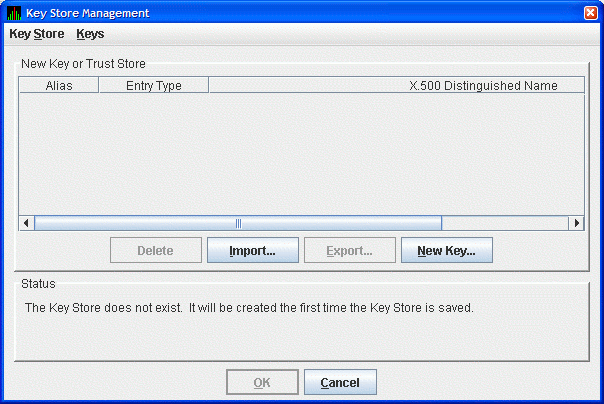
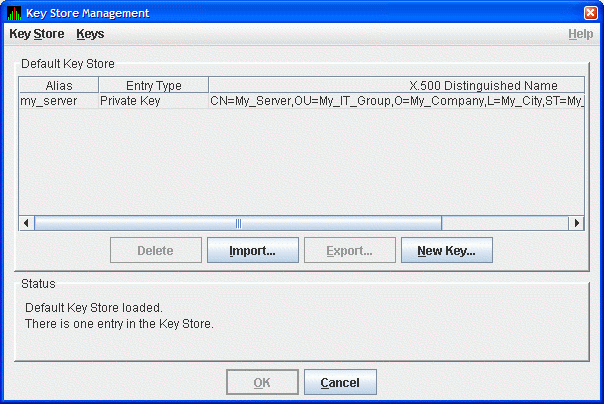
The Availability Manager displays the Key Store Management dialog box as shown in Figure 2.2, ''Key Store Management Dialog Box''.
Figure 2.2. Key Store Management Dialog Box 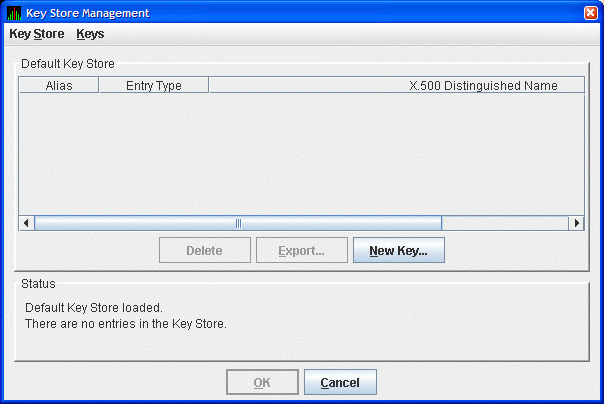
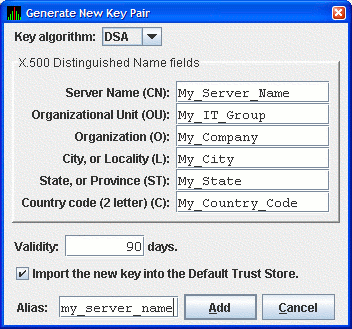
In the Key Store Management dialog box, click to display the Generate New Key Pair dialog box as shown in Figure 2.3, ''Generate New Key Pair Dialog Box''.
Figure 2.3. Generate New Key Pair Dialog Box 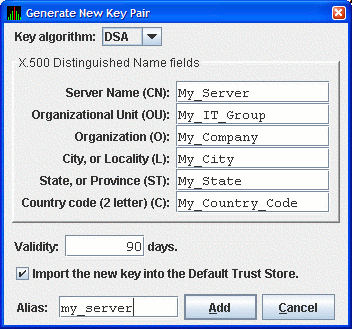
To create a new key pair, fill in the fields in this dialog box.
The information you enter in the Generate New Key Pair dialog box includes fields that pertains to an X.500 Distinguished Name. VSI recommends that you enter the name of the server system in the Server Name field (CN) and in Alias field. ("Alias" is simply a name that is used to track items in the key store and is not part of the generated key.)
Currently, the Availability Manager does not verify whether or not a key has expired. Therefore, the Validity field is not used. However, for the field to work in future versions, VSI recommends that you enter a large value if you are creating a key that must be valid for a long time.
To run the Data Analyzer on the server system and have it connect to the Data Server on the server system, check the Default Trust Store checkbox. This creates a trust store for the Data Analyzer that contains the public key for accessing the Data Server on the server system.
When you finish entering information to create a new key pair for the Data Server, click (it might take a few seconds to create the key). If you checked the Default Trust Store checkbox, the default trust store for this key pair is created for the Data Analyzer running on the server system.
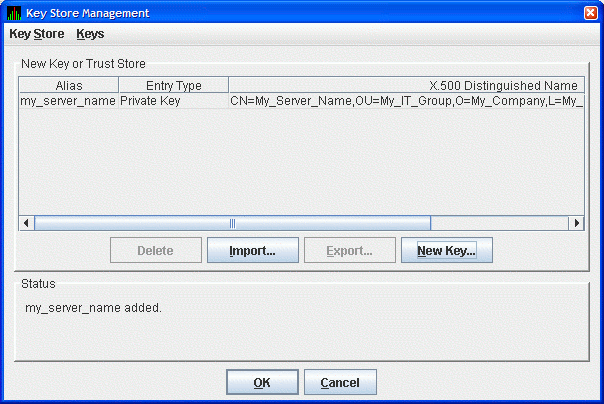
The Key Store Management dialog box shown in Figure 2.4, ''Key Store Management Dialog Box Showing Key Pair'' now displays one key pair, reflecting the information you entered in the Generate New Key Pair dialog box.
Figure 2.4. Key Store Management Dialog Box Showing Key Pair 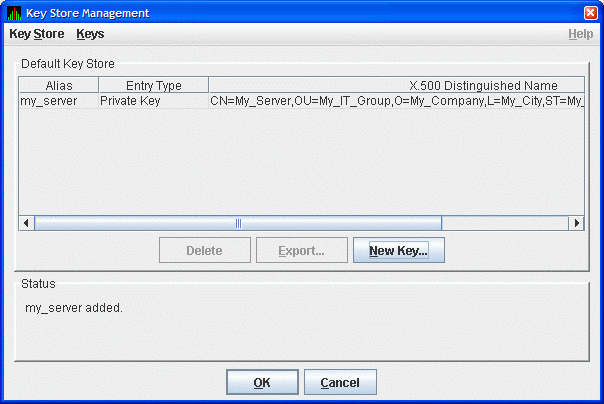 If the only system you want to run the Data Analyzer is the server system, then do the following:
Click in the Key Store Management dialog box to save the key store on the server system.
Follow the instructions in Section 2.6, ''Using the Network Connection Dialog Box to Start Collecting Data'' to start and configure the Data Analyzer.
To run the Data Analyzer on other systems, see Section 2.4.3.2, ''Export the Public Key for Other Data Analyzers''
2.4.3.2. Export the Public Key for Other Data Analyzers
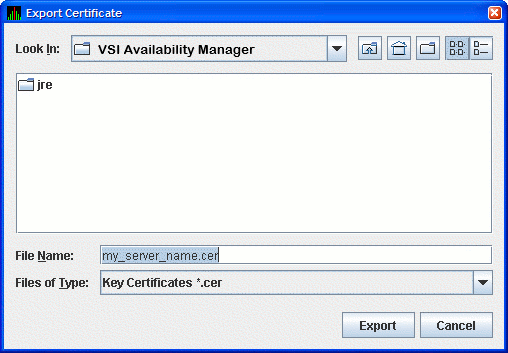
To run the Data Analyzer on other systems, and to connect to the Data Server on this system, you must export the public key for the Data Server as a trusted certificate. To do this, click the key pair name in the Key Store Management dialog box. This action enables the button. Click to export the public key in a trusted certificate. The Availability Manager displays the Export Certificate dialog box as shown in Figure 2.5, ''Export Certificate Dialog Box''.
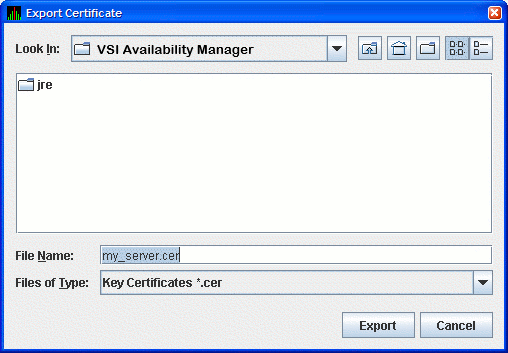
Store the trusted certificate in the folder and file name of your choice. Any file name with a CER extension works, although naming the file the same as the server alias can make it easier to identify. Click to complete this process.
Important
Remember the location of this certificate. This certificate is used in Section 2.4.5, ''Key Setup for a Data Analyzer to Connect to an Existing Data Server''.
2.4.3.3. Save the Key Store
To save the key store on the server system, click in the Key Store Management dialog box. Then see Section 2.4.5, ''Key Setup for a Data Analyzer to Connect to an Existing Data Server'' to import the trusted certificate into the Data Analyzer trust store.
2.4.4. Steps for Setting Up Secure Communications from the Analyzer System
The process for setting up the Data Server from an analyzer system involves the following tasks:
Creating the key store for the Data Server on the server system.
Exporting the public key as a trusted certificate for other analyzer systems.
Saving the key store.
Copying the key store to the server system.
Delete the key and trust store from the analyzer system.
Exporting the public key to the server system from an existing server system using an analyzer system.
2.4.4.1. Creating the Key Store for the Data Server
Start the Data Analyzer on the analyzer system. When the Data Analyzer starts, it displays the Network Connection dialog box as shown in Figure 2.6, ''Network Connection Dialog Box''.
From the menu, click . The Availability Manager displays the Key Store Management dialog box, shown in Figure 2.7, ''Key Store Management Dialog Box''.
In the Key Store Management dialog box, click to display the Generate New Key Pair dialog box as shown in Figure 2.8, ''Generate New Key Pair Dialog Box''. To create a new key pair, fill in the fields in this dialog box. For a description of these fields, see Section 2.4.3.1, ''Creating the Key Pair for the Data Server''.
When you finish entering information in the Generate New Key Pair dialog box, click (it might take a few seconds to create the key). If you checked the Default Trust Store checkbox, the default Trust Store for this key pair is created for the Data Analyzer running on the this analyzer system.
The Key Store Management dialog box (Figure 2.9, ''Key Store Management Dialog Box with One Entry'') now displays the new key pair, reflecting the information you entered.
This step finishes the setup needed for this analyzer system. If this is the only Data Analyzer that needs to connect to this Data Server, go to Section 2.4.4.4, ''Copying the Key Store to the Server System''.
2.4.4.2. Exporting the Public Key for Analyzer Systems
For other Data Analyzers that need to connect to the Data Server, export the public key as described in this section.
In the Key Store Management dialog box, select the Data Server key pair by clicking the key entry. This enables the button in the dialog box. Click to extract the Data Server's public key and store it in a file as a trusted certificate.
The Export Certificate dialog box is displayed as shown in Figure 2.10, ''Export Certificate Dialog Box''.
Store the trusted certificate in the folder and file name of your choice. Any file name with the CER extension works, although accepting the default can make the file easier to identify. Click the button to complete this process.
Important
Remember the location of this certificate. This certificate is used in Section 2.4.5, ''Key Setup for a Data Analyzer to Connect to an Existing Data Server''.
2.4.4.3. Saving the Key Store for the Server System
Now that you have created the key pair for the Data Server, you must save the pair in a key store. In the Key Store Management dialog box, select the menu, and then select . This displays the Save Key Store dialog box as shown in Figure 2.11, ''Save Key Store Dialog Box''.
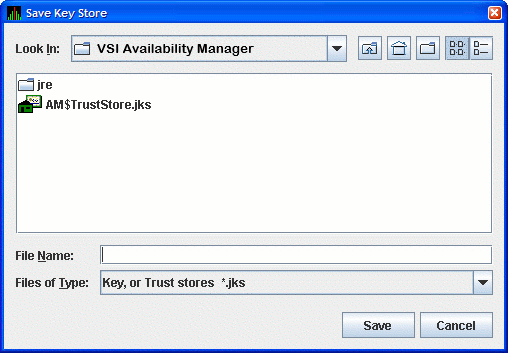
Note
If you checked the Default Trust Store checkbox in Figure 2.8, ''Generate New Key Pair Dialog Box'', the file AM$TrustStore.jks appears.
Save the key store in the folder and file name of your choice. Any file name with a JKS extension works, although naming the file the same as the server alias can make the file easier to identify. Enter this file name in the File Name field, and click to save the key store. In the Key Store Management dialog box, click to dismiss the dialog box.
2.4.4.4. Copying the Key Store to the Server System
The key store is now ready for the server system. Copy the file to the server system. If you use FTP to transfer the file, be sure to use the binary transfer mode.
Once the file is copied, move it to the location and file name that the Data Server looks for when it starts. On OpenVMS, the location is in the AMDS$AM_MANAGER: directory. On Windows, the location is the installation directory. Make sure that the file is named AM$KeyStore.jks for Windows systems. On OpenVMS, if the AMDS$AM_MANAGER: directory is on an ODS-2 disk volume, make sure that the file is named AM$KEYSTORE.JKS.
2.4.4.5. Delete the Key and Trust Store from the Analyzer System
Once you have created the key store and copied it to the server system, it is recommended that you delete the key and trust store on the analyzer system. This sets up the analyzer system to create a key store for another Data Server, or to create the trust store by importing the trusted certificates from each Data Server into the Data Analyzer.
This concludes the Data Server setup on the server system. If you want to create a key store for another Data Server, go to Section 2.4.4, ''Steps for Setting Up Secure Communications from the Analyzer System''. Otherwise, go to Section 2.4.5, ''Key Setup for a Data Analyzer to Connect to an Existing Data Server'', which describes how to import the Data Server's public key into the trust store of other Data Analyzers.
The next section describes how to obtain the public key from an existing Data Server. This step allows the Data Analyzer to connect to the Data Server.
2.4.4.6. Obtaining the Public Key from an Existing Data Server
This section describes how to obtain a Data Server's public key from the analyzer system.
2.4.4.6.1. Copy the Key Store from the Server System
Note
Both OpenVMS and Windows file systems are case-insensitive, so the Availability Manager accepts the key store filename in all caps or in mixed case as shown in this section or in lower case.
2.4.4.6.2. Export the Key Store Public Key to a Trusted Certificate
This step extracts the Data Server public key from the key store by exporting it to a trusted certificate.
Start the Data Analyzer on the analyzer system. When the Availability Manager starts, it displays the Network Connection dialog box as shown in Figure 2.12, ''Network Connection Dialog Box''.
From the menu, select or to open the Open Key or Trust Store dialog box as shown in Figure 2.13, ''Open Key or Trust Store Dialog Box''.
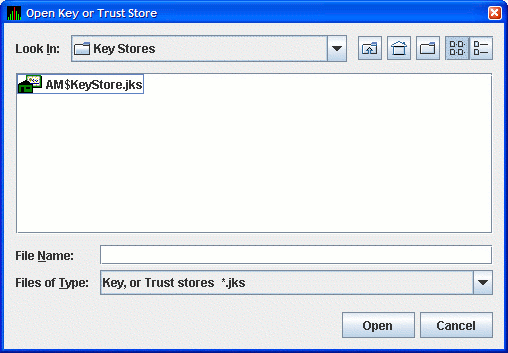
In this dialog box, locate the key store file by selecting the name of the key store file, and clicking . The opened key store is displayed in the Key Store Management dialog box as shown in Figure 2.14, ''Key Store Management Dialog Box''.
Select the key pair entry in the dialog box. This enables the button. Click to export the public key of the key pair into a trusted certificate. The Availability Manager displays the Export Certificate dialog box as shown in Figure 2.15, ''Export Certificate Dialog Box''.
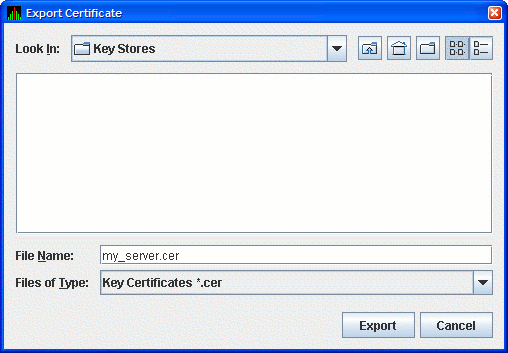
Store the trusted certificate in the folder and file name of your choice. Any file with the CER extension works, although accepting the default can make the file easier to identify. Click to complete this process. You now have the trusted certificate.
Important
Remember the location of this certificate. This certificate is used in Section 2.4.5, ''Key Setup for a Data Analyzer to Connect to an Existing Data Server''.
2.4.5. Key Setup for a Data Analyzer to Connect to an Existing Data Server
This section describes how to set up a trust store for a Data Analyzer to connect to an existing Data Server. The steps involve the following tasks:
Obtaining the Data Server's public key from its key store as a trusted certificate.
Copying the trusted certificate to the analyzer system.
Importing the trusted certificate into the Data Analyzer's trust store.
2.4.5.1. Obtaining the Data Server Public Key
First enter the Data Server's public key into the trust store of the Data Analyzer. This transfer involves exporting the key into a trusted certificate from the key store, and importing the key into the Data Analyzer's trust store.
The following sections describe how to export the public key into a trusted certificate. If you need to export the public key, determine which of the following applies to you.
Export the Public Key for Other Data Analyzers (see Section 2.4.3.2, ''Export the Public Key for Other Data Analyzers'')
Export the Public Key for Analyzer Systems (see Section 2.4.4.2, ''Exporting the Public Key for Analyzer Systems'')
Export the Key Store Public Key to a Trusted Certificate (Section 2.4.4.6.2, ''Export the Key Store Public Key to a Trusted Certificate'')
Make sure you have the Data Server's public key in a trusted certificate for the next step.
2.4.5.2. Copying the Trusted Certificate
Copy the trusted certificate from the server system to the analyzer system. Note that the trusted certificate contains binary data, so you must use binary mode if FTP is the file transport. The certificate is now ready for importing to the Data Analyzer’s trust store.
2.4.5.3. Importing the Data Server Public Key
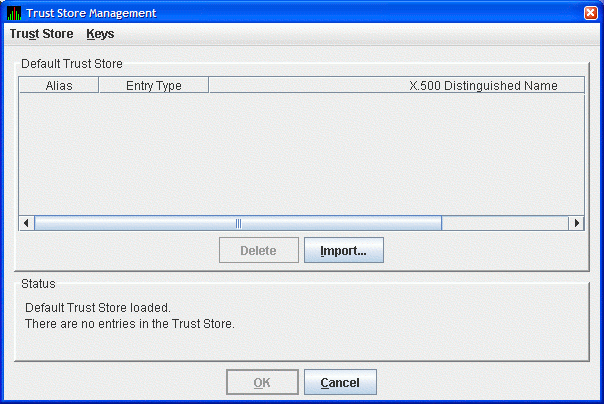
Start the Data Analyzer on the analyzer system. From the menu, select to open the default trust store for this system. The Availability Manager displays the Trust Store Management dialog box as shown in Figure 2.16, ''Trust Store Management Dialog Box''.
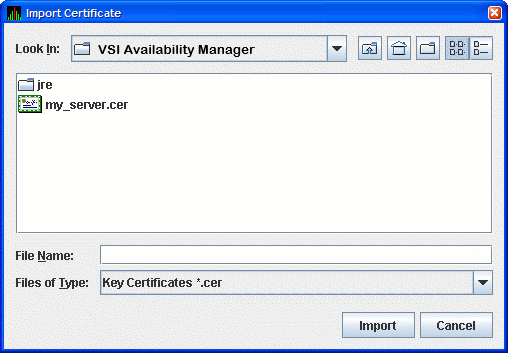
Click to import the trusted certificate. The Availability Manager displays the Import Certificate dialog box as shown in Figure 2.17, ''Import Certificate Dialog Box''.
Select the name of the trusted certificate, and click . The Availability Manager displays the Assign Alias for Certificate dialog box as shown in Figure 2.18, ''Assign Alias for Certificate Dialog Box''.
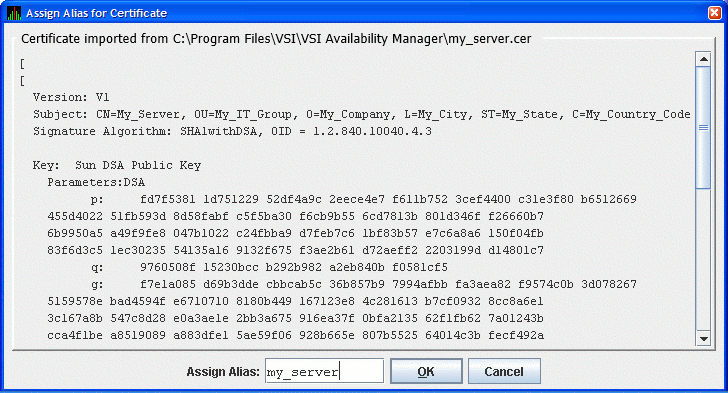 |
This dialog box displays the trusted certificate. Enter the alias name for the certificate in the Assign Alias field. Although you can put any text in this field, it is best to choose the same alias name that the Data Server uses. Then click to continue. The Availability Manager displays the Trust Store Management dialog box with the imported key as shown in Figure 2.19, ''Trust Store Management Dialog Box''.
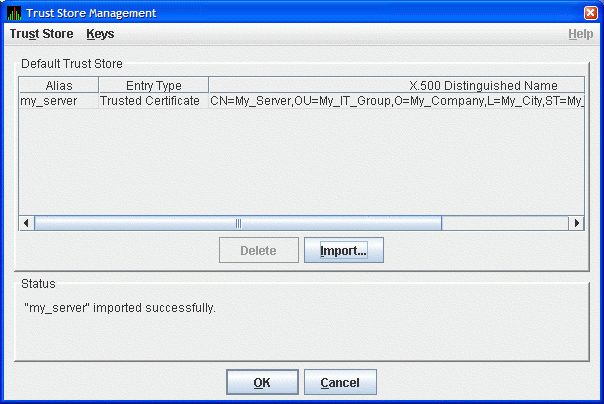
In the Trust Store Management dialog box, click to save the trusted certificate in the Data Analyzer trust store.
This sets up the Data Analyzer to connect to a Data Server. The Data Analyzer supports connections to multiple Data Servers. To connect to multiple Data Servers, export the public key for each Data Server and import it into the Data Analyzer.
This completes the Data Analyzer key configuration. You are now ready to run the Data Analyzer and connect to the Data Server.
2.5. Starting the Data Server
This section describes tasks you must perform after the Availability Manager Data Server is installed. Starting the Data Server is somewhat different on OpenVMS than on Windows systems. However, on both systems, the Data Server listens for connections from Data Analyzers once it is started.
The Data Server is designed to run in a minimal environment. It only outputs text messages to log various events and Data Analyzer connections. Because of this design, it can be run in a batch job or in a detached process on OpenVMS, or as a startup task on Windows.
The following sections contain the sequence of steps required to start the Data Server on an OpenVMS node and a Windows node.
The first step is to decide which platform is to run the Data Server: Windows or OpenVMS.
2.5.1. Starting the Data Server on an OpenVMS System
To start a Data Server on an OpenVMS System (Alpha, IA64, and x86-64), make sure the following conditions are met:
The Data Server is installed on a node that is on the same LAN as your OpenVMS systems.
The Data Collector is started (see Section 2.1.3, ''Starting the Data Collector'').
Starting the Data Collector is important for these reasons:
Defines the various AMDS$* logicals needed by the Data Server.
Allows the Data Server to communicate to the Data Collector on the network.
After you install and configure the Data Collector and Data Server and start the Data Collector, enter the following command to start the Data Server:
$ AVAIL/SERVER
Note
For a list of qualifiers you can use with the AVAIL/SERVER command, see the VSI Availability Manager Installation Instructions, or enter HELP AVAIL and then the qualifier name at the DCL dollar prompt.
2.5.2. Configuring and Starting the Data Server on Windows
After you have installed and configured the Availability Manager as described in the VSI Availability Manager Installation Instructions, follow the procedure described in this section to configure network adapters and start the Data Server.
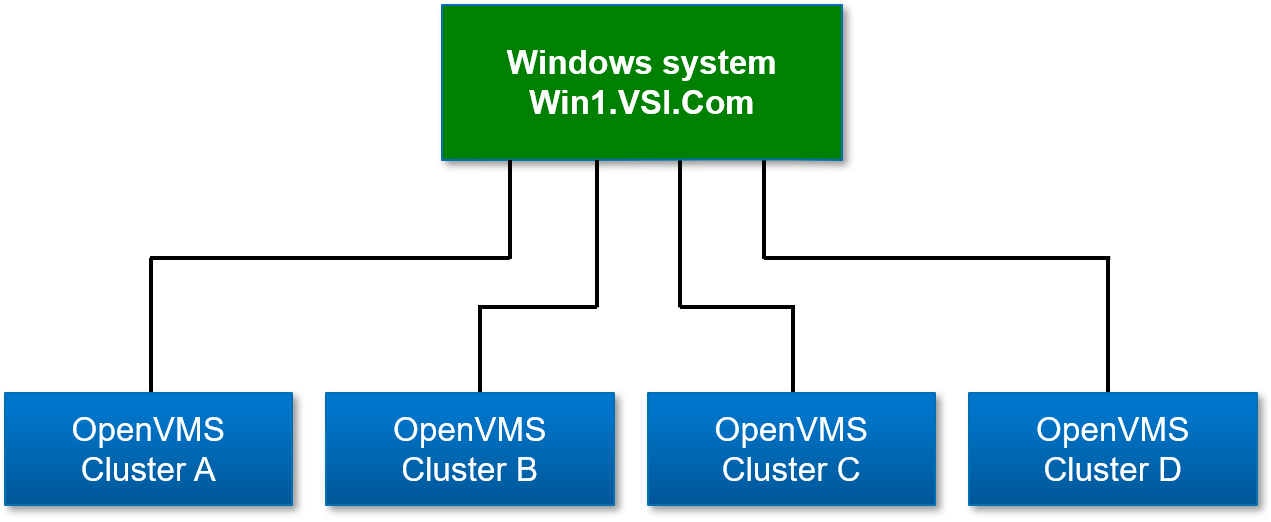
We will be using a Microsoft Windows system with four network adapters as an example configuration. Each adapter is connected to the local LAN of a cluster of OpenVMS systems (see Figure 2.20, ''The Data Server Configuration Example on Windows'').
 |
2.5.2.1. Data Server Configuration Utility
The Data Server Configuration utility assigns a TCP/IP port number to a network adapter. For this example, network adapter #1 is connected to OpenVMS cluster A, #2 to OpenVMS cluster B, #3 to OpenVMS cluster C, and #4 to OpenVMS cluster D. The port numbers assigned to the network adapters are 9810 through 9813 respectively.
To open the Data Server Configuration utility, from the Windows menu, right-click the entry and select from the drop-down menu to start the utility along with the Availability Manager protocol driver, which scans the system for available network adapters.
The Data Server Configuration utility utilizes a Windows Command Prompt to display the network adapters and assigned port numbers. Figure 2.21, ''The Default Configuration of Network Adapters and Ports'' shows the default configuration from the first time that the Data Server Configuration utility is run on the system.
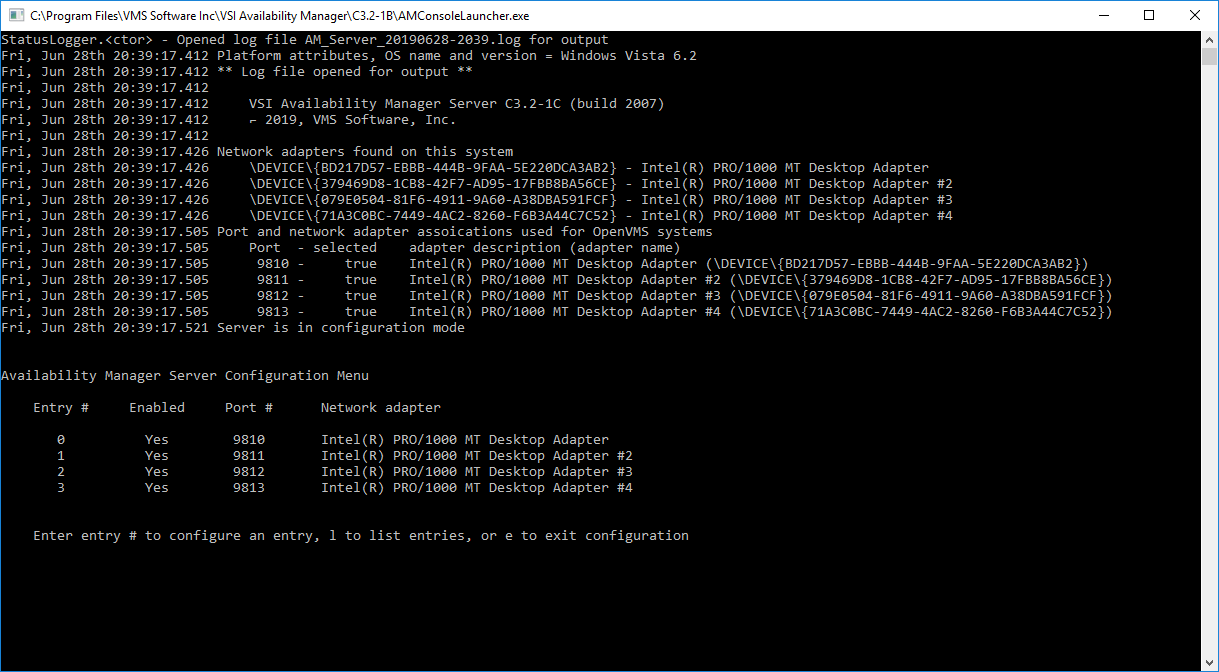 |
Network adapter #1 is listed as "Intel(R) PRO/1000 MT Desktop Adapter".
The first time the Data Server Configuration utility is run, it configures the network adapters as selected and assigns port numbers to each one starting with the first available port of 9810.
This is the desired configuration for the setup in Figure 2.20, ''The Data Server Configuration Example on Windows''. Entering "e" to exit saves this configuration and closes the utility.
Figures 2.22 and 2.23 show how to disable a network adapter so it is not used by the Data Server, and how to change the port number for an adapter. Note that disabling a network adapter stops the Data Server from using the adapter to communicate with OpenVMS systems on its local LAN. The adapter is still available for Windows and other programs.
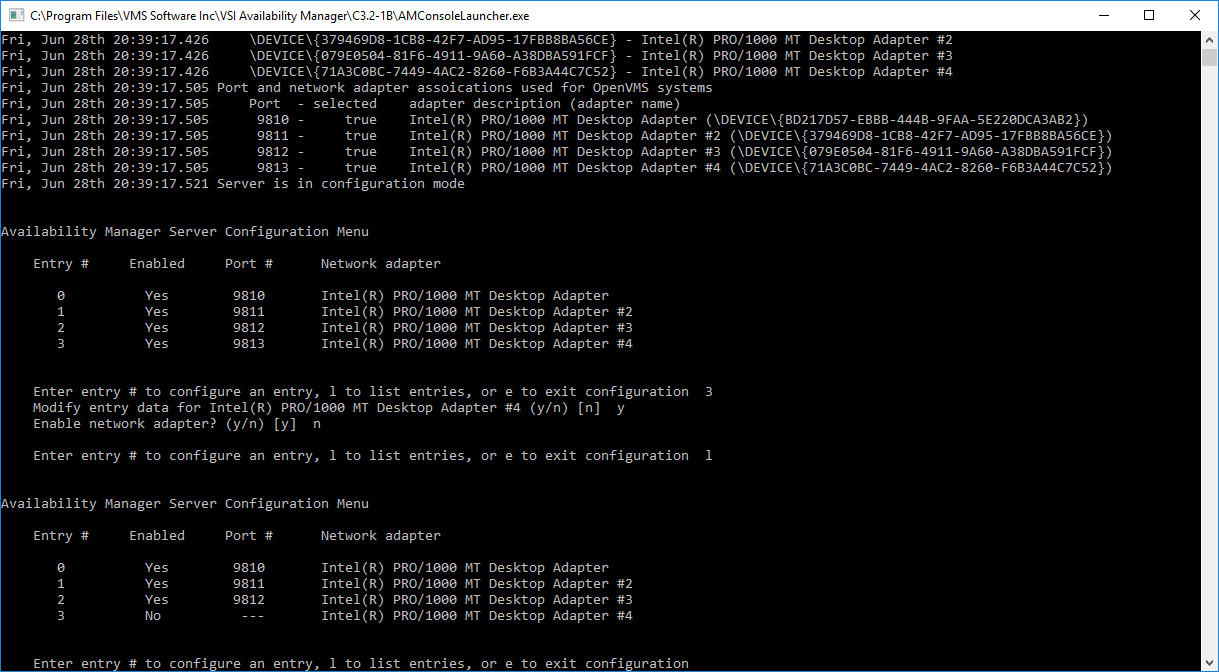 |
Figure 2.22, ''Disabling a Network Adapter'' shows how to disable a network adapter. Adapter #3 is selected, and disabled. Then, the list of adapters and their current setup is displayed.
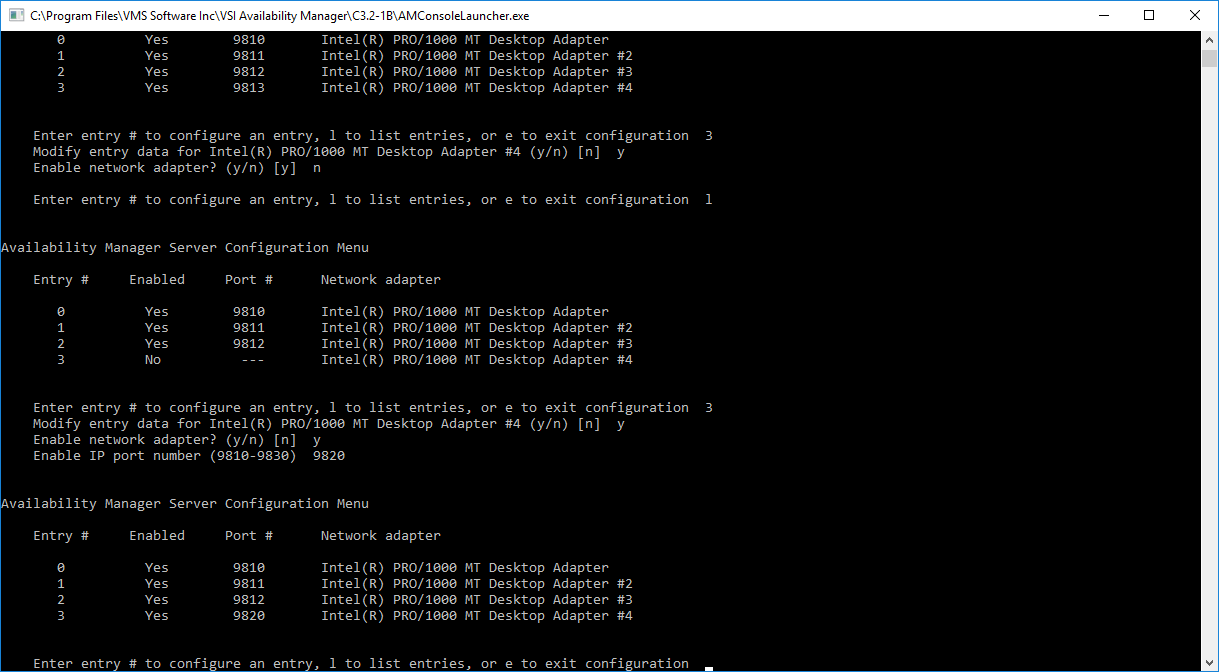 |
Figure 2.23, ''Enabling a Network Adapter'' displays the steps to enable a network adapter. Adapter #3 is selected, and enabled. The list of adapters is displayed after this change. Note the range of port numbers to use in the "Enable IP port number" prompt. These port numbers are used by the Data Server when it is started.
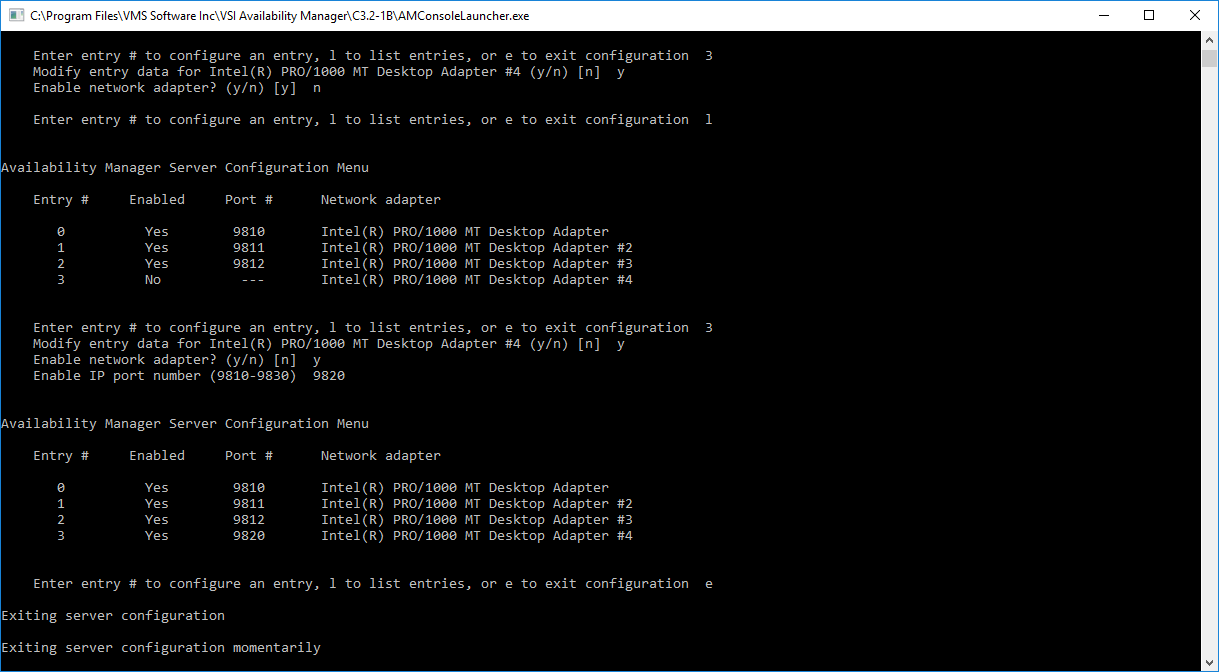 |
Figure 2.24, ''Exiting the Data Server Configuration Utility'' displays the text when the utility is directed to exit. This screen is displayed for a short time while the utility saves the configuration, and then Windows Command Prompt closes.
2.5.2.2. Configuring Windows Firewall
After assigning port numbers to network adapters in the Data Server Configuration utility, the ports need to be opened for incoming traffic in the Microsoft Windows Firewall.
Follow these steps to configure the Microsoft Windows Firewall:
Open the Microsoft Windows Firewall.
Go to . In the left-hand menu, click , then click in the right-hand menu to display the New Inbound Rule Wizard.
In the New Inbound Rule Wizard window, select and click .
Choose and specify the local ports that you have configured in Section 2.5.2.1, ''Data Server Configuration Utility''. Click .
In the next window, select , then click .
Select the checkboxes for the network profiles that apply to your site (Domain, Private, or Public), then click .
Give the rule a name and an optional description. When you are done, click .
The Windows Firewall application closes the New Rule Wizard window and returns to the main window. The highlighted line in the main window is the rule you have added.
To start the Data Server, follow these steps:
Click the Windows button and type "Data" in the search box to display the components of the Availability Manager.
Click Data Server Startup. The Availability Manager starts the Data Server.
2.6. Using the Network Connection Dialog Box to Start Collecting Data
The following section describes the steps needed to get the Data Analyzer to connect to one or more network adapters, or connect to one or more Data Servers. The Data Analyzer supports any combination of available network adapters and Data Servers.
These steps assume that the Data Servers are already running on the server systems.
Start the Data Analyzer on the analyzer system as described in Section 2.2, ''How to start the Data Analyzer''. The Availability Manager displays the Network Connection dialog box, shown in Figure 2.25, ''Network Connection Dialog Box''.
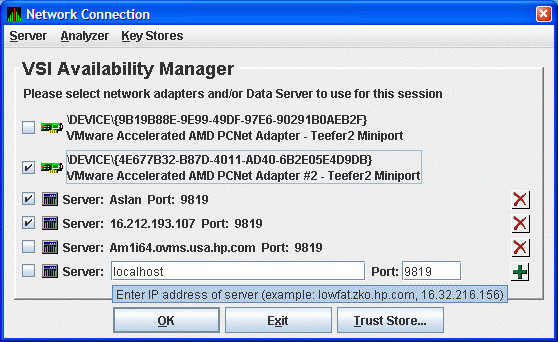
Figure 2.25, ''Network Connection Dialog Box'' shows two entries for the two network adapters on this particular system. The last entry is where you enter the IP address and port number of a Data Server. To use one or more of these network adapters, check the checkbox to the left of each network adapter, and click . The Data Analyzer starts, using the network adapters you have chosen. To start using the Data Analyzer, see the instructions in Section 2.8, ''Using the System Overview Window''.
To connect to one or more Data Servers, enter the IP address of each server, along with the IP port that the Data Server uses for communication. There are a number of possible forms for the IP address:
Alphanumeric IP address - Alpha1.denver.newscorp.com
Numeric IP address - 136.132.15.32
WINS entry for a Windows system - WXPSRV1
Analyzer system name synonym - Localhost
The default IP address shown in the dialog box is "localhost". Localhost is a synonym for the IP address of the Analyzer system itself. Use the "localhost" default or enter the IP address of the Data Server, the IP port the Data Server is using in the Port: field, and click the plus sign button to register the entry. The data for the new Data Server entry is displayed in the dialog box. You can repeat this process to enter all the Data Servers you want to use.
Note
You can use the "localhost" name to allow more than one Data Analyzer instance to access data from a particular network adapter on the system. See Figure 1.4, ''Availability Manager Node Configuration for a WAN'' for a figure that is similar to the following example that illustrates how this is done.
For example, Data Server node ACCPNT is connected to Data Collector nodes Edmund and Lucy through network adapter A on ACCPNT. If you start the Data Analyzer on ACCPNT and have it use adapter A to gather data, this instance of the Data Analyzer is the only instance that can use adapter A to access Edmund and Lucy. If you want more than one Data Analyzer to access Edmund and Lucy through node ACCPNT, then use the Data Server instead. Start the Data Server on ACCPNT and have it use adapter A. Then you can start the Data Analyzer on ACCPNT, use the "localhost" name to access the Data Server running on ACCPNT, and gather data from Edmund and Lucy. Another person using the Data Analyzer on a Data Analyzer node can also gather data from Edmund and Lucy from ACCPNT by connecting to the Data Server on ACCPNT.
Using the Data Server in this manner allows you to run the Data Analyzer on a Data Server node without restricting access to its network adapters.
Figure 2.26, ''Network Connection Dialog Box with One Data Server Entry'' shows an example of this procedure. The IP address entered is Aslan, the WINS entry for the Data Server system, and the port number entered is 9819.
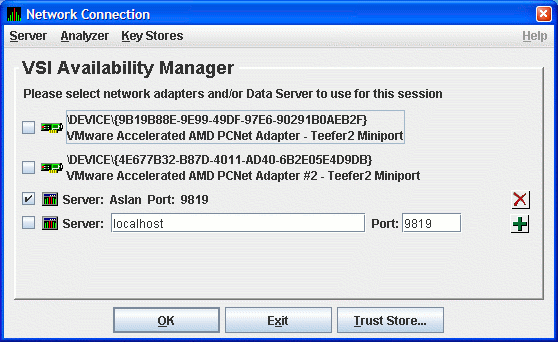
Figure 2.27, ''Network Connection Dialog Box with Two Data Server Entries'' shows the result of adding a second Data Server using the numeric form of the IP address.
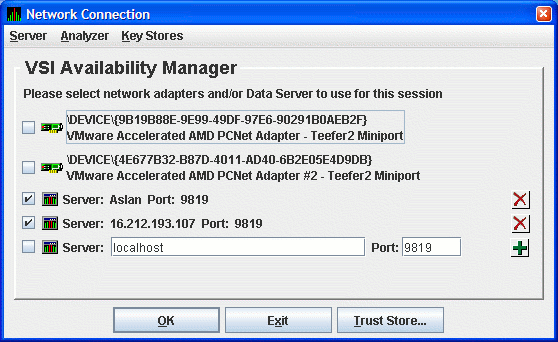
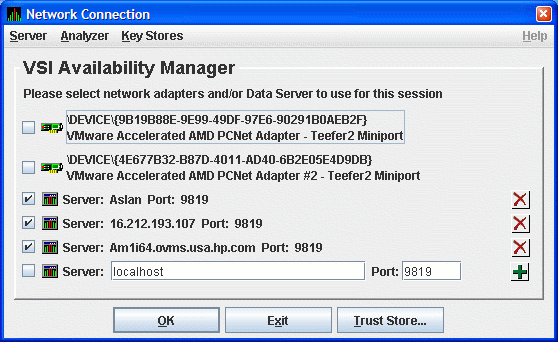
Figure 2.28, ''Network Connection Dialog Box with Three Data Server Entries'' shows the result of adding a third Data Server using the alphanumeric form of the IP address.
To remove a Data Server entry from the Network Connection dialog box, click the delete button (X) to the right side of the Data Server entry.
To start collecting data, check the network adapter and Data Server entries you want to use, and click . This process is described in Section 2.7, ''Choosing Network Connections for Collecting Data''.
2.6.1. Additional Information About Key Stores
This section contains some additional information about handling keys, key stores and trust stores.
2.6.1.1. Clarification of Network Connection dialog box Menus
Note the following:
The menu item on the and the menu open the default Data Server key store (AM$KeyStore.jks). This default key store name is what the Data Server uses when it starts. You can save key stores with other file names, but when you copy the key store to the server system for the Data Server to use, you must rename it to the default key store name.
The menu item on the and menus and the button open the default Data Analyzer trust store (AM$TrustStore.jks). This default trust store name is what the Data Analyzer uses when it starts. You can save trust stores with other file names, but when you copy the trust store to the analyzer system for the Data Analyzer to use, you must rename it to the default trust store name.
The other menu items on the menu open generic key or trust stores that you are prompted to name when you open or save any of them.
2.6.1.2. Export and Import Made Easy
The Availability Manager allows you to open multiple key and trust stores using the menus on the Network Connection dialog box. The Key Store and Trust Store Management dialog boxes allow you to drag and drop items interchangeably between dialog boxes (and to the file system or desktop on Windows). This operation can make import and export easier if you open the key and trust stores locally or if you use network shares to open them.
2.6.1.3. Certificates
The certificate that you create is a ‘‘self-signed’’ one. This means that the person who creates the certificate also signs off on its legitimacy. This type of certificate is also called a root certificate.
2.7. Choosing Network Connections for Collecting Data
When you start the Data Analyzer, it displays the Network Connection dialog box. This dialog box shows the available network adapters on the system, and any Data Servers that have been entered. You can choose which networks adapters and Data Servers the Data Analyzer uses for collecting data by check the checkbox of each entry.
Figure 2.29, ''Sample Network Connection Dialog Box with Three Checked Entries'' shows a Network Connection dialog box with the two available network adapters on the system, and three Data Servers. Three of the entries are checked. Section 2.8, ''Using the System Overview Window'' uses this example to document how to use the Data Analyzer.
2.8. Using the System Overview Window
After you click on the Startup Dialog box, the Data Analyzer displays the System Overview window.
Note
If you do not see a System Overview Window similar to the one shown in Figure 2.30, ''System Overview Window'' after you start the Availability Manager, the setup or configuration of your Data Analyzer and Data Collector nodes might be incorrect or incomplete. Refer to VSI Availability Manager Installation Instructions for installation instructions.
After receiving a multicast "Hello" message from the Data Collector, the Data Analyzer attempts to connect to a node. This is called the attempting collection state.
The Data Analyzer notifies you of this and other states in the System Overview window, which is shown in Figure 2.30, ''System Overview Window''.
- The Data Collector performs a security check on the Data Analyzer connection attempt.
If the Data Analyzer passes the security check while the Availability Manager is attempting the connection, the connection succeeds, and data collection starts. This is called the data collection state.
If the Data Analyzer fails the security check, the node is in the connection failed state.
While the Data Analyzer collects data, if a node goes down, or a network connection fails between the graphical user interface and the node, that node is placed in the path lost state.
The colors of the icons preceding each node name in Figure 2.30, ''System Overview Window'' indicate the state of the node.
 |
|
Color |
Description |
|---|---|
|
Brown |
Attempts to configure nodes have failed – for example, because the nodes are in a connection failed state. A tooltip, which is described in Section 2.8.2.1, ''Displaying Summary Node Information'', explains the reason for the failure. |
|
Yellow |
Nodes are in the attempting collection state; that is, the security check of the nodes is in progress. Nodes that remain in this state more than several seconds indicate network connectivity problems with the Data Analyzer. |
|
Black |
Nodes are in a path lost state; that is, the network path to the node has been lost or the node is not running. |
|
Red |
Nodes are in the data collection state – that is, they are collecting data – but the nodes have exceeded a threshold, causing events to be posted. Note that if an event causes the output of any message besides an informational one, a node is displayed in red. |
|
Green |
Nodes are in the data collection state; that is, the security check was successful, and the nodes are collecting data. |
The System Overview window is divided into two segments, or panes: the Group/Node pane and the Event pane.
2.8.1. Using the Group/Node Pane
|
Heading |
Description |
|---|---|
|
BIO |
The number of packets that have been read using this connection, including hello packets for nodes that are not being monitored. The shaded portion – yellow in the application – represents the number of packets read in the last monitoring interval. A full bar represents 10 or more packets per second. |
|
DIO |
The number of packets currently waiting on the server to be sent to this client. A number consistently greater than 0 indicates congestion or a failing connection. The shaded portion – yellow in the application – also reflects this number. A full bar represents 10 or more packets in the queue. |
|
CPUQs |
The number of packets that have been written using this connection. The shaded portion – yellow in the application – represents the number of packets written in the last monitoring interval. A full bar represents 10 or more packets per second. |
|
EVENTS |
The first number is the number of packets currently waiting to be written to this connection. A number consistently greater than 0 indicates congestion. For a WAN connection, this might indicate a slow or failing connection. The lighter shaded portion – yellow in the application – also reflects this number. A full bar represents 10 or more packets in the queue. The second number is a count of the number of packets that have been discarded because the write queue grew too large. The darker shaded portion – red in the application – indicates the number of packets that were discarded in the last monitoring interval. A full bar represents 10 or more packets discarded. |
If the number of packets waiting or discarded is consistently large, you might notice that the data displayed in the application updates at a slower rate. In extreme cases, nodes might turn black, indicating a lost connection with the node when, in reality, the problem is the congestion between the Data Analyzer and the Data Server.
If you have a problem with congestion, consider scaling back the number of nodes or the amount of data being collected, or lengthening collection intervals.
The rest of the Group/Node pane displays information about the OpenVMS groups and nodes that the Data Analyzer has found. By default, within each group, the Data Analyzer displays the nodes with which it can establish a connection. (If the Data Analyzer finds Windows nodes, those are also displayed.)
2.8.1.1. Setting Up Groups
Groups are set up during the Data Collector kit installation and configuration on Data Collector nodes and are user-definable. Be sure to define groups by cluster membership. If a node is not a member of a cluster, then you can define a group by function, type of hardware, or geographical location.
Note
VSI recommends that you define a cluster as its own group. This is necessary for the Lock Contention, Disk Summary, Disk Volume, and Cluster data collections to function correctly.
2.8.1.2. Displaying Group Information
Groups – and the nodes in each group with which the Data Analyzer is able to establish a connection – are displayed in the Group/Node pane of the System Overview window (see Figure 2.30, ''System Overview Window'').
To display only groups in the Group/Node pane, click the handle in front of a group name to a horizontal position, and the nodes in that group are removed, as shown for both groups in Figure 2.31, ''Group Overview Pane''. (Clicking the handle into a vertical position displays nodes again.)
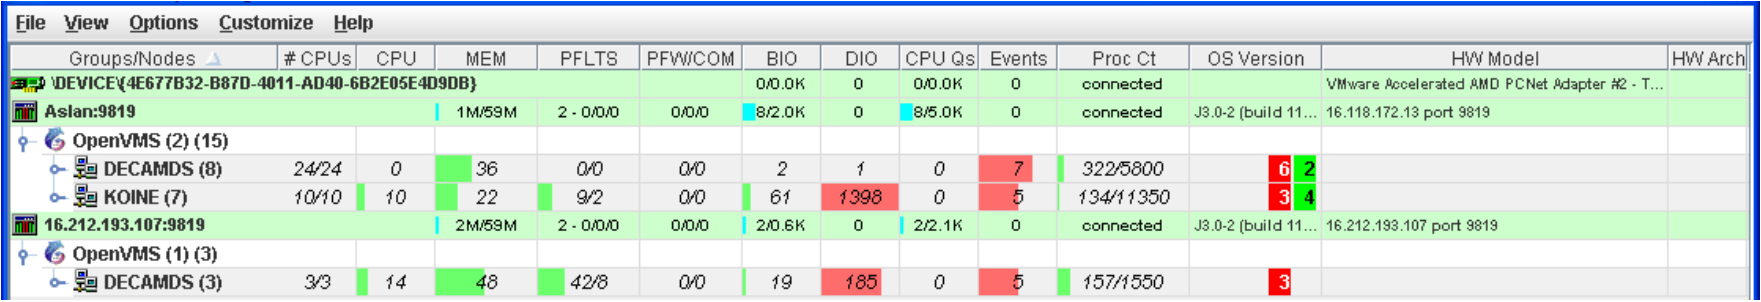 |
The first number in parentheses is the total number of groups that are listed.
The second number in parentheses is the total number of nodes in all the listed groups with which the Data Analyzer can establish a connection.
On each group name row, following the name of the group, the number in parentheses is the number of nodes in that group with which the Data Analyzer has established a connection.
On a group name row under the OS Version heading are color-coded numbers indicating the number of nodes in that group that are one of five color-coded states. These states are explained in Table 2.2, ''Explanation of Color Codes in the System Overview Window''.
Additional summary information about the entire group is on the group line. CPU, MEM, BIO, and DIO numbers are averages. The rest of the number are totals for all of the nodes in the group.
Notice the small triangle in the BIO heading in Figure 2.31, ''Group Overview Pane''. The direction of the triangle indicates that the nodes are sorted in descending order of BIO rates. Click the triangle to reserve the sort order, or click another column header to select a new item on which to sort data.
In the Group/Node pane, only nodes within a group are sorted. The groups remain in alphabetical order. You can sort groups in the Group Overview window by changing the sort order of one of the data column headings (see Figure 2.31, ''Group Overview Pane'').
2.8.2. Displaying Node Information
The Group/Node pane of the System Overview window allows you to focus on resource usage activity at a high level and to display more specific data as needed. This section explains the basic use of the Group/Node pane. For more information, see Chapter 3, "Getting Information About Nodes".
2.8.2.1. Displaying Summary Node Information
Even when nodes are not displayed on the System Overview window or the Group/Node pane, you can display important node information by placing the cursor over a group name or icon. By holding the cursor over the DECAMDS group name, for example, the tooltip similar to the one shown in Figure 2.32, ''Tooltip Example: Summary Node Information'' is displayed, containing summary node information.
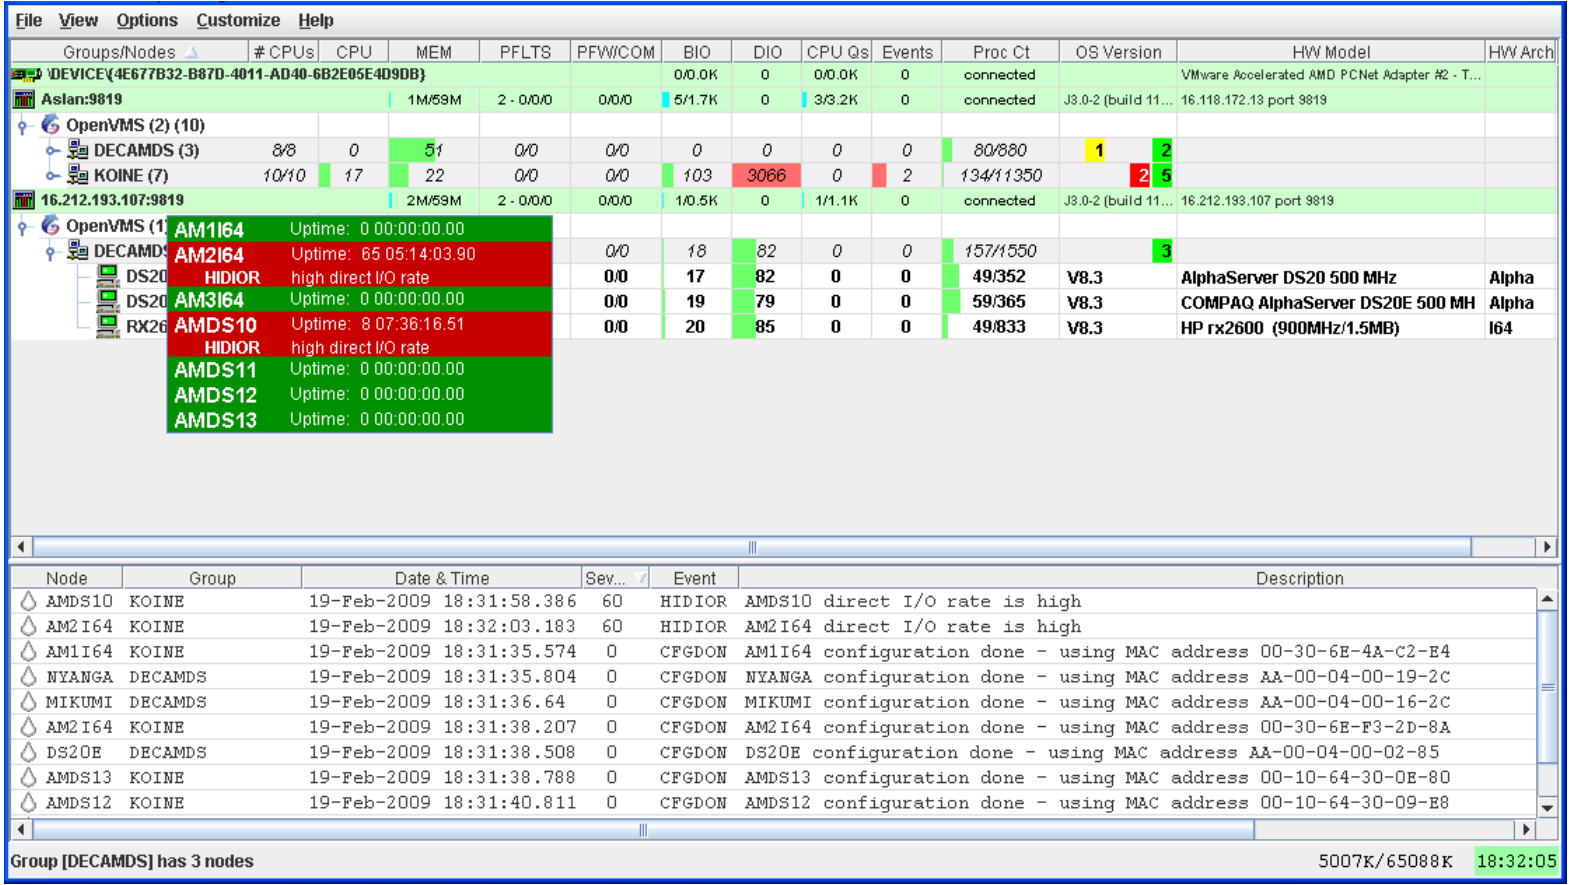 |
|
Color |
Meaning | |
|---|---|---|
|
Brown |
Indicates why the configuration of the node failed. | |
|
Yellow |
Shows number of Data Collector multicast "Hello" messages received and the number of attempts to configure the node ( "Configuration packets sent"). Nodes that remain in this state more than several seconds indicate network connectivity problems with the Data Analyzer. | |
|
Black |
Shows the following: | |
|
For nodes that were in the data collection state (see Table 2.2, ''Explanation of Color Codes in the System Overview Window''), and communication was then lost:
| ||
|
For nodes that were in the connection failed state (see Table 2.2, ''Explanation of Color Codes in the System Overview Window''):
| ||
|
Red |
Nodes have exceeded a threshold, causing events to be posted for the node. If an event causes the output of any message besides an informational one, a node is displayed in red. | |
|
Green |
The security check was successful, and the nodes are collecting data; node uptime is shown. | |
The Group Overview window
The Single-Group window
2.8.2.2. Displaying a Group Overview Window
The first window to help you view large sites is the Group Overview window. To view all the group name row data easily, click the menu at the top of the page and select . The Group Overview window that is displayed (Figure 2.33, ''Group Overview Window'') is similar to the Group Overview pane in Figure 2.31, ''Group Overview Pane''.
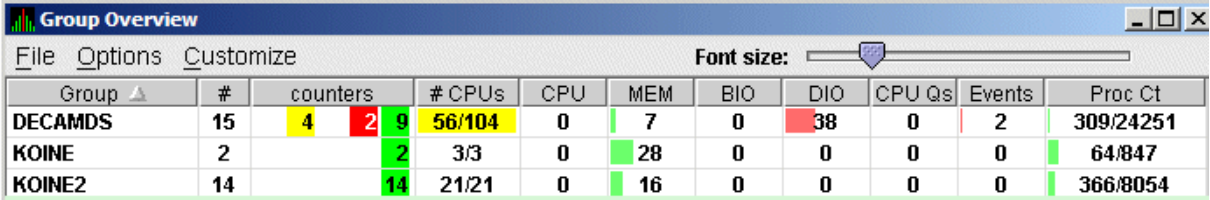
This display is designed to provide an overview of all the groups being monitored. If you want more information about a group, place the cursor over the group name or icon. A tooltip is displayed with additional information about nodes in the group similar to the one displayed in Figure 2.32, ''Tooltip Example: Summary Node Information''.
You can also double-click a group name to display a Single-Group window, as explained in Section 2.8.2.3, ''Displaying a Single-Group Window''.
2.8.2.3. Displaying a Single-Group Window
The second window to help you view large sites is the Single-Group window. This display shows the nodes in one group (see Figure 2.34, ''OpenVMS Single-Group Window'').
To obtain this display, you can also right-click the group name in the Group/Node pane and select the Display option. A separate window appears with only the nodes in the group you have selected (see Figure 2.34, ''OpenVMS Single-Group Window''). This window is useful in simultaneously displaying groups that are not adjacent in the list in the Group/Node pane.
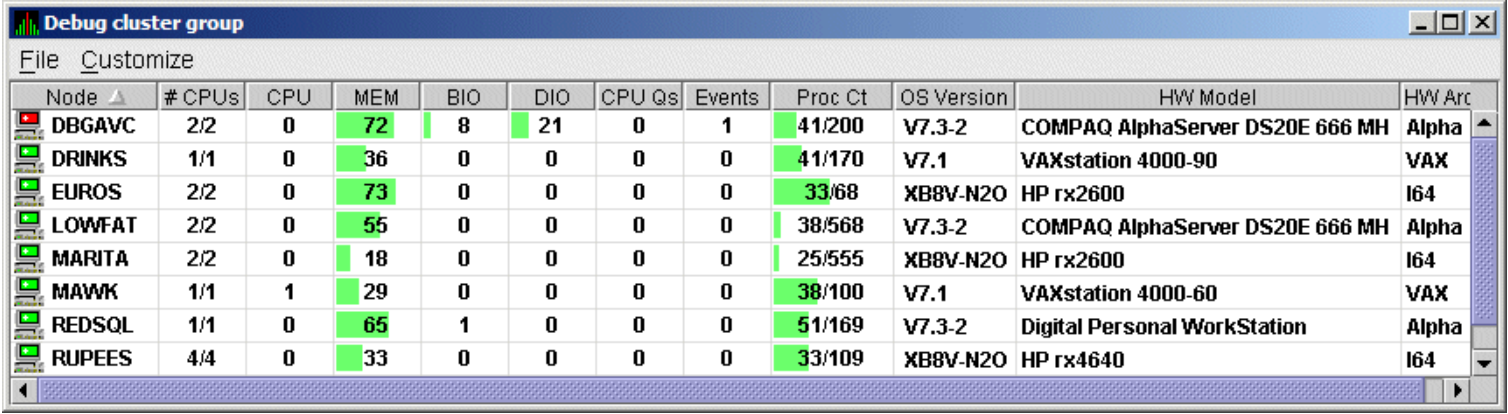 |
Within each group of nodes displayed, the Data Analyzer displays all the nodes with which it can communicate. If some nodes in the group are not displayed, it is because the Data Analyzer has not received a multicast "Hello" message from the Data Collector on that node.
A list of the nodes in the group along with summary data for each node. In Figure 2.30, ''System Overview Window'', the Debug cluster group contains 9 nodes.
A color-coded monitor icon preceding each node name indicates the state of the node. See Table 2.2, ''Explanation of Color Codes in the System Overview Window'' for explanations of states these colors indicate.
For various node data items, some graphs indicate the percentage of an item that is being used; other graphs are totals.
Green graphs indicate percentages below a customized threshold; red graphs indicate percentages above a customized threshold. Some data items are numbers, not percentages; for example, CPUs, CPU queues, and events.
More information about node data is in Chapter 3, "Getting Information About Nodes".
Somewhat different information is displayed for a group of Windows nodes. For more information, see Section 3.1.2, ''Windows Node Pane''.
2.8.2.4. Focusing On a Specific Node
To display more information about an individual node, double-click a node name or in the Single-Group window in the Group/Node pane. You can also right-click a node name and select the Display... option. The Data Analyzer displays the Node Summary page shown in Figure 2.35, ''OpenVMS Node Summary''. (The data on this page is explained in more detail in Chapter 3, "Getting Information About Nodes".)

At the top of the Node Summary page are tabs that correspond to types of node data displayed in the Group/Node pane. If you double-click a field under a column heading in the Group/Node pane, the Data Analyzer displays a page that provides more information about that field. For example, if you click a value under CPU, the Data Analyzer displays a page similar to the one shown in Figure 3.6, ''OpenVMS CPU Mode Summary and Process States''.
2.8.2.5. Specifying Data to Be Collected
By default, the only data collected for a node is the data displayed in the Node pane (Figure 2.34, ''OpenVMS Single-Group Window'') and in the Group/Node pane of the System Overview window (see Figure 2.30, ''System Overview Window''). This data is called a node summary data collection. The events in the Event pane of the System Overview window (see Figure 2.30, ''System Overview Window'') are produced when node summary data is processed. See Appendix D, "OpenVMS Events by Types of Data Collections" for a list of events associated with node summary data.
If you want to signal additional events that are listed in Appendix D, "OpenVMS Events by Types of Data Collections", you must collect the data associated with those events. To collect this data by default, you must enable background data collection for the data. Background and foreground data collections are explained in more detail in Section 1.4.1.2, ''Types of Data Collection''.
For OpenVMS nodes, if you want background data collection (and the associated event detection), you must turn on data collection for each type of data you want to collect. On Windows nodes, background data collection is always enabled and cannot be turned off.
In the System Overview window (Figure 2.30, ''System Overview Window''), click → .
Click the Data Collection tab.
The Data Analyzer then displays the Data Collection Customization page (Figure 2.36, ''Data Collection Customization'').
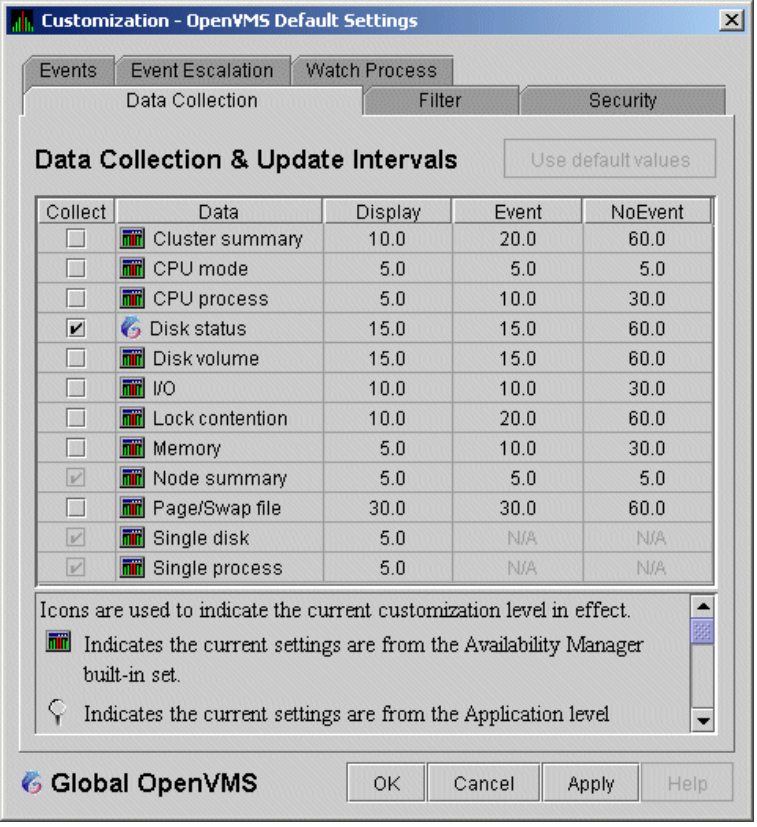
Node summary
Single disk
Single process
To turn on a type of data collection, select the checkbox for that type of data collection in the Collect column. For example, to collect CPU process data, check the checkbox for CPU process in the Collect column.
When you click a data collection name, the Explanation section at the bottom of the page tells where the data for a particular data collection is displayed. Table 7.3, ''Data Collection Choices'' summarizes this information.
You cannot turn off the collection of single disk and single process data. These types of data are collected by default when you open a Single Disk Summary page or a Process Information page, respectively.
On the Data Collection Customization page, you can change the intervals at which data is collected. Collection intervals are explained in Chapter 7, "Customizing the Availability Manager Data Analyzer".
2.8.2.6. Sorting Data
Event pane of the System Overview window (Figure 2.30, ''System Overview Window'')
CPU Process Summary pane (Figure 3.8, ''OpenVMS CPU Process Summary Pane'')
Memory page (Figure 3.10, ''OpenVMS Memory Summary'')
Bottom pane of I/O Summary page (Figure 3.12, ''OpenVMS I/O Summary'')
Disk Status Summary page (Figure 3.14, ''OpenVMS Disk Status Summary'')
Disk Volume Summary page (Figure 3.16, ''OpenVMS Disk Volume Summary'')
Depending on the field, you can sort data alphabetically or numerically. An alphabetical sort is performed using ASCII character values; for example, dollar signs ($) precede letters in the sort order.
2.8.3. Using the Event Pane
The Event pane occupies the bottom part of the System Overview window (Figure 2.30, ''System Overview Window''). In this pane, the Data Analyzer displays events that occur on all the nodes being monitored on your system, including nodes that might not be displayed currently in the Group/Node pane.
Events signal potential problems that might require further investigation. An event must reach a certain level of severity to be displayed. You can customize the severity levels at which events are displayed (see Chapter 7, "Customizing the Availability Manager Data Analyzer"). For more information about displaying events, see Chapter 5, "Getting Information About Events".
The events that are signalled depend on the types of data collection that are performed (see Section 2.8.2.5, ''Specifying Data to Be Collected'').
In the System Overview window, you can change the size of the panes as well as the width of specific fields. You can also change the borders between the fields by placing the mouse on the border, displaying a double-headed arrow, and dragging the border to the right or left.
Scroll bars indicate whether you are displaying all or part of a pane. For example, clicking a right arrow on a scroll bar allows you to view the rightmost portion of a screen.
2.8.4. Other System Overview Window Components
In addition to panes, the System Overview window (Figure 2.30, ''System Overview Window'') also includes features such as a title bar, menu bar, and status bar:
Title bar
The title bar runs across the top of the window and contains the product name and version.
Menu bar
The menu contains the Exit option, which allows you to stop the Data Analyzer and close the window.
The menu contains options that allow you to customize various aspects of the Data Analyzer. These options are explained in Chapter 7, "Customizing the Availability Manager Data Analyzer".
The menu provides information about this Availability Manager release.
Status bar
The status bar, which runs across the bottom of the window, displays the name of the selected group and the number of nodes in that group.
Displaying More Information at Any Time
Click a field to select it.
Double-click most fields to display a page containing information specific to that field.
Right-click a field to display a shortcut menu with additional choices on it.
Chapter 3. Getting Information About Nodes
Node summary data is the only data that is collected by default. The Data Analyzer looks for events only in data that is being collected.
Open any display page that contains node-specific data (for example, CPU, Memory, I/O) to automatically start foreground data collection and event analysis except for Lock Contention and Cluster Summary information. (You must select these tabs individually to start foreground data collection.) Data collection and event evaluation continue as long as a page with node-specific data is displayed.
Click a check mark on the Data Collection Customization page (which you can select on the menu) enables background collection of that type of data. Data is collected and events are analyzed continuously until you remove the check mark.
For additional information about how to change these settings, see Chapter 7, "Customizing the Availability Manager Data Analyzer".
This chapter describes the node data that the Data Analyzer displays by default and more detailed data that you can choose to display. Differences are noted whenever information displayed for OpenVMS nodes differs from that displayed for Windows nodes.
Note
On many node displays, you can hold the cursor over a data field or column header to display a tooltip with a short explanation for that field or header. Figure 3.2, ''Sample Tooltip'' contains an example.
3.1. Group/Node Pane
The Data Analyzer automatically displays data for each node within the groups displayed in the Group/Node pane of the Application window (Figure 3.1, ''OpenVMS Group/Node Pane'').
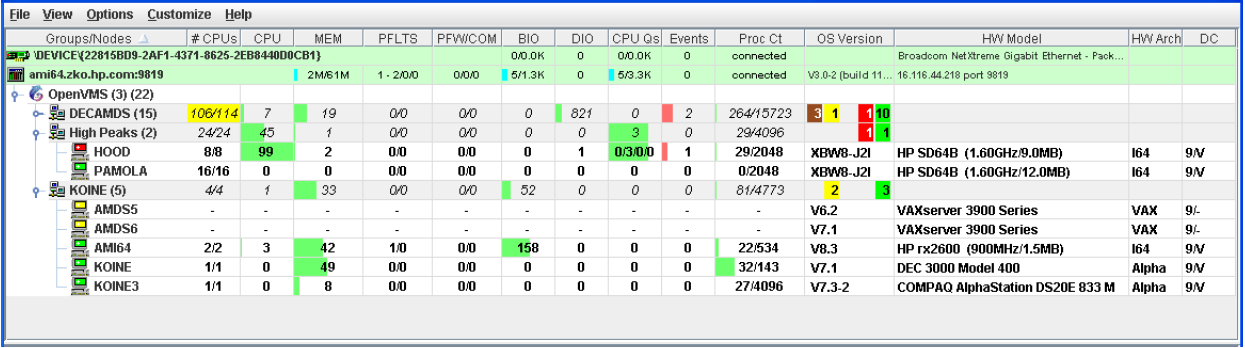 |
|
Color |
Description |
|---|---|
|
Brown |
Attempts to configure the node have failed – for example, because the nodes are in a connection failed state. |
|
Yellow |
Node security check is in progress. |
|
Black |
Network path to node has been lost, or the node is not running. |
|
Red |
Security check was successful. However, a threshold has been exceeded, and an event has been posted. |
|
Green |
Security check was successful; data is being collected. |
If you hold the cursor over a node name, the Data Analyzer displays a tooltip explaining the specific reason for the color that precedes the node name. By holding the cursor over many column headers and some data items on Data Analyzer screens, you can display tooltips. Figure 3.2, ''Sample Tooltip'' is an example of a tooltip that explains the BIO column header in the Group/Node pane.
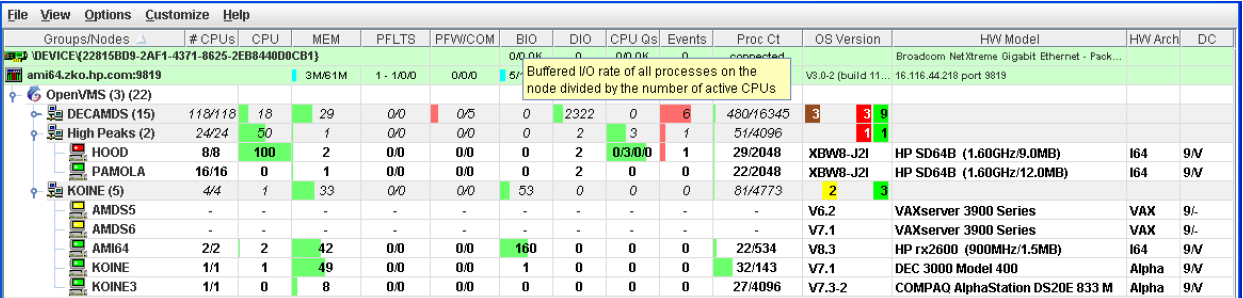 |
|
Color |
Meaning |
|---|---|
|
Brown |
Indicates why the configuration of the node failed. |
|
Yellow |
Shows number of Data Collector multicast "Hello" messages and the number of attempts to configure the node ("Configuration packets sent"). Nodes that remain in this state more than a few seconds indicate network connectivity problems with the Data Analyzer. |
|
Black |
Shows one of the following: |
|
If the node was successfully configured and then lost,
| |
|
If the node was never configured,
| |
|
Red |
If an event causes the output of any message besides an informational one, a node is displayed in red. |
|
Green |
Nodes are in the data collection state. |
The following sections describe the data displayed for OpenVMS and Windows Group/Node panes.
3.1.1. OpenVMS Node Data
Node data with a graph displayed in red indicates that the amount is above the threshold set for the field. For each OpenVMS node and group it recognizes, the Data Analyzer displays the data described in Table 3.2, ''OpenVMS Node Data ''. This table also lists the abbreviation of the event that is related to each type of data, where applicable. See Section 7.8, ''Customizing Events and User Notification of Events'' for information about setting event thresholds. Appendix C, "Tables of Events" describes OpenVMS and Windows events.
|
Data |
Description of Data |
Related Event |
|---|---|---|
|
Node Name |
Name of the node being monitored. |
n/a |
|
CPU? |
Percentage of CPU usage of all processes on the node. |
|
|
Active CPUs |
The number of active CPUs over the number of CPUs in the potential set. The potential set is the maximum number of CPUs available to the node. |
n/a |
|
MEM |
Percentage of space in memory that all processes on the node use. |
LOMEMY |
|
BIO |
Buffered I/O rate of processes on the node. |
HIBIOR |
|
DIO |
Direct I/O usage of processes on the node. |
HIDIOR |
|
CPU Qs |
Number of processes in one of the following states: MWAIT, COLPG, PFW, FPG. |
|
|
Events |
Number of triggered events that are associated with this node. |
List of relevant events |
|
Proc Ct |
Actual count of processes over the maximum number of processes. Percentage of actual to maximum processes. |
HIPRCT |
|
OS Version |
Version of the operating system on the node. |
|
|
HW Model |
Hardware model of the node. |
|
|
HW Arch |
Hardware architecture: x86-64, IA64, Alpha, or VAX. |
n/a |
3.1.2. Windows Node Pane
Figure 3.3, ''Windows Node Pane'' is an example of a Windows Node pane. From the group you select, the Data Analyzer displays all the nodes with which it can communicate.
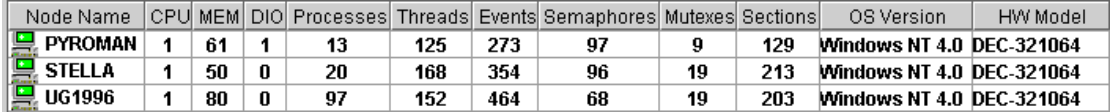
|
Data |
Description |
|---|---|
|
Node Name |
Name of the node being monitored. |
|
CPU |
Percentage of CPU usage of all the processes on the node. |
|
MEM |
Percentage of memory that is in use. |
|
DIO |
Direct I/O usage of processes on the node. |
|
Processes |
Number of processes on the node. |
|
Threads |
Number of threads on the node. A thread is a basic executable entity that can execute instructions in a processor. |
|
Events |
The number of events on the node. An event is used when two or more threads want to synchronize execution. |
|
Semaphores |
The number of semaphores on the node. Threads use semaphores to control access to data structures that they share with other threads. |
|
Mutexes |
The number of mutexes on the node. Threads use mutexes to ensure that only one thread executes a section of code at a time. |
|
Sections |
The number of sections on the node. A section is a portion of virtual memory created by a process for storing data. A process can share sections with other processes. |
|
OS Version |
Version of the operating system on the node. |
|
HW Model |
Hardware model of the node. |
3.2. Node Data Pages
Double-click a data item in the Group/Node or Node pane to display an associated page.
Double-click a node name on the Group/Node or Node pane to display a Node Summary page (Figure 3.4, ''Node Summary''). You can then click other tabs on the Node Summary page to display the same detailed data that you display by double-clicking a data item in the Group/Node or Node pane.
Double-click an event in the Event pane.
|
Menu Option |
Description |
For More Information |
|---|---|---|
|
File |
Contains the Close option, which you can choose to exit from the pages. |
n/a |
|
View |
Contains options that allow you to view data from another perspective. |
See specific pages. |
|
Fix |
Contains options that allow you to resolve various resource availability problems and improve system performance. | |
|
Customize |
Contains options that allow you to organize data collection and analysis and to display data by filtering and customizing data collected from Data Collectors. |
See Chapter 7, "Customizing the Availability Manager Data Analyzer" |
The following sections describe individual node data pages.
3.2.1. Node Summary
When you double-click a node name, operating system (OS) version, or hardware model in an OpenVMS Group/Node pane (Figure 2.30, ''System Overview Window'') or a Windows Node pane (Figure 3.3, ''Windows Node Pane''), the Data Analyzer displays the Node Summary page (Figure 3.4, ''Node Summary'').

|
Data |
Description |
|---|---|
|
Model |
System hardware model name. |
|
OS Version |
Name and version of the operating system. |
|
Uptime |
Time (in days, hours, minutes, and seconds) since the last reboot. |
|
Memory |
Total amount of physical memory (in MBs, GBs, or Tbs) found on the system. |
|
Active CPUs |
Number of CPUs running on the node. |
|
Configured CPUs |
Number of CPUs that are configured to run on the node. |
|
Max RADs |
Maximum number of resource affinity domains (RADs) for this node. |
|
Serial Number |
The system's hardware serial number retrieved from the Hardware Restart Parameter Block (HWRPB). |
|
Galaxy ID |
The Galaxy ID uniquely identifies a Galaxy. Instances in the same Galaxy have the same Galaxy ID. |
3.2.2. CPU Modes and Process Summaries
By clicking the CPU tab, you can display CPU panes that contain more detailed statistics about CPU mode usage and process summaries than the Node Summary does. You can use the CPU panes to diagnose issues that CPU-intensive users or CPU bottlenecks might cause. For OpenVMS nodes, you can also display information about specific CPU processes.
When you double-click a value under the CPU or CPU Qs heading on either an OpenVMS Group/Node or a Windows Node pane, or when you click the CPU tab, the Data Analyzer displays the CPU Mode Summary in the top pane (Figure 3.6, ''OpenVMS CPU Mode Summary and Process States'') and, by default, CPU Mode Details (Figure 3.7, ''OpenVMS CPU Mode Details Pane'') in the lower pane. You can use the menu to select the in the lower pane (Section 3.2.2.4, ''OpenVMS CPU Process Summary '').
CPU mode summaries and process summary panes are described in the following sections. Note that there are differences between the pages displayed for OpenVMS and Windows nodes.
3.2.2.1. Windows CPU Modes
Figure 3.5, ''Windows CPU Modes'' provides an example of a Windows CPU Modes page. The sample page contains values for the three CPU modes – user, privileged, and null.
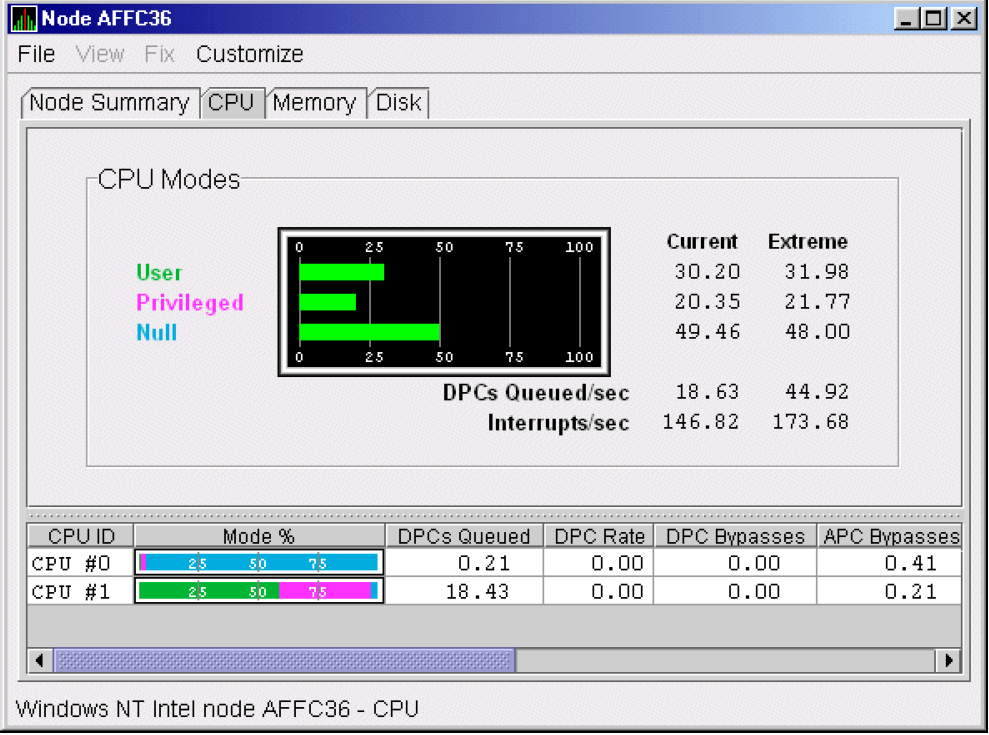
The top pane of the Windows CPU Modes page is a summary of Windows CPU usage, listed by type of mode.
User
Privileged
Null
On the graph, values that exceed thresholds are displayed in red. To the right of the graph are current and extreme amounts for each mode.
Deferred procedure calls (DPCs) queued per second
Interrupts that occurred per second
|
Data |
Description |
|---|---|
|
CPU ID |
Decimal value representing the identity of a processor in a multiprocessing system. On a uniprocessor, this value is always CPU #00. |
|
Mode % |
Graphical representation of the percentage of active modes on that CPU. The color displayed matches the mode color on the graph on the top pane. |
|
DPCs Queued |
Rate that deferred procedure call (DPC) objects are queued to this processor's DPC queue. |
|
DPC Rate |
Average rate that DPC objects are queued to this processor's DPC queue per clock tick. |
|
DPC Bypasses |
Rate that dispatch interrupts were short-circuited. |
|
APC Bypasses |
Rate that kernel asynchronous procedure call (APC) interrupts were short-circuited. |
3.2.2.2. OpenVMS CPU Mode Summary and Process States
Figure 3.6, ''OpenVMS CPU Mode Summary and Process States'' shows sample OpenVMS CPU Mode Summary and CPU Process States, which are the left and right top panes of the CPU Modes page.
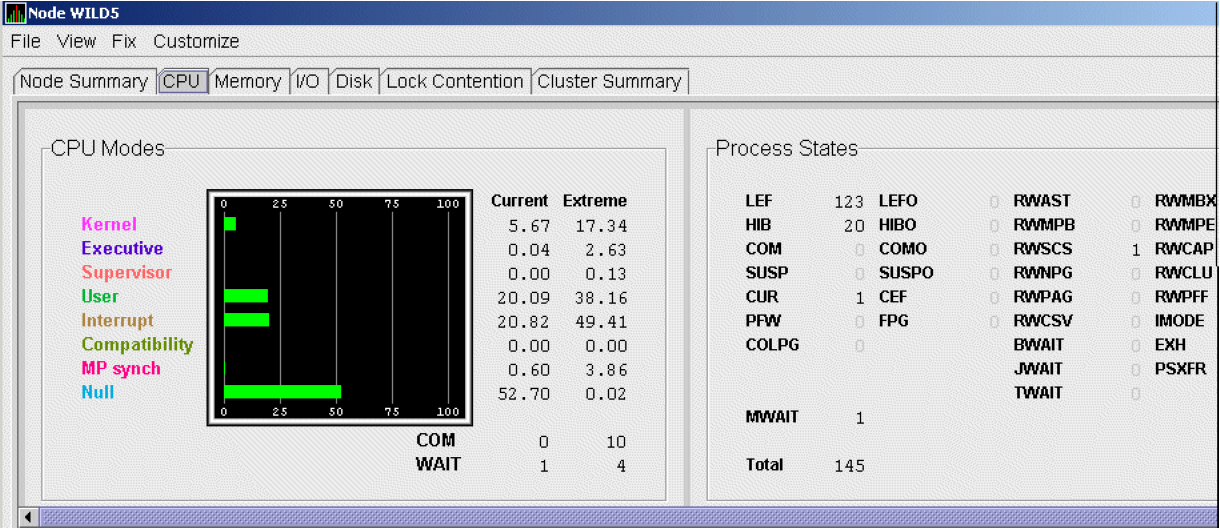
CPU Mode Summary
In the CPU Mode Summary section of the pane, percentages are averaged across all the CPUs and are displayed as a single value on symmetric multiprocessing (SMP) nodes.
To the left of the graph is a list of CPU modes. The bars in the graph represent the percentage of CPU cycles used for each mode. To the right of the graph are current and extreme percentages of time spent in each mode.
COM: The value displayed is the number of processes in the COM and COMO states.
WAIT: The value displayed is the number of processes in the miscellaneous WAIT, MWAIT, COLPG, CEF, PFW, and FPG states.
CPU Process States
The right side of Figure 3.6, ''OpenVMS CPU Mode Summary and Process States'' shows a sample CPU Process States display. Note that the value for MWAIT, in the left column, is the sum of all values for the states in the two right columns.
This display shows the number of processes in each process state. This number is tallied from the data in CPU Process view of the CPU page (Figure 3.6, ''OpenVMS CPU Mode Summary and Process States''). For systems with many processes, the data in the CPU Process view is collected in segments over a short period of time because the amount of data a network packet can contain is limited. Because of this, the number of processes in the Process States pane might differ slightly from what is reported by the MONITOR STATES command.
Appendix B, "CPU Process States" contains explanations of the CPU process states.
3.2.2.3. OpenVMS CPU Mode Details
The lower pane of the CPU Modes page contains CPU mode details, as shown in Figure 3.7, ''OpenVMS CPU Mode Details Pane''.
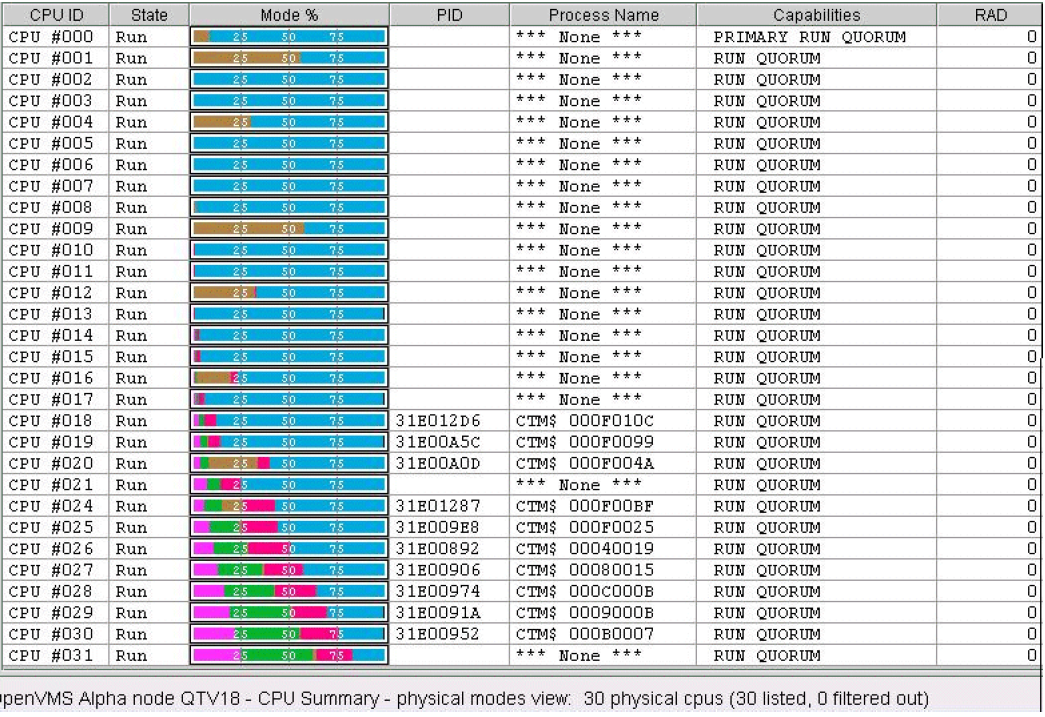
|
Data |
Description |
|---|---|
|
CPU ID |
Decimal value representing the identity of a processor in a multiprocessing system. On a uniprocessor, this value is always CPU #00. |
|
State |
One of the following CPU states: Boot, Booted, Init, Rejected, Reserved, Run, Stopped, Stopping, or Timeout. |
|
Mode % |
Graphical representation of the percentage of active modes on that CPU. The color displayed coincides with the mode color in the graph in the top pane. |
|
PID |
Process identifier (PID) value of the process that is using the CPU. If the PID is unknown to the Data Analyzer application, the internal PID (IPID) is listed. |
|
Process Name |
Name of the process active on the CPU. If no active process is found on the CPU, the name is listed as *** None ***. |
|
Capabilities |
One or more of the following CPU capabilities or flags:
|
|
RAD |
Number of the RAD where the CPU exists. |
The status bar in the OpenVMS CPU Mode Details pane (see Figure 3.7, ''OpenVMS CPU Mode Details Pane'') shows the potential number of physical CPUs on the node, the number that are listed, and the number that are filtered out. The status bar is updated with each data collection. The data collection rate is determined by the customization of CPU mode data collection intervals. See Section 7.5, ''Customizing OpenVMS Data Collection'' for instructions on how to change data collection intervals.
3.2.2.4. OpenVMS CPU Process Summary
To display the OpenVMS CPU Process Summary pane at the bottom of the CPU page, select from the menu (Figure 3.6, ''OpenVMS CPU Mode Summary and Process States''). Figure 3.8, ''OpenVMS CPU Process Summary Pane'' shows a sample OpenVMS CPU Process Summary pane.
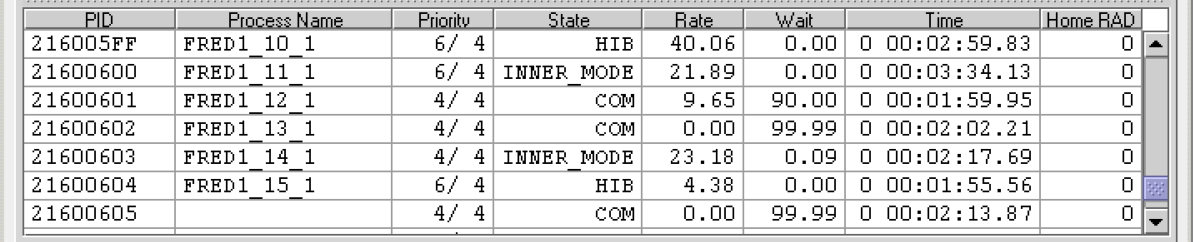
|
Data |
Description |
|---|---|
|
PID |
Process identifier, a 32-bit value that uniquely identifies a process. |
|
Process Name |
Name of the process active on the CPU. |
|
Priority |
Computable (xx) and base (yy) process priority in the format xx/yy . |
|
State |
One of the process states listed in Appendix B, "CPU Process States". |
|
Rate |
Percentage of CPU time used by this process. This is the ratio of CPU time to elapsed time. The CPU rate is also displayed in the bar graph. |
|
Wait |
Percentage of time the process is in the COM or COMO state. |
|
Time |
Amount of actual CPU time charged to the process. |
|
Home RAD |
Where most of the resources of the process reside. |
Displaying Single Process Information
When you double-click a PID on the lower part of an OpenVMS CPU Process Summary (Figure 3.8, ''OpenVMS CPU Process Summary Pane''), Memory Summary (Figure 3.10, ''OpenVMS Memory Summary''), or I/O Summary (Figure 3.12, ''OpenVMS I/O Summary'') page, the Data Analyzer displays the first of several OpenVMS Single Process pages.
On these pages, you can click tabs to display specific data about one process. Alternatively, you can display all of the information on the pages on a single vertical or horizontal grid page.
This data includes a combination of data elements from the CPU Process, Memory, and I/O pages, as well as data for specific quota utilization, current image, and queue wait time. These pages are described in more detail in Section 3.3, ''OpenVMS Single Process Data''.
The status bar in the OpenVMS CPU Process Summary pane (Figure 3.8, ''OpenVMS CPU Process Summary Pane'') shows the total number of processes on the node, the number that are listed, and the number that are filtered out. The status bar is updated with each data collection. The data collection rate is determined by the customization of CPU process data collection intervals. See Section 7.5, ''Customizing OpenVMS Data Collection'' for instructions on how to change data collection intervals.
3.2.3. Memory Summaries and Details
The Memory Summary pages displayed for OpenVMS and Windows nodes are somewhat different, as described in the following sections. The Memory Details page exists only for OpenVMS systems.
3.2.3.1. Windows Memory Summary
Double-click a node, and then click the Memory tab (Figure 3.3, ''Windows Node Pane'').
Double-click a value under the MEM heading (Figure 3.3, ''Windows Node Pane'').
The Data Analyzer displays the Windows Memory page (Figure 3.9, ''Windows Memory '').
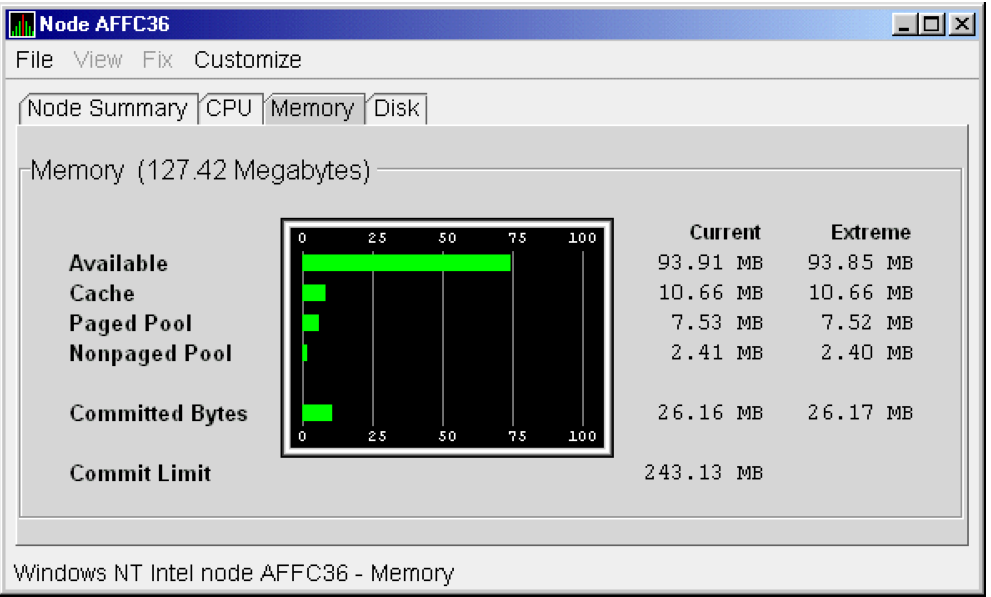
|
Data |
Description |
|---|---|
|
Available |
Size (in bytes) of the virtual memory currently on the zeroed, free, and standby lists. Zeroed and free memory are ready for use, with zeroed memory cleared to zeros. Standby memory is removed from a process's working set but is still available. The graph shows the percentage of physical memory that is available for use. |
|
Cache |
Number of bytes currently in use by the system cache. The system cache is used to buffer data retrieved from disk or LAN. The system cache uses memory not in use by active processes on the computer. The graph shows the percentage of physical memory devoted to the cache. |
|
Paged Pool |
Number of bytes in paged pool, a system memory area where operating system components acquire space as they complete their tasks. Paged pool pages can be paged out to the paging file when the system does not access them for long periods of time. The graph shows the percentage of physical memory devoted to paged pool. |
|
Nonpaged Pool |
Number of bytes in nonpaged pool, a system memory area where operating system components acquire space as they complete their tasks. Nonpaged pool pages cannot be paged out to the paging file; instead, they remain in memory as long as they are allocated. The graph shows the percentage of physical memory devoted to nonpaged pool. |
|
Committed Bytes |
Amount of available virtual memory (the Commit Limit) that is in use. Note that the commit limit can change if the paging file is extended. The graph shows the percentage of the Commit Limit used by the Committed Bytes. |
|
Commit Limit |
Size (in bytes) of virtual memory that can be committed without having to extend the paging files. If the paging files can be extended, this limit can be raised. |
3.2.3.2. OpenVMS Memory Summary
When you double-click a value under the MEM heading in an OpenVMS Node pane, or if you click the Memory tab, the Data Analyzer displays the OpenVMS Memory Summary page (Figure 3.10, ''OpenVMS Memory Summary'').
Memory Summary view
Memory Details view
You can click Memory Summary view to select the Memory Summary page, shown in Figure 3.10, ''OpenVMS Memory Summary''.
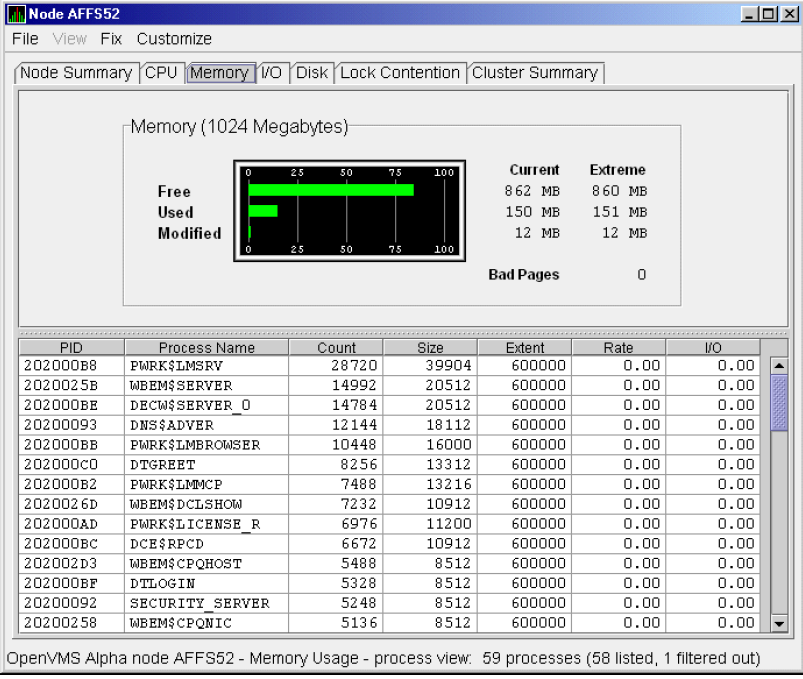
The graph in the top pane of Figure 3.10, ''OpenVMS Memory Summary'' shows memory distribution (Free, Used, and Modified) as absolute values, in megabytes of memory. Current and extreme values are also listed for each type of memory distribution. (Free memory uses the lowest seen value as its extreme.) Bad Pages show the number of pages that the operating system has marked as bad.
The thresholds that you see in the graph are the ones set for the LOMEMY event. (The LOMEMY thresholds are also in the display of values for the MEM field in the OpenVMS Group/Node pane shown in Figure 2.30, ''System Overview Window''.)
|
Data |
Description |
Related Events |
|---|---|---|
|
PID |
Process identifier. A 32-bit value that uniquely identifies a process. |
n/a |
|
Process Name |
Name of the process. |
|
|
Count |
Number of physical pages or pagelets of memory that the process is using for the working set count. |
LOWEXT |
|
Size |
Number of pages or pagelets of memory the process is allowed to use for the working set size (also known as the working set list size). The operating system periodically adjusts this value based on an analysis of page faults relative to CPU time used. |
LOWSQU |
|
Extent |
Number of pages or pagelets of memory in the process's working set extent (WSEXTENT) quota as defined in the user authorization file (UAF). Number of pages or pagelets cannot exceed the value of the system parameter WSMAX. |
LOWEXT |
|
Rate |
Number of page faults per second for the process. |
|
|
I/O |
Rate of I/O read attempts necessary to satisfy page faults (also known as page read I/O or the hard fault rate). |
PRPIOR |
When you double-click a PID on the lower part of the Memory Summary page (Figure 3.10, ''OpenVMS Memory Summary''), the Data Analyzer displays an OpenVMS Single Process (Figure 3.23, ''Single Process Window''), where you can click tabs to display pages containing specific data about one process. This data includes a combination of data from the CPU Process, Memory, and I/O pages, as well as data for specific quota utilization, current image, and queue wait time. These pages are described in Section 3.3, ''OpenVMS Single Process Data''.
The status bar in the Memory Summary page (Figure 3.10, ''OpenVMS Memory Summary'') shows the total number of processes on the node, the number that are listed, and the number that are filtered out. The status bar is updated with each data collection. The data collection rate is determined by the customization of memory data collection intervals. See Section 7.5, ''Customizing OpenVMS Data Collection'' for instructions on how to change data collection intervals.
3.2.3.3. OpenVMS Memory Details
Memory Summary view
Memory Details view (Alpha only)
The Data Analyzer displays the OpenVMS Memory Details page (Figure 3.11, ''OpenVMS Memory Details'').
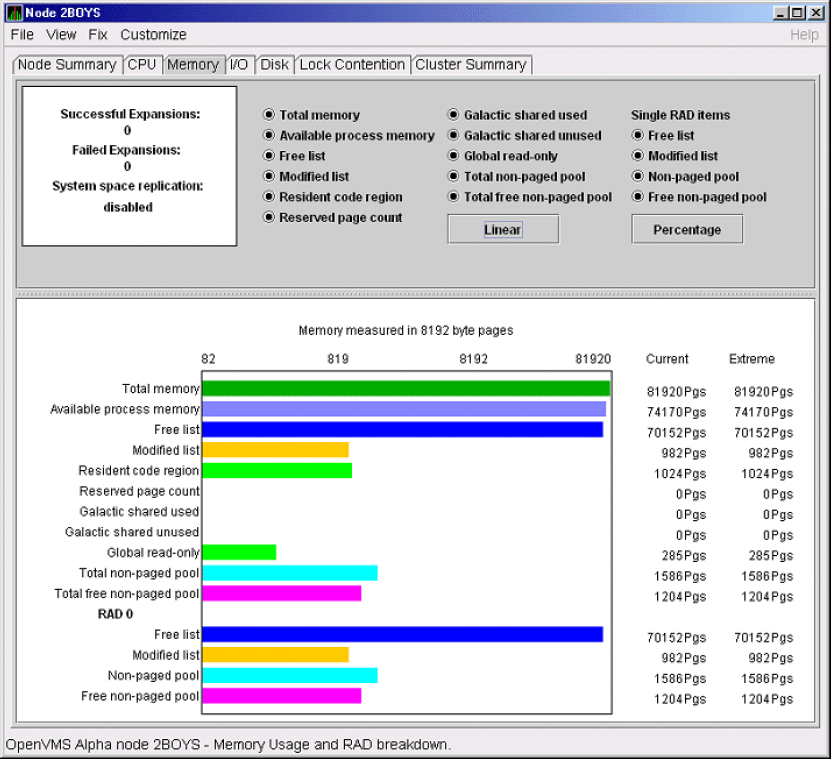
|
Heading |
Description |
|---|---|
|
Successful Expansions |
Number of successful nonpaged pool expansions. |
|
Failed Expansions |
Number of failed attempts to expand nonpaged pool. |
|
System space replication |
Whether system space replication is enabled or disabled. |
To the right of the box is a list of system memory data that is displayed in the bar graphs at the bottom of the page. You can toggle these data items on or off (that is, to display them as bar graphs). You can also click a small box to choose between Linear and Logarithmic bar graph displays.
|
Data |
Description |
|---|---|
|
Total memory |
Total physical memory size, as seen by OpenVMS. |
|
Available process memory |
Amount of total physical memory available to processes. This is the total memory minus memory allocated to OpenVMS. |
|
Free list |
Size of the free page list. |
|
Modified list |
Size of the modified page list. |
|
Resident code region |
Size of the resident image code region. |
|
Reserved page count |
Number of reserved memory pages. |
|
Galactic shared used |
Galaxy shared memory pages currently in use. |
|
Galactic shared unused |
Galaxy shared memory pages currently not in use. |
|
Global read-only |
Read-only pages, which are installed as resident when system space replication is enabled, that will also be replicated for improved performance. |
|
Total nonpaged pool |
Total size of system nonpaged pool. |
|
Total free nonpaged pool |
Amount of nonpaged pool that is currently free. |
|
Data |
Description |
|---|---|
|
Free list |
Size of the free page list. |
|
Modified list |
Size of the modified page list. |
|
Nonpaged pool |
Total size of system nonpaged pool. |
|
Free nonpaged pool |
Amount of nonpaged pool that is currently free. |
Below the list of single RAD items is a box where you can toggle between Percentage and Raw Data to display Current and Extreme values to the right of the bar graphs.
3.2.4. OpenVMS I/O Summary and Page/Swap Files
By clicking the I/O tab on any OpenVMS node data page, you can display a page that contains summaries of accumulated I/O rates. In the top pane, the summary covers all processes; in the lower pane, the summary is for one process.
From the menu, you can also choose to display (in the lower pane) a list of page and swap files.
3.2.4.1. OpenVMS I/O Summary
The OpenVMS I/O Summary page displays the rate, per second, at which I/O transfers take place, including paging write I/O (WIO), direct I/O (DIO), and buffered I/O (BIO). In the top pane, the summary is for all CPUs; in the lower pane, the summary is for one process.
When you double-click a data item under the DIO or BIO heading on the Node pane, or if you click the I/O tab, by default, the Data Analyzer displays the OpenVMS I/O Summary (Figure 3.12, ''OpenVMS I/O Summary'').
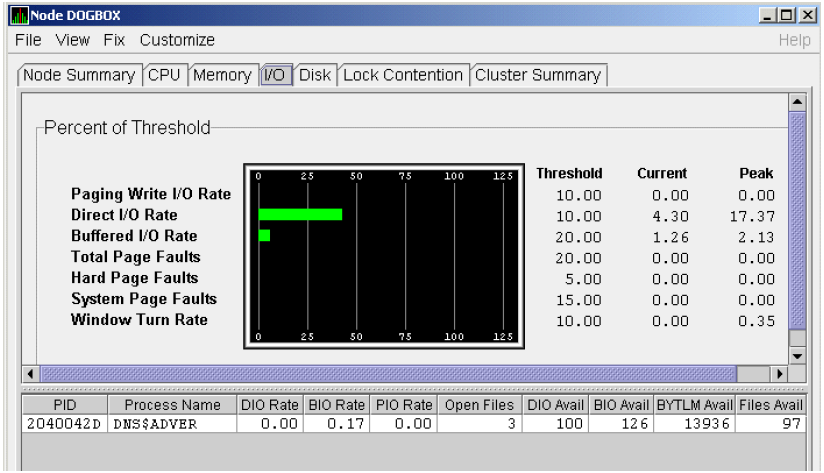
Current and peak values are listed for each type of I/O. Values that exceed thresholds set by the events indicated in the table are displayed in red on the screen. Appendix C, "Tables of Events" describes OpenVMS and Windows events.
|
Value |
Description |
|---|---|
|
Threshold |
Defined in Event Configuration Properties. |
|
Current |
Current value or rate. |
|
Peak |
Highest value or rate seen since start of data collection. |
|
Data |
Description |
|---|---|
|
PID |
Process identifier. A 32-bit value that uniquely identifies a process. |
|
Process Name |
Name of the current process. |
|
DIO Rate |
Direct I/O rate. The rate at which I/O transfers occur between the system devices and the pages or pagelets that contain the process buffer that the system locks in physical memory. |
|
BIO Rate |
Buffered I/O rate. The rate at which I/O transfers occur between the process buffer and an intermediate buffer from the system buffer pool. |
|
PIO Rate |
Paging I/O rate. The rate of read attempts necessary to satisfy page faults (also known as page read I/O or the hard fault rate). |
|
Open Files |
Number of open files. |
|
DIO Avail |
Direct I/O limit remaining. The number of remaining direct I/O limit operations available before the process reaches its quota. DIOLM quota is the maximum number of direct I/O operations a process can have outstanding at one time. |
|
BIO Avail |
Buffered I/O limit remaining. The number of remaining buffered I/O operations available before the process reaches its quota. BIOLM quota is the maximum number of buffered I/O operations a process can have outstanding at one time. |
|
BYTLM |
The number of buffered I/O bytes available before the process reaches its quota. BYTLM is the maximum number of bytes of nonpaged system dynamic memory that a process can claim at one time. |
|
Files |
Open file limit remaining. The number of additional files the process can open before reaching its quota. The FILLM quota is the maximum number of files that can be opened simultaneously by the process, including active network logical links. |
When you double-click a PID on the lower part of the I/O Summary page, the Data Analyzer displays an OpenVMS Single Process, where you can click tabs to display specific data about one process. See Section 3.3, ''OpenVMS Single Process Data'' for more details.
The status bar in the OpenVMS I/O Summary page (Figure 3.12, ''OpenVMS I/O Summary'') shows the total number of processes on the node, the number that are listed, and the number that are filtered out. The status bar is updated with each data collection. The data collection rate is determined by the customization of I/O data collection intervals. See Section 7.5, ''Customizing OpenVMS Data Collection'' for instructions on how to change data collection intervals.
3.2.4.2. OpenVMS I/O Page/Swap Files
Click on the I/O page menu to select this option. The Data Analyzer displays an OpenVMS I/O Page/Swap Files page. The top pane displays the same information as that in the OpenVMS I/O Summary page in Figure 3.12, ''OpenVMS I/O Summary''. The lower pane contains the I/O Page/Swap Files pane shown in Figure 3.13, ''OpenVMS I/O Page/Swap Files''.
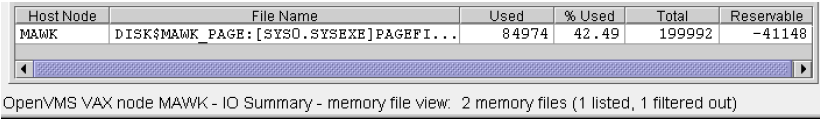
|
Data |
Description |
|---|---|
|
Host Name |
Name of the node on which the page or swap file resides. |
|
File Name |
Name of the page or swap file. For secondary page or swap files, the file name is obtained by a special AST to the job controller on the remote node. The Data Analyzer makes one attempt to retrieve the file name. |
|
Used |
Number of used blocks in the file. |
|
% Used |
Of the available blocks in each file, the percentage that has been used. |
|
Total |
Total number of blocks in the file. |
|
Reservable |
The number of reservable blocks in each page or swap file currently installed. Reservable blocks are blocks that might be logically claimed by a process for future physical allocation. A negative value indicates that the file might be overcommitted. Note that a negative value is not an immediate concern, it indicates that the file might become overcommitted if physical memory becomes scarce. |
Note
The Reservable field is not applicable to the page or swap files on OpenVMS Version 7.3-1 and later systems. The Data Analyzer displays N/A in the field for these versions of OpenVMS.
If events for secondary page and swap files are signaled before the Data Analyzer has resolved their file names from the file ID (FID), events such as LOPGSP display the FID instead of file name information. You can determine the file name for the FID by checking the File Name field in the I/O Page Swap Files page. The FID for the file name is displayed after the file name.
The status bar in the OpenVMS I/O Page/Swap Files pane (Figure 3.13, ''OpenVMS I/O Page/Swap Files'') shows the total number of processes on the node, the number that are listed, and the number that are filtered out. The status bar is updated with each data collection. The data collection rate is determined by the customization of page/swap data collection intervals. See Section 7.5, ''Customizing OpenVMS Data Collection'' for instructions on how to change data collection intervals.
3.2.5. Disk Summaries
The Disk tab on the Node Summary page (Figure 3.4, ''Node Summary'') allows you to display disk pages that contain data about availability, count, and errors of disk devices on the system. OpenVMS disk data displays differ from those for Windows nodes, as described in the following sections.
Status Summary
Volume Summary
Also, on the Disk Status Summary, you can double-click a device name to display a Single Disk Summary page.
3.2.5.1. OpenVMS Disk Status Summary
To display the default disk page, the OpenVMS Disk Status Summary page (Figure 3.14, ''OpenVMS Disk Status Summary''), click the Disk tab on the OpenVMS Node Summary page (Figure 3.4, ''Node Summary''). The Disk Status Summary page displays disk device data, including path, volume name, status, and mount, transaction, error, and resource wait counts.
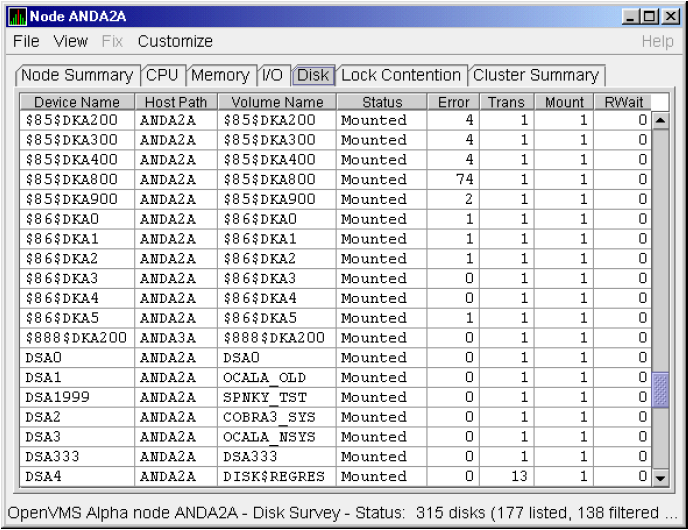
|
Heading |
Description | |
|---|---|---|
|
Device Name |
Standard OpenVMS device name that indicates where the device is located, as well as a controller or unit designation. | |
|
Host Path |
Primary path (node) from which the device receives commands. | |
|
Volume Name |
Name of the mounted media. | |
|
Status |
One or more of the following disk status values: | |
|
Alloc |
Disk is allocated to a specific user. | |
|
CluTran |
Disk status is uncertain because of a cluster state transition in progress. | |
|
Dismount |
Disk in process of dismounting; may be waiting for a file to close. | |
|
Foreign |
Disk is mounted with the /FOREIGN qualifier. | |
|
Invalid |
Disk is in an invalid state (most likely Mount Verify Timeout). | |
|
MntVerify |
Disk is waiting for a mount verification. | |
|
Mounted |
Disk is logically mounted by a MOUNT command. | |
|
Offline |
Disk is no longer physically mounted in device drive. | |
|
Online |
Disk is physically mounted in device drive. | |
|
Shadow Set Member |
Disk is a member of a shadow set. | |
|
Unavailable |
Disk is set to unavailable. | |
|
Wrong Volume |
Disk was mounted with the wrong volume name. | |
|
Wrtlck |
Disk is mounted and write locked. | |
|
Error |
Number of errors generated by the disk (a quick indicator of device problems). | |
|
Trans |
Number of in-progress file system operations for the disk. | |
|
Mount |
Number of nodes that have the specified disk mounted. (These nodes must have the Data Collector installed and running to be participate in the mount count.) | |
|
Rwait |
Indicator that a system I/O operation is stalled, usually during normal recovery from a connection failure or during volume processing of host-based shadowing. | |
The status bar in the OpenVMS Disk Status Summary (Figure 3.14, ''OpenVMS Disk Status Summary'') shows the total number of disks on the node, the number that are listed, and the number that are filtered out. The status bar is updated with each data collection. The data collection rate is determined by the customization of disk status data collection intervals. See Section 7.5, ''Customizing OpenVMS Data Collection'' for instructions on how to change data collection intervals.
3.2.5.2. OpenVMS Single Disk Summary
To collect single disk data and display the data on the Single Disk Summary, double-click a device name on the Disk Status Summary. Figure 3.15, ''OpenVMS Single Disk Summary'' is an example of a Single Disk Summary page. The display interval of the data collected is 5 seconds.
Note that you can sort the order in which data is displayed in the Single Disk Summary page by clicking a column header. To reverse the sort order of a column of data, click the column header again.
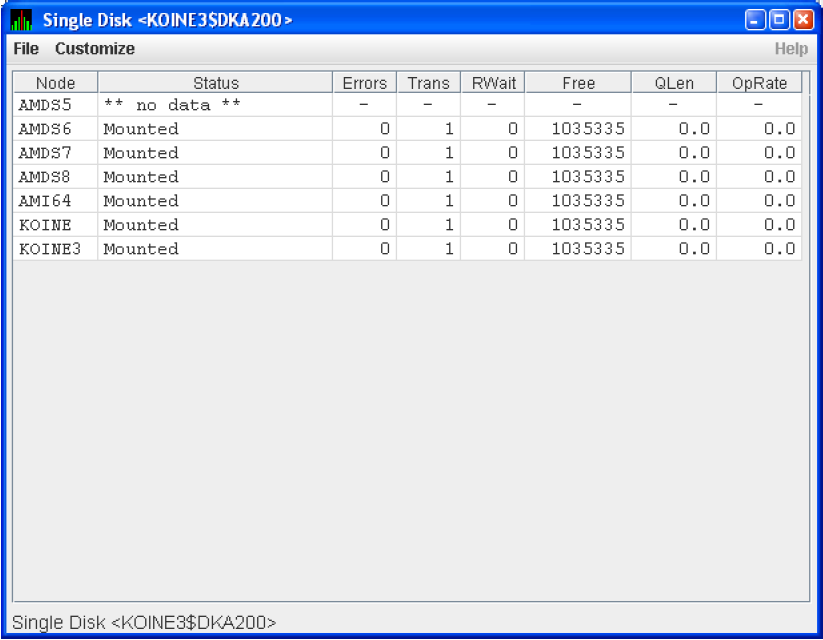
|
Data |
Description |
|---|---|
|
Node |
Name of the node. |
|
Status |
Status of the disk: mounted, online, offline, and so on. |
|
Errors |
Number of errors on the disk. |
|
Trans |
Number of in-progress file system operations on the disk (number of open files on the volume). |
|
Rwait |
Indication of an I/O stalled on the disk. |
|
Free |
Number of free disk blocks on the volume. |
|
QLen |
Average number of operations in the I/O queue for the volume. |
|
OpRate |
Each node's contribution to the total operation rate (number of I/Os per second) for the disk. |
3.2.5.3. OpenVMS Disk Volume Summary
By using the option on the Disk Status Summary page (Figure 3.14, ''OpenVMS Disk Status Summary''), you can select the option to display the OpenVMS Disk Volume Summary (Figure 3.16, ''OpenVMS Disk Volume Summary''). This page displays disk volume data, including path, volume name, disk block utilization, queue length, and operation rate.
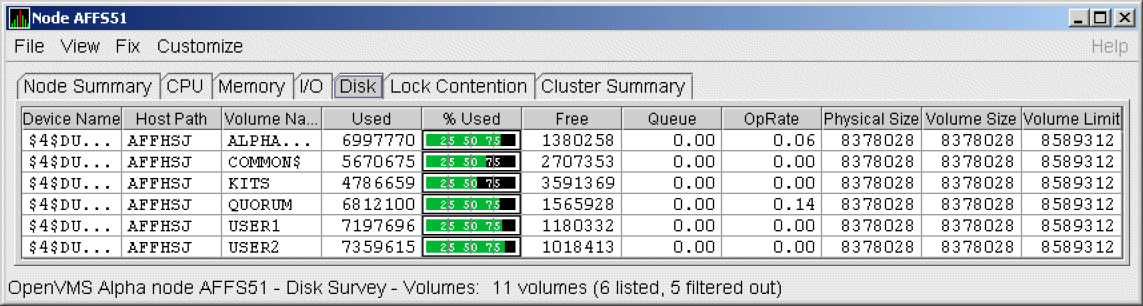
|
Data |
Description |
|---|---|
|
Device Name |
Standard OpenVMS device name that indicates where the device is located, as well as a controller or unit designation. |
|
Host Path |
Primary path (node) from which the device receives commands. |
|
Volume Name |
Name of the mounted media. |
|
Used |
Number of blocks on the volume that are in use. |
|
% Used |
Percentage of the number of volume blocks in use in relation to the total volume blocks available. |
|
Free |
Number of blocks of volume space available for new data from the perspective of the node that is mounted. |
|
Queue |
Average number of I/O operations pending for the volume (an indicator of performance; less than 1.00 is optimal). |
|
OpRate |
Operation rate for the most recent sampling interval. The rate measures the amount of activity on a volume. The optimal load is device specific. |
|
Physical Size |
Total number of blocks on the current physical disk device. This is the "Total Blocks" field of the SHOW DEVICE/FULL display |
|
Volume Size |
Current number of blocks available for file allocation. This is the "Logical Volume Size" field of the SHOW DEVICE/FULL display. (For more information, see SET VOLUME/SIZE.) This column is displayed only on OpenVMS Version 7.3-2 and later systems. |
|
Volume Limit |
Maximum number of blocks the volume can reach using Dynamic Volume Expansion. This is the "Expansion Size Limit"of SHOW DEVICE/FULL display. (For more information, see SET VOLUME/LIMIT.) This column is displayed only on OpenVMS Version 7.3-2 and later systems. |
 AFFS55 Volume size of device $8$DKA200 (OPAL-X9U6) has changed
   ^                              ^          ^
  Node                          Device     Volume
  name                           name       name
The status bar in the OpenVMS Disk Volume Summary (Figure 3.16, ''OpenVMS Disk Volume Summary'') shows the total number of volumes on the node, the number that are listed, and the number that are filtered out. The status bar is updated with each data collection. The data collection rate is determined by the customization of disk volume data collection intervals. See Section 7.5, ''Customizing OpenVMS Data Collection'' for instructions on how to change data collection intervals.
3.2.5.4. Windows Logical and Physical Disk Summaries
Logical Disk Summary
Physical Disk Summary
Windows Logical Disk Summary
A logical disk is the user-definable set of partitions under a drive letter. The Windows Logical Disk Summary displays logical disk device data, including path, label, percentage used, free space, and queue statistics.
Double-click a node name in the Node pane to display the Windows Node Summary.
Click the Disk tab on the Windows Node Summary.
The Data Analyzer displays the Windows Logical Disk Summary page (Figure 3.17, ''Windows Logical Disk Summary'').
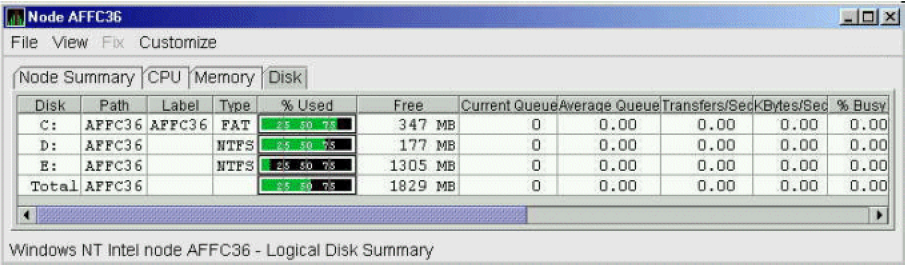
|
Data |
Description |
|---|---|
|
Disk |
Drive letter, for example, c:, or Total, which is the summation of statistics for all the disks. |
|
Path |
Primary path (node) from which the device receives commands. |
|
Label |
Identifying label of a volume. |
|
Type |
File system type; for example, FAT or NTFS. |
|
% Used |
Percentage of disk space used. |
|
Free |
Amount of free space available on the logical disk unit. |
|
Current Queue |
Number of requests outstanding on the disk at the time the performance data is collected. It includes requests in progress at the time of data collection. |
|
Average Queue |
Average number of both read and write requests that were queued for the selected disk during the sample interval. |
|
Transfers/Sec |
Rate of read and write operations on the disk. |
|
KBytes/Sec |
Rate data is transferred to or from the disk during write or read operations.The rate is displayed in kilobytes per second. |
|
% Busy |
Percentage of elapsed time that the selected disk driveis busy servicing read and write requests. |
Windows Physical Disk Summary
A physical disk is hardware used on your computer system. The Windows Physical Disk Summary displays disk volume data, including path, label, queue statistics, transfers, and bytes per second.
Click the menu on the Windows Logical Disk Summary.
Click the menu option.
The Data Analyzer displays the Windows Physical Disk Summary page (Figure 3.18, ''Windows Physical Disk Summary'').
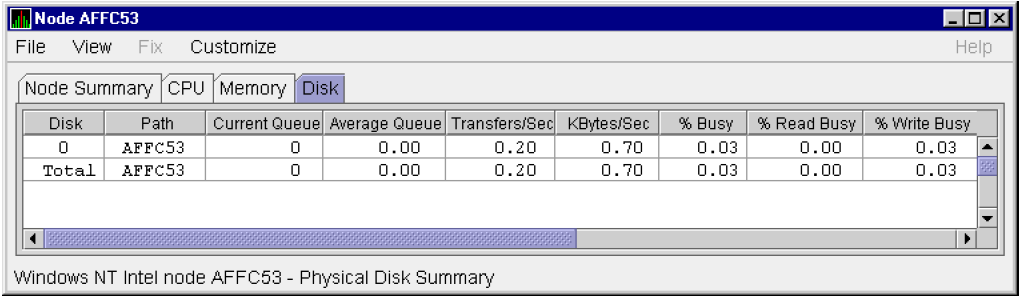
|
Data |
Description |
|---|---|
|
Disk |
Drive number, for example, 0, 1, 2 or Total, which is the summation of statistics for all the disks. |
|
Path |
Primary path (node) from which the device receives commands. |
|
Current Queue |
Number of requests outstanding on the disk at the time the performance data is collected; it includes requests in service at the time of data collection. |
|
Average Queue |
Average number of read and write requests that were queued for the selected disk during the sample interval. |
|
Transfers/Sec |
Rate of read and write operations on the disk. The rate is displayed in kilobytes per second. |
|
KBytes/Sec |
Rate bytes are transferred to or from the disk during read or write operations. The rate is displayed in kilobytes per second. |
|
% Busy |
Percentage of elapsed time the selected disk drive is busy servicing read and write requests. |
|
% Read Busy |
Percentage of elapsed time the selected disk drive is busy servicing read requests. |
|
% Write Busy |
Percentage of elapsed time the selected disk drive is busy servicing write requests. |
3.2.6. OpenVMS Lock Contention
Note
Lock contention data is accurate only if every node in an OpenVMS Cluster environment is in the same group. You might lose accuracy if you do not have all the nodes of a cluster in one group.
3.2.6.1. Lock Contention Page in Decoded Format
Figure 3.19, ''OpenVMS Lock Contention (Decoded Format)'' shows a sample Lock Contention page containing resource names in decoded format, which is the default.
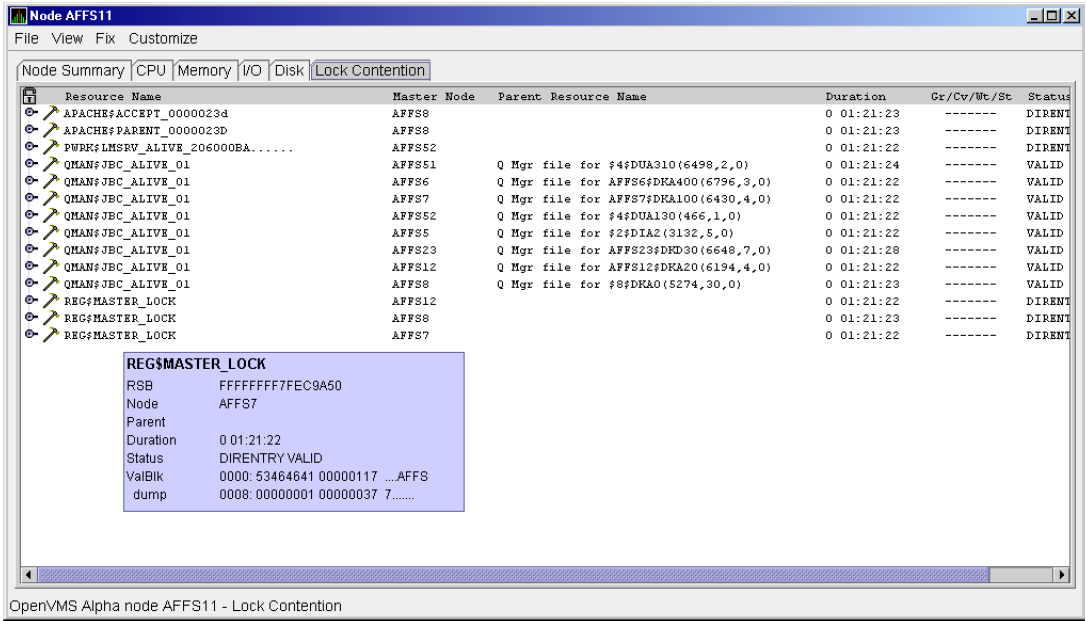
You can display a tooltip similar to the one shown in Figure 3.19, ''OpenVMS Lock Contention (Decoded Format)'' by holding the cursor on a resource line.
Raw format (the format that SDA uses)
Decoded format (the default format)
Figure 3.19, ''OpenVMS Lock Contention (Decoded Format)'' displays the resource names in decoded format. (The Data Analyzer decodes common resource names.)
|
Lock Log Reference Number |
Data |
Description |
|---|---|---|
|
1 |
Resource Name |
Resource name associated with the $ENQ system service call. |
|
2 |
Master Node |
Node on which the resource is mastered. |
|
3 |
Parent Resource |
Name of the parent resource. No name is displayed when a parent resource does not exist. |
|
4 |
Duration |
Time elapsed since the Data Analyzer first detected the contention situation. |
|
5 |
Gr/Cv/Wt/St |
Total number of locks in each of four states. Numbers
for these states appear only when you are collecting
lock data. The states are:
Stalled indicates one of several states whenever a lock is waiting for a response from another node in the cluster. |
|
6 |
Status |
Status of the lock. See the $ENQW description of flags in the VSI OpenVMS System Services Reference Manual. |
|
Reference Number |
Data |
Description |
|---|---|---|
|
7 |
RSB |
Address of the Resource Block |
|
8 |
ValBlk dump |
Resource Value Block dump in standard OpenVMS dump format |
3.2.6.2. Lock Contention Page in Raw Format
Figure 3.20, ''OpenVMS Lock Contention (Raw Format)'' shows the Lock Contention page with resource name data displayed in raw format. It also shows the tooltip that is displayed when you hold the cursor over a line of data.
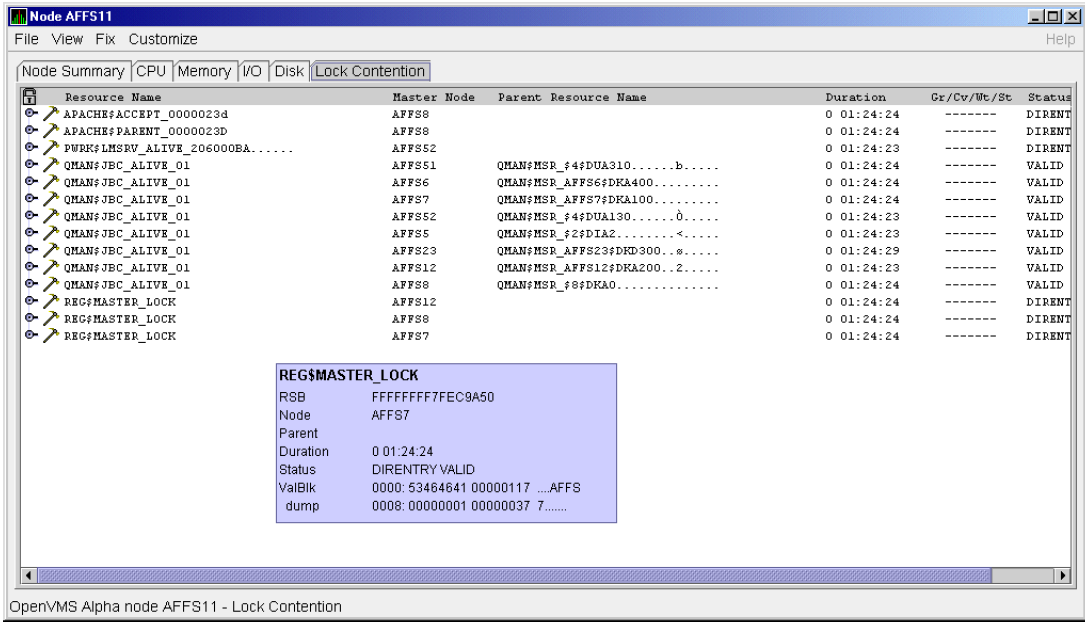
In Figure 3.20, ''OpenVMS Lock Contention (Raw Format)'', notice that a period is substituted for each unprintable character in the Resource Name and Parent Resource Name fields.
3.2.6.3. Lock Block Data
When you click the handle that precedes any line of resource data, the Data Analyzer displays the lock block data that is shown in Figure 3.21, ''OpenVMS Lock Block Data'' and Figure 3.22, ''OpenVMS Lock Block Data (Retry Stalled State)''.
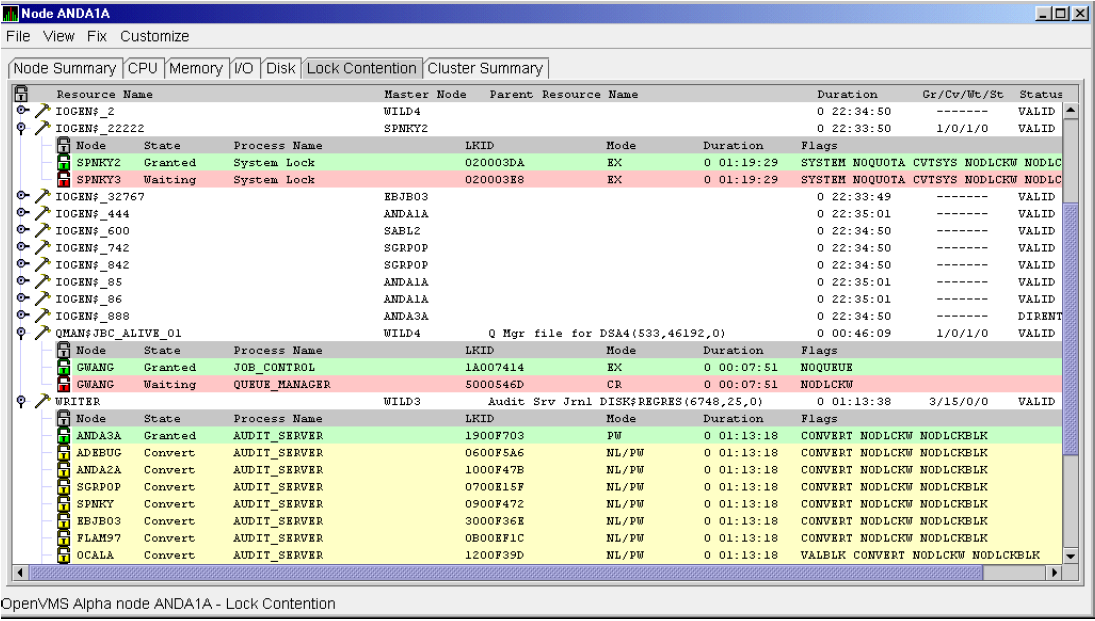
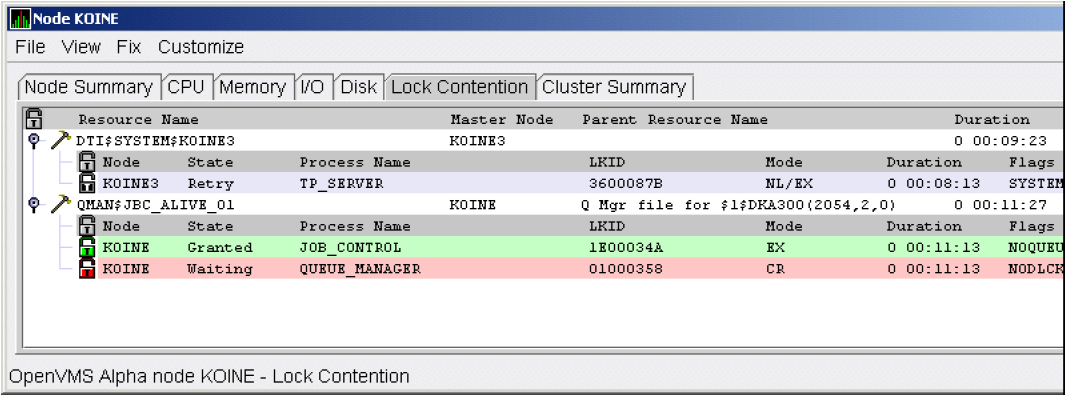
|
Reference Number |
Data |
Description | ||
|---|---|---|---|---|
|
9 |
Node |
Node name on which the lock is granted. | ||
|
10 |
State |
One of the following: | ||
|
Color |
Meaning | |||
|
Green |
Granted | |||
|
Yellow |
Converting | |||
|
Pink |
Waiting | |||
|
Pale grey |
Stalled states that are visible: SCSWAIT: A transient state indicating that a lock message has been sent to the node with the master lock and a response is awaited. RETRY: A transient state seen only under error conditions that require that a lock message be resent. This can occur if the node to which a lock message was sent goes down before a response from it is received or if resources for sending a message cannot be allocated. | |||
|
11 |
Process Name |
Name of the process that owns . | ||
|
12 |
LKID |
Lock ID value (which is useful with SDA). | ||
|
13 |
Mode |
One of the following modes in which the lock is granted or requested:? | ||
|
CR |
Concurrent read |
Grants read access and allows resource sharing with other readers and writers. | ||
|
CW |
Concurrent write |
Grants write access and allows resource sharing with other groups. | ||
|
EX |
Exclusive |
Grants write access and prevents resource sharing with any other readers or writers. | ||
|
NL |
Null |
Grants no access; used as an indicator of interest or a placeholder for future lock conversion. | ||
|
PR |
Protected read |
Grants read access and allows resource sharing with other readers, but not writers. | ||
|
PW |
Protected write |
Grants write access and prevents resource sharing with any other readers or writers. | ||
|
If one mode is displayed, it is the Granted mode; if two modes are displayed, the first is the Granted mode and the second is the Converting mode. | ||||
|
14 |
Duration |
Length of time the lock has been in the current queue since the console application found the lock. | ||
|
15 |
Flags |
Flags specified with the $ENQW request. See the $ENQW entry in VSI OpenVMS System Services Reference Manual. | ||
To interpret the information displayed on the OpenVMS Lock Contention page, you need to understand OpenVMS lock management services. For more information, see the VSI OpenVMS System Services Reference Manual.
3.2.6.4. Lock Block Log File
Example 3.1, ''Lock Block Log File'' contains an excerpt of a lock block log file. See Appendix A, "Location of the Availability Manager Configuration and Log Files" for the lock block log file name format and location.
|
Lock Log Reference Number |
Data from Example |
Description |
|---|---|---|
|
16 |
Reason for logging |
In the example, the reason for logging is "the number of locks has changed." Other reasons include the "initial discovery of resource contention" or "lock data collection has been turned on." |
|
17 |
GGMODE/CGMODE |
Lock has been Granted/Lock is Converting. |
|
18 |
Resource Name Dump |
OpenVMS style of Resource Name dump. |
|
19 |
RDB global database name resource |
Decoded Resource Name. |
|
20 |
Parent Resource Name Dump |
OpenVMS style of Parent Resource Name dump. |
|
21 |
RDB global database name resource |
Decoded Parent Resource Name. |
|
22 |
Lock data is being collected |
The handle preceding a line of lock data has been set to the open position. This starts the data collection of the lock block data. |
|
23 |
Master copy info. Remote Node |
Remote node that contains the master copy of the lock. If "Local Copy," only one node is interested in the lock. |
|
24 |
Master copy info. Remote Lock ID |
Lock ID of remote node that contains the master copy of the lock. |
**************************************************
Time:  11-Feb-2020 14:54:13.656

16)Reason for logging:    Number of locks has changed

2) Master Lock Node:      ALTOS

1) Resource Name:         I.....
17)    GGMODE/CGMODE:     EX/EX
6)     Status:            VALID
7)     RSB Address:       FFFFFFFE.889F1580
18)    Resource Name Dump (includes initial count byte):
          0000:   000200 00004906  .I.....

8)     Value Block Dump:
          0000: 00000000 00000000  ........
          0008: 00000000 00000000  ........

19) Rdb Remote monitor resource
          #:                 2

3) Parent Resource Name:  Ý...D....VDEROOT     . 7....
7)     RSB Address:       FFFFFFFE.8847DB80
20)    Resource Name Dump (includes initial count byte):
          0000: 00004400 0000DD1C  .....D..
          0008: 4F4F5245 44560200  ..VDEROO
          0010: A0002020 20202054  T     ..
          0018:       00 00000237  7....

8)     Value Block Dump:
          0000: 00000000 00000000  ........
          0008: 00000000 00000000  ........

21)    Rdb global database name resource
          Disk volume name:  VDEROOT
          FID for file:      (14240,2,0)

22) Lock data is being collected

5)     Granted lock count:       1
5)     Conversion lock count:    0
5)     Waiting lock count:       4
5)     Stalled lock count:       0

  10)     9)              11)           12)      13) Master copy info:  15)
 Lock    Node  Process  Process         Lock    Gr/Cv Remote Remote   Flags
 State         PID      Name            ID       Mode Node   Lock ID
                                                       23)    24)
 Granted ALTOS 28E00441 RDMS_MONITOR70  04014B37 EX (Local copy)    NQUE SYNC SYS
 Waiting ALTOS 2880023F RDMS_MONITOR70  4C0065B5 PR TSAVO  32005001 SYNC SYS  NDLW
 Waiting ALTOS 00000000 (EPID=28A0023D) 4C0144C4 PR ETOSHA 74005E36 SYNC SYS  NDLW
 Waiting ALTOS 28C00448 RDMS_MONITOR70  1D0144A3 PR CHOBE  77005906 SYNC SYS  NDLW
 Waiting ALTOS 28E026C3 VDE$KEPT126A3   01014B2D PR (Local copy)         SYS  NDLW

**************************************************
3.3. OpenVMS Single Process Data
When you double-click a row in the lower part of an OpenVMS Mode Details (Figure 3.7, ''OpenVMS CPU Mode Details Pane''), OpenVMS CPU Process Summary (Figure 3.8, ''OpenVMS CPU Process Summary Pane''), Memory (Figure 3.10, ''OpenVMS Memory Summary''), or I/O (Figure 3.12, ''OpenVMS I/O Summary'') pages, the Data Analyzer displays the first of several OpenVMS Single Process pages.
Alternatively, you can right-click a row and select . The menu item contains three display options, shown in Figure 3.23, ''Single Process Window''.
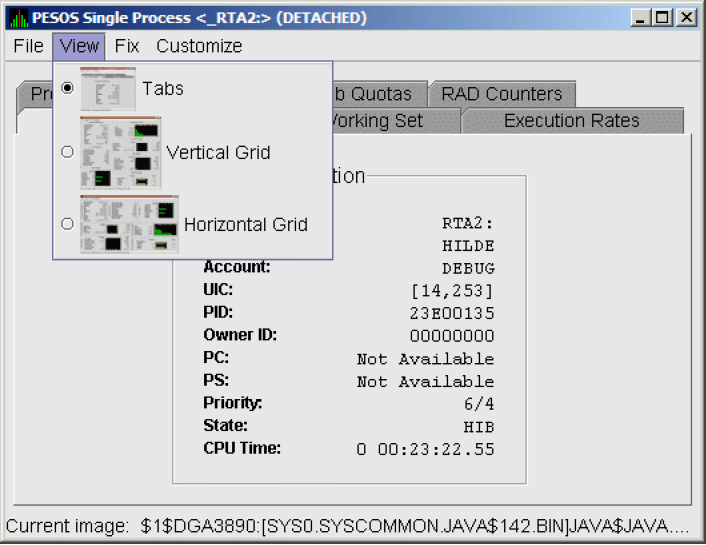
- : individual tabs for each Single Process display:
Process Information
Working Set
Execution Rates
Process Quotas
Wait States
Job Quotas
RAD Counters
: all of the Single Process displays combined in one vertically-oriented grid
: all of the Single Process displays combined in one horizontally-oriented grid
The following sections describe the individual tabs or sections of the vertical or horizontal grids.
Each section refers to the vertical grid display shown in Figure 3.24, ''Single Process Vertical Grid Display''. The status bar displays the current image that the process is running.
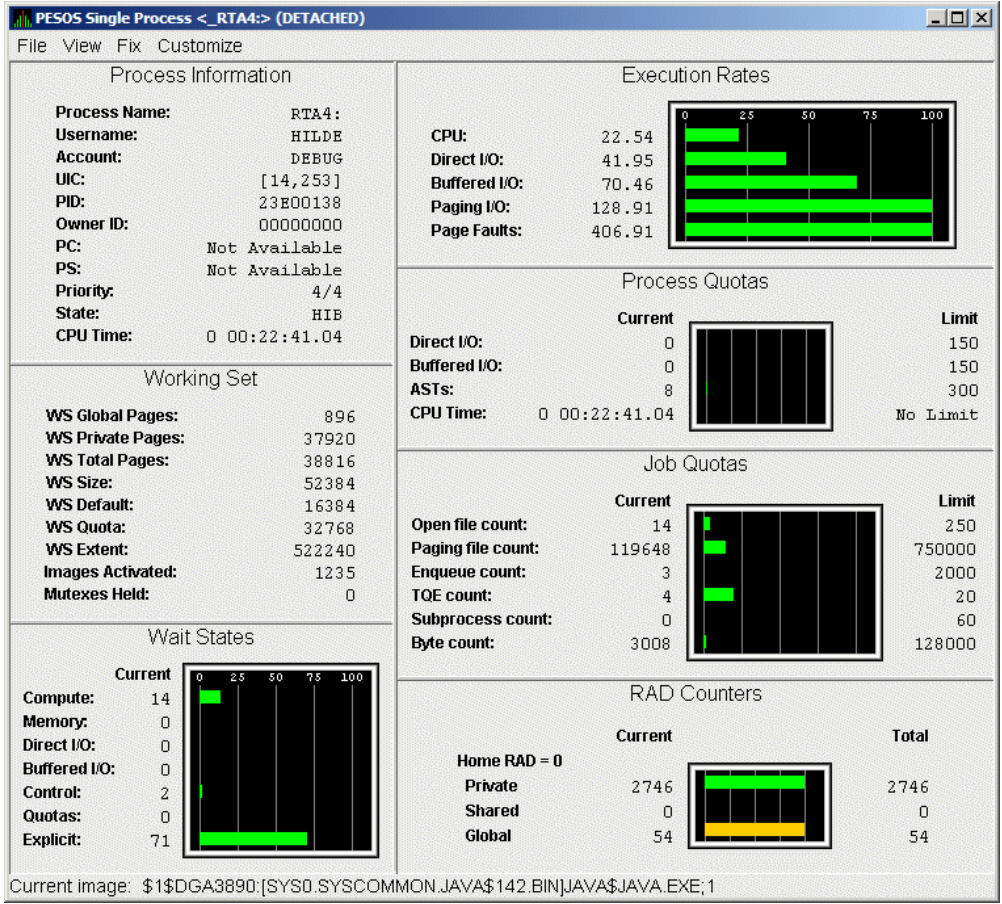
3.3.1. Process Information
Table 3.12, ''Process Information'' describes the Process Information data shown in Figure 3.24, ''Single Process Vertical Grid Display''.
|
Data |
Description |
|---|---|
|
Process name |
Name of the process. |
|
Username |
User name of the user who owns the process. |
|
Account |
Account string that the system manager assigns to the user. |
|
UIC |
User identification code (UIC). A pair of numbers or character strings that designate the group and user. |
|
PID |
Process identifier. A 32-bit value that uniquely identifies a process. |
|
Owner ID |
Process identifier of the process that created the process displayed on the page. If the PID is 0, then the process is a parent process. |
|
PC |
Program counter. On OpenVMS Alpha systems, this value is displayed as 0 because the data is not readily available to the Data Collector node. |
|
PS |
Processor status longword (PSL). This value is displayed on VAX systems only. |
|
Priority |
Computable and base priority of the process. Priority is an integer between 0 and 31. Processes with higher priority are given more CPU time. |
|
State |
One of the process states listed in Appendix B, "CPU Process States". |
|
CPU Time |
CPU time used by the process. |
3.3.2. Working Set
|
Data |
Description |
|---|---|
|
WS Global Pages |
Shared data or code between processes, listed in pages (measured in pagelets). |
|
WS Private Pages |
Amount of accessible memory, listed in pages (measured in pagelets). |
|
WS Total Pages |
Sum of global and private pages (measured in pagelets). |
|
WS Size |
Working set size. The number of pages (measured in pagelets) of memory the process is allowed to use. This value is periodically adjusted by the operating system based on analysis of page faults relative to CPU time used. Increases in large units indicates that a process is taking many page faults, and its memory allocation is increasing. |
|
WS Default |
Working set default. The initial limit of the number of physical pages (measured in pagelets) of memory the process can use. This parameter is listed in the user authorization file (UAF); discrepancies between the UAF value and the displayed value are due to page/longword boundary rounding or other adjustments made by the operating system. |
|
WS Quota |
Working set quota. The maximum amount of physical pages (measured in pagelets) of memory the process can lock into its working set. This parameter is listed in the UAF; discrepancies between the UAF value and the displayed value are due to page/longword boundary rounding or other adjustments made by the operating system. |
|
WS Extent |
Working set extent. The maximum number of physical pages (measured in pagelets) of memory the system will allocate for the process. The system provides memory to a process beyond its quota only when it has an excess of free pages and can be recalled if necessary. This parameter is listed in the UAF; any discrepancies between the UAF value and the displayed value are due to page/longword boundary rounding or other adjustments made by the operating system. |
|
Images Activated |
Number of times an image is activated. |
|
Mutexes Held |
Number of mutual exclusions (mutexes) held. Persistent values other than zero (0) require analysis. A mutex is similar to a lock but is restricted to one CPU. When a process holds a mutex, its priority is temporarily increased to 16. |
3.3.3. Execution Rates
|
Data |
Description |
|---|---|
|
CPU |
Percent of CPU time used by this process. The ratio of CPU time to elapsed time. |
|
Direct I/O |
Rate at which I/O transfers take place from the pages or pagelets containing the process buffer that the system locks in physical memory to the system devices. |
|
Buffered I/O |
Rate at which I/O transfers take place for the process buffer from an intermediate buffer from the system buffer pool. |
|
Paging I/O |
Rate of read attempts necessary to satisfy page faults. This is also known as page read I/O or the hard fault rate. |
|
Page Faults |
Page faults per second for the process. |
3.3.4. Quotas
Table 3.15, ''Quotas'' describes the Process Quotas data shown in Figure 3.24, ''Single Process Vertical Grid Display''.
|
Data |
Description |
|---|---|
|
Direct I/O |
The current number of direct I/Os used compared with the limit possible. |
|
Buffered I/O |
The current number of buffered I/Os used compared with the possible limit. |
|
ASTs |
Asynchronous system traps. The current number of ASTs used compared with the possible limit. |
|
CPU Time |
Amount of time used compared with the possible limit. "No Limit" is displayed if the limit is zero. |
3.3.5. Wait States
Table 3.16, ''Wait States'' describes the Wait States data shown in Figure 3.24, ''Single Process Vertical Grid Display''.
In the graph, Current refers to the percentage of elapsed time each process spends in one of the computed wait states. If a process spends all its time waiting in one state, the total gradually reaches 100%.
How Wait States are Calculated
The wait state specifies why a process cannot execute, based on calculations made on collected data. Each value is calculated over an entire data collection period of approximately 2 minutes. The graph shows, over this period of time, the percentage of time a process spends in each wait state. Each value is an exponential average that approximates a moving average. A more detailed explanation follows.
When monitoring of a single process starts, all wait state values are zero. When the system periodically checks the process, the system first subtracts 10% from each value. It then adds a value of 10 to the wait state the process is currently in, if any.
For example, at the start, if a process is found to be in the Control wait state, the graph immediately registers 10 for Control. If the process is still in the Control wait state the next time it is checked, the graph shows Control at 19. This value is 90% of the original 10 (or 9), plus 10 (the value currently being added).
The next time the process is checked, if it is found to be in the Buffered I/O wait state, Buffered I/O is set to 10 and Control is set to 17 (approximately 90% of the previous value of 19).
The following time the process is checked, if it is not in a wait state at all, Buffered I/O is set to 9 (90% of 10), and Control is set to 15 (90% of 17).
|
Data |
Description |
|---|---|
|
Compute |
Average percentage of time that the process is waiting for CPU time. Possible states are COM, COMO, or RWCAP. |
|
Memory |
Average percentage of time that the process is waiting for a page fault that requires data to be read from disk; this is common during image activation. Possible states are PFW, MWAIT, COLPG, FPG, RWPAG, RWNPG, RWMPE, or RWMPB. |
|
Direct I/O |
Average percentage of time that the process waits for data to be read from or written to a disk or tape. The possible state is DIO. |
|
Buffered I/O |
Average percentage of time that the process waits for data to be read from or written to a slower device such as a terminal, line printer, mailbox, or network traffic. The possible state is BIO. |
|
Control |
Average percentage of time that the process is waiting for another process to release control of some resource. Possible states are CEF, MWAIT, LEF, LEFO, RWAST, RWMBX, RWSCS, RWCLU, RWCSV, RWUNK, or LEF waiting for an ENQ. |
|
Quotas |
Average percentage of time that the process is waiting because the process has exceeded some quota. Possible states are QUOTA or RWAST_QUOTA. |
|
Explicit |
Average percentage of time that the process is waiting because the process asked to wait, such as a hibernate system service. Possible states are HIB, HIBO, SUSP, SUSPO, or LEF waiting for a TQE. |
3.3.6. Job Quotas
|
Data |
Description |
AUTHORIZE Quota |
|---|---|---|
|
Open File Count |
Current number of open files compared with the possible limit. |
FILLM |
|
Paging File Count |
Current number of disk blocks in the page file that the process can use compared with the possible limit. |
PGFLQUOTA |
|
Enqueue Count |
Current number of resources (lock blocks) queued compared with the possible limit. |
ENQLM |
|
TQE Count |
Current number of timer queue entry (TQE) requests compared with the possible limit. |
TQELM |
|
Subprocess Count |
Current number of subprocesses created compared with the possible limit. |
PRCLM |
|
Byte Count |
Current number of bytes used for buffered I/O transfers compared with the possible limit. |
BYTLM |
3.3.7. RAD Counters
|
Data |
Description |
|---|---|
|
Private |
Number of process private pages on RAD 0. |
|
Shared |
Number of process shared pages on RAD 0. |
|
Global |
Number of global pages on RAD 0. |
Chapter 4. Displaying OpenVMS Cluster Data
The Availability Manager Data Analyzer displays data about OpenVMS cluster systems on the Cluster Summary page (see Figure 4.1, ''OpenVMS Cluster Summary''). By expanding a cluster node tree on this page, you can display detailed information about each node in the cluster. This chapter describes the data you can display for OpenVMS clusters.
Managed Objects
The OpenVMS managed objects are operating system components with characteristics that allow the Availability Manager to manage them. Managed objects, which register themselves with the Data Collector at system startup, not only provide data but also implement fixes in response to client requests.
Note
To enable managed object data collection on nodes running OpenVMS Version 7.3 and later, the system manager must take steps so that the Data Collector driver, RMDRIVER, is loaded early in the boot process. For more details on how to enable collection of managed object data, see the VSI Availability Manager Installation Instructions.
LAN Displays
When you monitor OpenVMS Version 7.3 and later nodes with managed objects enabled, additional cluster data and fixes are available for LAN virtual circuits. This data includes enhanced LAN virtual circuit summary data in the Cluster Summary window and the LAN Virtual Circuit Details (NISCA) window. In addition, the Cluster Summary includes virtual circuit, channel, and device fixes. If managed object support is not enabled for a Data Collector node, then only basic virtual circuit data is available.
4.1. OpenVMS Cluster Summary Page
To display the OpenVMS Cluster Summary page (Figure 4.1, ''OpenVMS Cluster Summary''), click the Cluster Summary tab on an OpenVMS Node Summary page (Figure 1.7, ''Sample Node Summary'').
The Cluster Summary page contains cluster interconnect information for an entire cluster as well as detailed information about each node in the cluster, including System Communications Services (SCS) circuits and connections for individual nodes.
The data items shown on this page correspond to data that the Show Cluster utility ($ SHOW CLUSTER) displays for the SYSTEMS, MEMBERS, CONNECTIONS, and CIRCUITS classes. No SHOW CLUSTER counterpart exists for the PEDRIVER LAN virtual circuit, channel, and device detail displays. The data items shown on the page also correspond to data that the SCACP utility displays for SHOW commands that display PORT, CIRCUIT, VC, CHANNEL, and LAN DEVICE information.
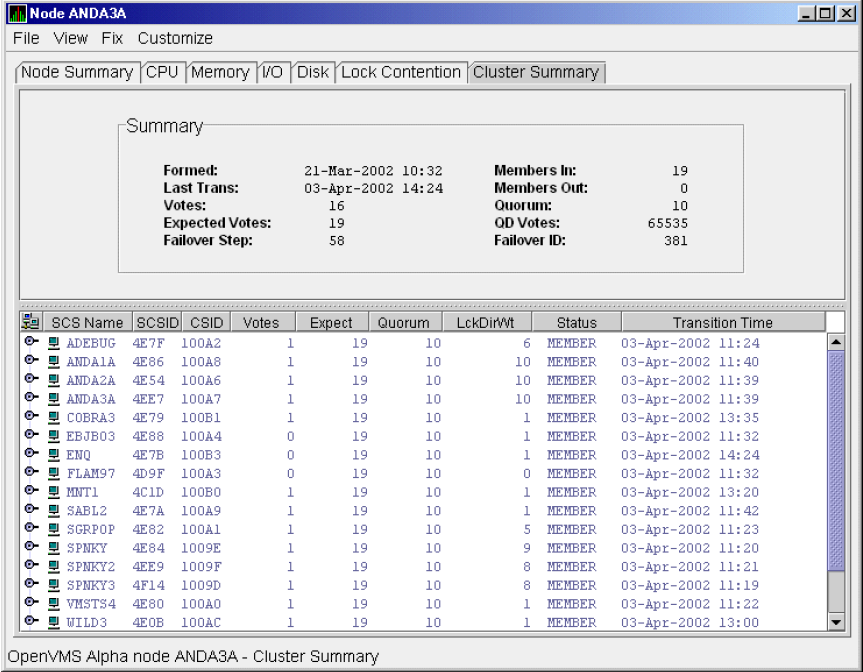
The Summary pane displays summary information about the entire cluster.
The Cluster Members pane displays detailed information about each node in the cluster, including its System Communication Architecture (SCA) connections with other nodes.
4.1.1. OpenVMS Cluster Event
LOVOTE, 'node' VOTES count is close to or below QUORUM
4.1.2. OpenVMS Cluster Summary Pane
|
Data |
Description |
|---|---|
|
Formed |
Date and time the cluster was formed. |
|
Last Trans |
Date and time of the most recent cluster state transition. |
|
Votes |
Total number of quorum votes being contributed by all cluster members and by the quorum disk. |
|
Expected Votes |
The expected votes contribution by all members of the cluster. This value is calculated from the maximum EXPECTED_VOTES system parameter and the maximized value of the VOTES system parameter. |
|
Failover Step |
Current failover step index. Shows which step in the sequence of failover steps the failover is currently executing. |
|
Members In |
Number of cluster members to which the Data Analyzer has a connection. |
|
Members Out |
Number of cluster members to which the Data Analyzer either has no connection or has lost its connection. |
|
Quorum? |
Number of votes that must be present for the cluster to function and to permit user activity, that is, to "maintain cluster quorum." |
|
QD Votes |
Number of votes given to the quorum disk. A value of 65535 means no quorum disk exists. |
|
Failover ID |
Failover instance identification. Unique ID of a failover sequence that indicates to system managers whether a failover has occurred since the last time they checked. |
4.1.3. OpenVMS Cluster Members Pane
The Cluster Members pane (the lower pane on the Cluster Summary page in Figure 4.1, ''OpenVMS Cluster Summary'') lists all the nodes in the cluster and provides detailed information about each one. Figure 4.2, ''OpenVMS Cluster Members Pane'' shows only the Cluster Members pane.
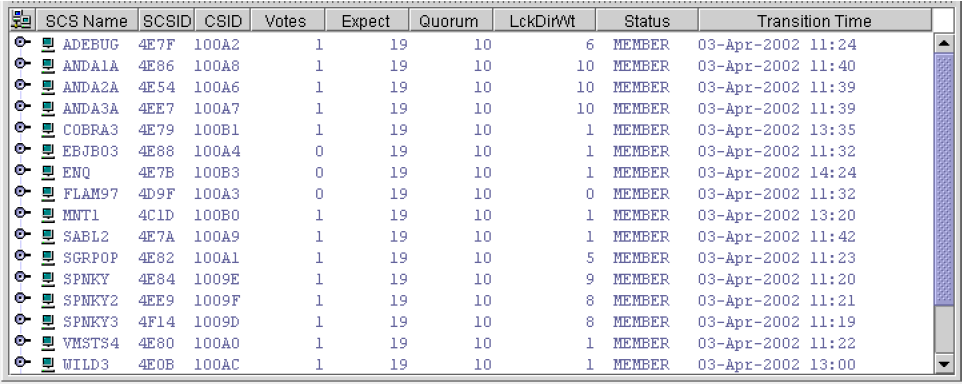
|
Data |
Description | |
|---|---|---|
|
SCS Name |
System Communications Services (SCS) name for the node (system parameter SCSNODE). | |
|
SCSID |
SCS identification for the node (system parameter SCSYSTEMID). | |
|
CSID |
Cluster system identification. | |
|
Votes |
Number of votes the member contributes. | |
|
Expect |
Member's expected votes as set by the EXPECTED_VOTES system parameter. | |
|
Quorum |
Number of votes that must be present for the cluster to function and permit user activity, that is, to the votes needed to "maintain cluster quorum". | |
|
LckDirWt |
Lock manager distributed directory weight as determined by the LCKDIRWT system parameter. | |
|
Status |
Current cluster member status: | |
|
Status Value |
Description | |
|
NEW |
New system in cluster. | |
|
BRK_NEW |
New system; there has been a break in the connection. | |
|
MEMBER |
System is a member of the cluster. | |
|
BRK_MEM |
Member; there has been a break in the connection. | |
|
NON |
System is not a member of the cluster. | |
|
BRK_NON |
Nonmember; there has been a break in the connection. | |
|
REMOVED |
System has been removed from the cluster. | |
|
BRK_REM |
System has been removed from the cluster, and there has also been a break in the connection. | |
|
Transition Time |
The time of the system's last change in cluster membership status. | |
4.2. Summary Data in the Cluster Members Pane
The following sections contain descriptions of the categories of summary data displayed in the Cluster Members pane (Figure 4.2, ''OpenVMS Cluster Members Pane'').
When you click the handle before an SCS (System Communications Services) Name, the Data Analyzer first displays a Ports heading, if managed object data collection is enabled on this SCS node.
A port is an OpenVMS device that provide SCA (System Communications Architecture) services. Port summary data is discussed in Section 4.2.1, ''Port Summary Data ''. Below the Ports heading is the Circuits heading, which precedes a line of SCA headings. (SCA data is discussed in Section 4.2.2, ''SCA (System Communications Architecture) Summary Data''.)
4.2.1. Port Summary Data
When you initially click the handle in front of Ports in the Cluster Members pane (Figure 4.1, ''OpenVMS Cluster Summary'') to a vertical position, Ports headings are displayed, with information about port interfaces on the local system, as shown in Figure 4.3, ''Port Summary Data''.
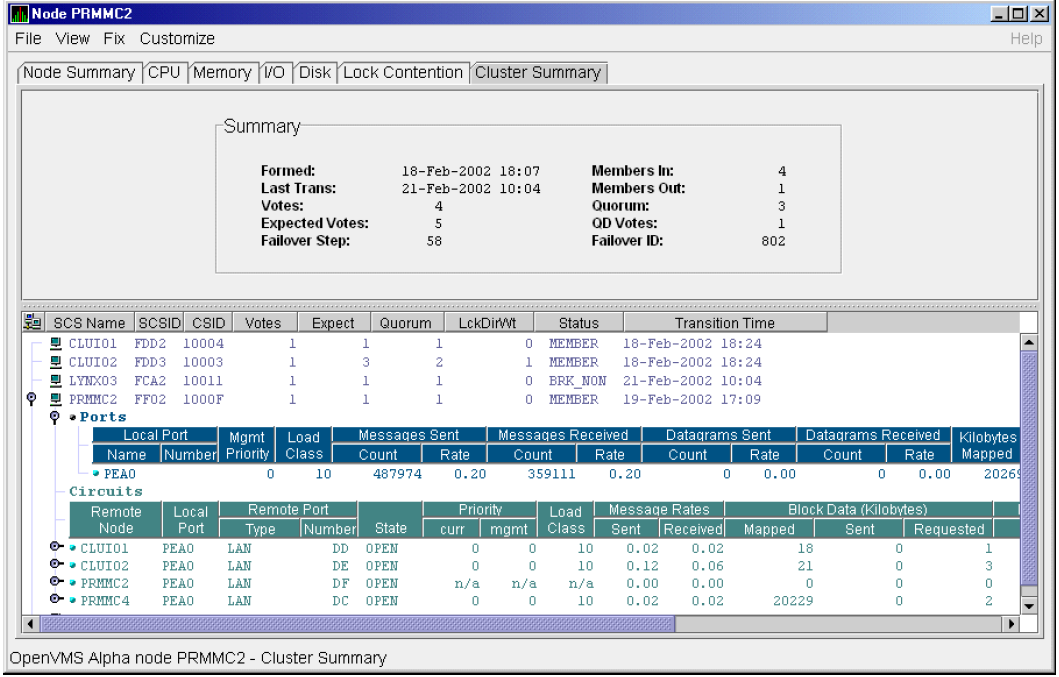
|
Data |
Description | |
|---|---|---|
|
Local Port: | ||
|
Name |
Device name of the port. | |
|
Number |
The local port's interconnect address or other interconnect-specific identifier. | |
|
Mgmt Priority |
Management priority assigned to the port. | |
|
Load Class |
Hard-coded capacity value of the port, based on the rate (in megabits/second) of the interconnect of the port. | |
|
Messages Sent: | ||
|
Count |
Total number of messages sent since the port was initialized. | |
|
Rate |
Rate at which messages are sent (per second). | |
|
Messages Received: | ||
|
Count |
Total number of messages sent since the port was initialized. | |
|
Rate |
Rate at which SCS messages are received (per second). | |
|
Datagrams Sent: | ||
|
Count |
Total number of SCS datagrams sent since the port was initialized. | |
|
Rate |
Rate at which SCS datagrams are sent (per second). | |
|
Datagrams Received: | ||
|
Count |
Total number of SCS datagrams sent since the port was initialized. | |
|
Rate |
Rate at which SCS datagrams are sent (per second). | |
|
Kilobytes Mapped |
Number of kilobytes mapped for block transfer. | |
4.2.2. SCA (System Communications Architecture) Summary Data
Below the Circuits heading in Figure 4.4, ''SCA Summary Data'' is a line of SCA summary headings that include information about a node's SCS circuits between local SCA ports and remote SCA ports on other nodes in the cluster. More than one circuit indicates more than one communications path to the other node.
The data displayed in Figure 4.4, ''SCA Summary Data'' is similar to the information that the Show Cluster utility ($ SHOW CLUSTER) displays for the CIRCUITS, CONNECTIONS, and COUNTERS classes and that the SCACP utility's SHOW CIRCUITS command displays. Note that circuit count is the total number of events since the state of the circuit changed to OPEN.
The Circuits display also shows circuits to non-OpenVMS nodes, such as storage controllers.
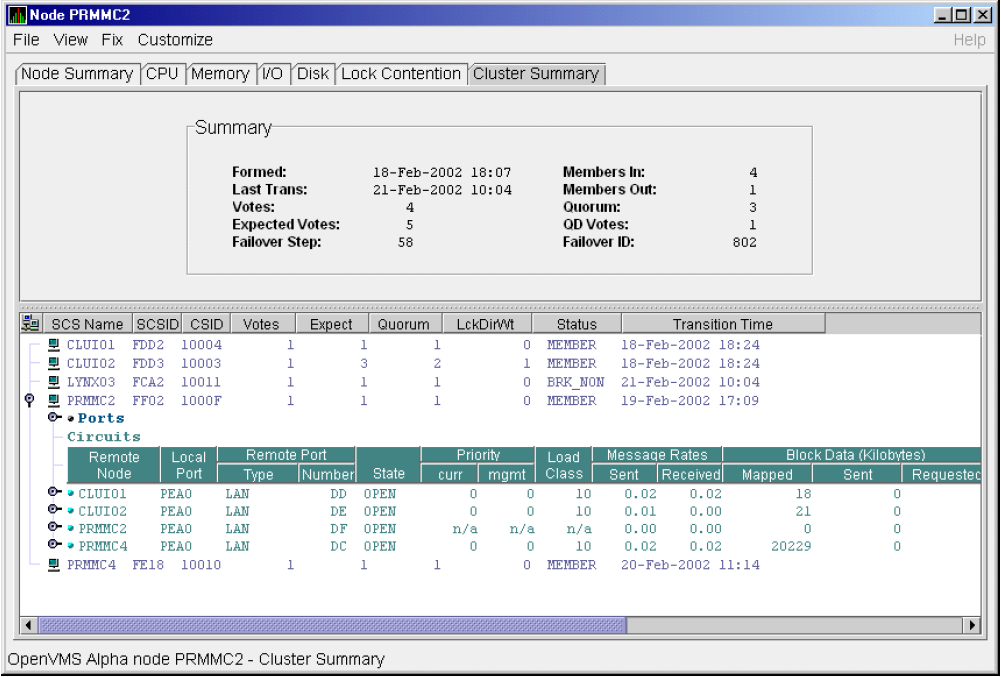
Table 4.4, ''SCA Summary Data'' describes the SCA summary data displayed under the Circuits heading in Figure 4.4, ''SCA Summary Data''. Each line of data shows either a summary of an SCS connection between a local system connection of an application (or SYSAP) to a remote SYSAP that uses the circuit, or a summary of interconnect-specific information about the operation of the circuit.
Note
Each rate referred to in Figure 4.4, ''SCA Summary Data'' is in messages per second. The "Message Rates" data are rates; the remaining data items are counts.
|
Data |
Description | |
|---|---|---|
|
Remote Node |
SCS name of the remote node containing the remote port of the circuit. | |
|
Local Port |
The device name of the local port associated with the circuit. | |
|
Remote Port: | ||
|
Type |
The remote port's device or interconnect type associated with the circuit (for example, LAN, CIPCA, DSSI). | |
|
Number |
The remote port's interconnect address, or another other interconnect-specific unique identifier. | |
|
State |
The state of the virtual circuit connection. | |
|
Priority: | ||
|
Curr |
Circuit's current priority, which is the sum of the management priorities assigned to the circuit and associated local port. | |
|
Mgmt |
Priority value assigned to the circuit by management action. | |
|
Load Class |
The circuit's current capacity rating, derived from the current ECS member's load class values. | |
|
Message Rates: | ||
|
Sent |
Count/rate of SCS messages sent over the circuit. | |
|
Received |
Count/rate that SCS messages are received on the circuit. | |
|
Block Data (Kilobytes): | ||
|
Mapped |
Count/rate of kilobytes mapped for block data transfers over the circuit. | |
|
Sent |
Count/rate of kilobytes sent over the circuit using transfers. | |
|
Requested |
Count/rate of kilobytes requested from the remote port over the circuit using request block data transfers. | |
|
Block Data (Count): | ||
|
Sent |
Count/rate of send block data transfers over the circuit. | |
|
Requested |
Count/rate of block data transfer requests sent over the circuit. | |
|
Datagrams: | ||
|
Sent |
Count/rate of SCS datagrams sent over the circuit. | |
|
Received |
Count/rate of SCS datagrams received on the circuit. | |
|
Credit Wait |
Count/rate any connection on the circuit had to wait for a send credit. | |
|
Buff Desc Wait |
Count/rate any connection over the circuit had to wait for a buffer descriptor. | |
4.2.3. SCS (System Communications Services) Connections Summary Data
SCS Connections
LAN Virtual Circuit Summary
To display SCS connections summary data, click the handle at the beginning of the SCS Connections row on the Cluster Summary pane (Figure 4.1, ''OpenVMS Cluster Summary''). Figure 4.5, ''SCS Connections Data'' displays SCS Connections data information.
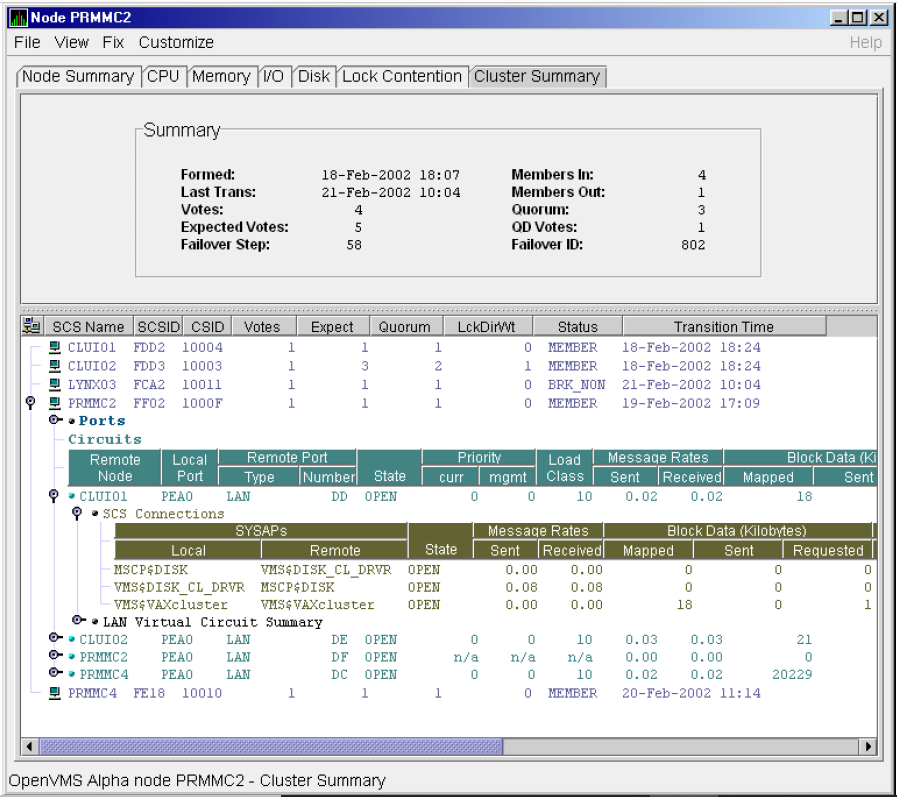
Table 4.5, ''SCS Connections Data'' describes the SCS connections data shown in Figure 4.5, ''SCS Connections Data''. Some of the data described in Table 4.5, ''SCS Connections Data'' is not displayed in Figure 4.5, ''SCS Connections Data'' because the screen display is wider than shown. You can move the scroll bar to the right to display the remaining fields described in the table.
|
Data |
Description | |
|---|---|---|
|
SYSAPs: | ||
|
Local |
Name of the SYSAP (system application) on the local system associated with the connection. | |
|
Remote |
Name of the SYSAP on the remote system associated with the connection. | |
|
State |
The connection's current state. The possible items displayed are:
| |
|
Message Rates: | ||
|
Sent |
Count/rate that SCS messages are sent over the connection. | |
|
Received |
Count/rate that SCS messages are being received on the connection. | |
|
Block Data (Kilobytes): | ||
|
Mapped |
Count/rate of kilobytes mapped for block data transfers by the local SYSAP using the connection. Note: This field is available only in raw data format. | |
|
Sent |
Number of kilobytes sent over the SCS connection by the local SYSAP using send block data transfers. | |
|
Requested |
Number of kilobytes requested over the SCS connection by the local SYSAP using request block data transfers. | |
|
Block Data (Number): | ||
|
Sent |
Count/Rate of send block data transfers by this node over the SCS connection. | |
|
Requested |
Count/Rate of request block data transfers sent to the remote port over the SCS connection. | |
|
Datagrams: | ||
|
Sent |
Count/Rate of datagrams sent on the SCS connection. | |
|
Received |
Count/Rate of datagrams received on the SCS connection. | |
|
Credit Wait |
Count/Rate of times the connection had to wait for a send credit. | |
|
Buff Desc Wait |
Count/Rate of times the connection had to wait for a buffer descriptor. | |
4.2.4. LAN Virtual Circuit Summary Data
You can display interconnect-specific LAN virtual circuit summary data by clicking the handle at the beginning of a LAN Virtual Circuit Summary row to a vertical position. The screen expands to display the interconnect-specific VC summary data shown in Figure 4.6, ''LAN Virtual Circuit Summary Data''.
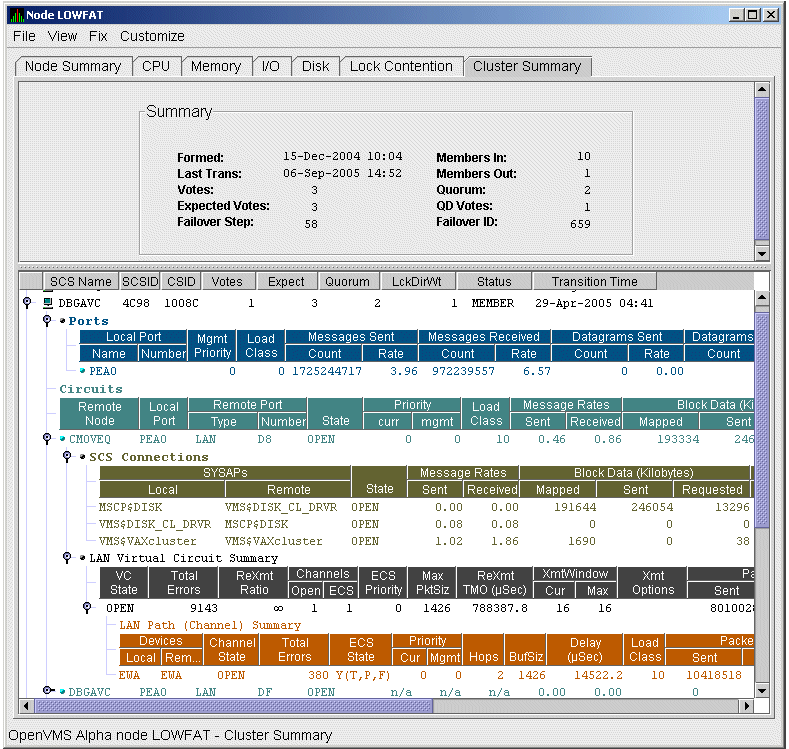
Much of the data in this display corresponds to the information displayed by the SCACP command SHOW VC. The SHOW CLUSTER command does not provide a corresponding display. Which data items are displayed depends on the type of interconnect the virtual circuit is using.
Currently, this feature is available only for LAN virtual circuits. VC Summary displays for other cluster interconnects such as CI might be available in the future. When other interconnects are supported, the interconnect type will be displayed at the beginning of the line – for example, CI Virtual Circuit Summary – and the associated heading will have interconnect-specific data items.
Note that LAN Virtual Circuit counters are initialized when PEDRIVER detects the existence of a PEDRIVER on a remote system. All of a LAN VC's counters are cumulative from that time.
Some of the data described in Table 4.6, ''LAN Virtual Circuit Summary Data'' is not displayed in Figure 4.6, ''LAN Virtual Circuit Summary Data'' because the screen display is wider than shown. You can move the scroll bar to the right to display the remaining fields described in the table.
|
Data |
Description | |
|---|---|---|
|
VC State |
Current internal state of the virtual circuit:
| |
|
Total Errors |
Number of times the virtual circuit has been closed or has had other errors. | |
|
ReXmt Ratio |
Ratio of total numbers of transmitted to retransmitted packets during the most recent data collection interval. | |
|
Channels: | ||
|
Open |
Number of currently open channels available to the virtual circuit. | |
|
ECS |
Number of equivalent channel set (ECS) channels currently in use by the LAN virtual circuit. | |
|
ECS Priority |
Priority a channel must have in order to be included in the Equivalent channel set (ECS). It is the highest priority any open and tight channel has. See ECS State in Table 4.7, ''LAN Path (Channel) Data'' for an explanation of a tight channel. | |
|
MaxPktSiz |
Maximum data buffer size in use by this LAN virtual circuit. | |
|
ReXmt TMO (microsec) |
Retransmission timeout, in microseconds. The length of time the virtual circuit is currently using to wait for an acknowledgment of the receipt of a packet before retransmitting that packet. | |
|
XmtWindow: | ||
|
Cur |
Current value of the transmit window (or pipe quota). Maximum number of packets that are sent before stopping to await an acknowledgment. After a timeout, the transmit window is reset to 1 to decrease congestion; it is allowed to increase as acknowledgments are received. | |
|
Max |
Maximum transmit window size currently allowed for the virtual circuit. | |
|
Xmt Options |
Transmit options enabled:
| |
|
Packets: | ||
|
Sent |
Number of packets sent over this virtual circuit. | |
|
Received |
Number of packets received over this virtual circuit. | |
|
Most recent: | ||
|
Time Opened |
Most recent time the virtual circuit was opened. | |
|
Time Closed |
Most recent time the virtual circuit was closed. | |
4.2.5. LAN Path (Channel) Summary Data
A LAN path or channel is a logical communication path between two LAN devices. Channels between nodes are determined by a local device, a remote device, and the connecting network. For example, two nodes, each having two devices, might establish four channels between the nodes. The packets that a particular LAN virtual circuit carries can be sent over any open channel connecting the two nodes.
The difference between channels and virtual circuits is that channels provide datagram service. Virtual circuits, layered on channels, provide error-free paths between nodes. Multiple channels can exist between nodes in an OpenVMS Cluster system, but only one LAN-based virtual circuit can exist between any two nodes at a time.
LAN channel counters are initialized when PEDRIVER detects the existence of a LAN device on a remote system. All of a LAN channel counters are cumulative from that time. For more information about channels and virtual circuits, see the VSI OpenVMS Cluster Systems manual.
Displaying Data
You can display LAN channel summary data by clicking the handle at the beginning of a LAN Virtual Circuit Summary Data row (Figure 4.6, ''LAN Virtual Circuit Summary Data''), or by right-clicking a data item and choosing the item from the shortcut menu. The screen expands to display the LAN channel summary data shown in Figure 4.6, ''LAN Virtual Circuit Summary Data''. If there is no handle at the beginning of a "LAN Virtual Circuit Summary" data row, then managed object data collection is not enabled for this SCS node.
The data items displayed depend on the type of virtual circuit. Currently, this feature is available only for LAN virtual circuits.
|
Data |
Description | |
|---|---|---|
|
Devices: | ||
|
Local |
Local LAN device associated with the channel. | |
|
Remote |
Remote LAN device associated with the channel. | |
|
Channel State |
One of the following states:
| |
|
Total Errors |
Total of various error counters for this channel (see channel details for breakdown). | |
|
ECS State |
Channel ECS membership information:
Losses – one of the following:
Capacity – one of the following:
Speed – one of the following:
Note: If a channel is lossy, its capacity and speed are not always kept current. Therefore, displayed values might be those that the channel had at the time it become lossy. | |
|
Priority: | ||
|
Cur |
Current priority used to evaluate the channel for ECS membership. This is the sum of management priority values assigned to the LAN device. | |
|
Mgmt |
Dynamic management-assigned priority. | |
|
Hops |
Number of switches or bridges in this channel's network path to the remote LAN device. | |
|
BufSiz |
Current maximum amount of SCS data that can be contained in a packet sent over the
channel. It is the smallest of the following values:
| |
|
Delay (microsec) |
Running average of measured round-trip time, in microseconds, for packets sent over the channel. | |
|
Load Class |
Load class initialized from local and remote LAN device bit rates. | |
|
Packets: | ||
|
Sent |
Number of packets sent on this channel, including control packets. | |
|
Received |
Number of packets received by this channel. | |
|
Most recent: | ||
|
Time Opened |
Last time this channel had a verified usable path to a remote system. | |
|
Time Closed |
Time that this channel was last closed. | |
4.3. Detailed Data Accessed Through the Cluster Members Pane
The following sections describe data that appears on lines that you can open in the Cluster Members pane (Figure 4.2, ''OpenVMS Cluster Members Pane'').
4.3.1. LAN Device Summary Data
SCA Summary
LAN Device Summary...
Click to display the Device Summary Data page (Figure 4.7, ''LAN Device Summary Data'').
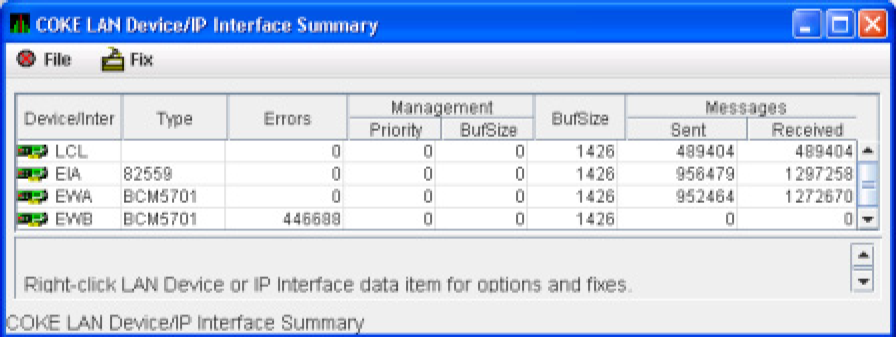
You can right-click any data item on the page to display a menu with on it. These fixes are explained in Chapter 6, "Performing Fixes on OpenVMS Nodes".
|
Data |
Description | |
|---|---|---|
|
LAN Device |
Name of the LAN device used for cluster communications between local and remote nodes. The icon preceding each LAN device can be one of the following colors:
A tooltip indicates the possible states a device can be in. This can be a combination of the following: Run, Online, Local, Hello_Busy, Build_Hello, Init, Wait_Mgmt, Wait_Evnt, Broken, XChain_Disabled, Delete_pend, Restart, or Restart_Delay. Alternatively, a tooltip might display "Not in use by SCA." | |
|
Type |
Type of LAN device used for the cluster. | |
|
Errors |
Number of errors reported by the device since cluster communications began using it. | |
|
Management: | ||
|
Priority |
Current management-assigned priority of the device. | |
|
BufSize |
Current management-assigned maximum buffer size of the device | |
|
BufSize |
Smaller of interconnect specific buffer size of the device and its current management-assigned buffer size. | |
|
Messages: | ||
|
Sent |
Number of LAN packets sent by the device. | |
|
Received |
Number of packets received from remote LAN device. | |
4.3.2. LAN Device Detail Data
To display LAN device detail data, right-click a LAN Path (Channel) Summary data item on the LAN Virtual Circuit Summary data page (Figure 4.6, ''LAN Virtual Circuit Summary Data''). The Data Analyzer then displays the shortcut menu shown in Figure 4.8, ''LAN Path (Channel) Details Menu''.
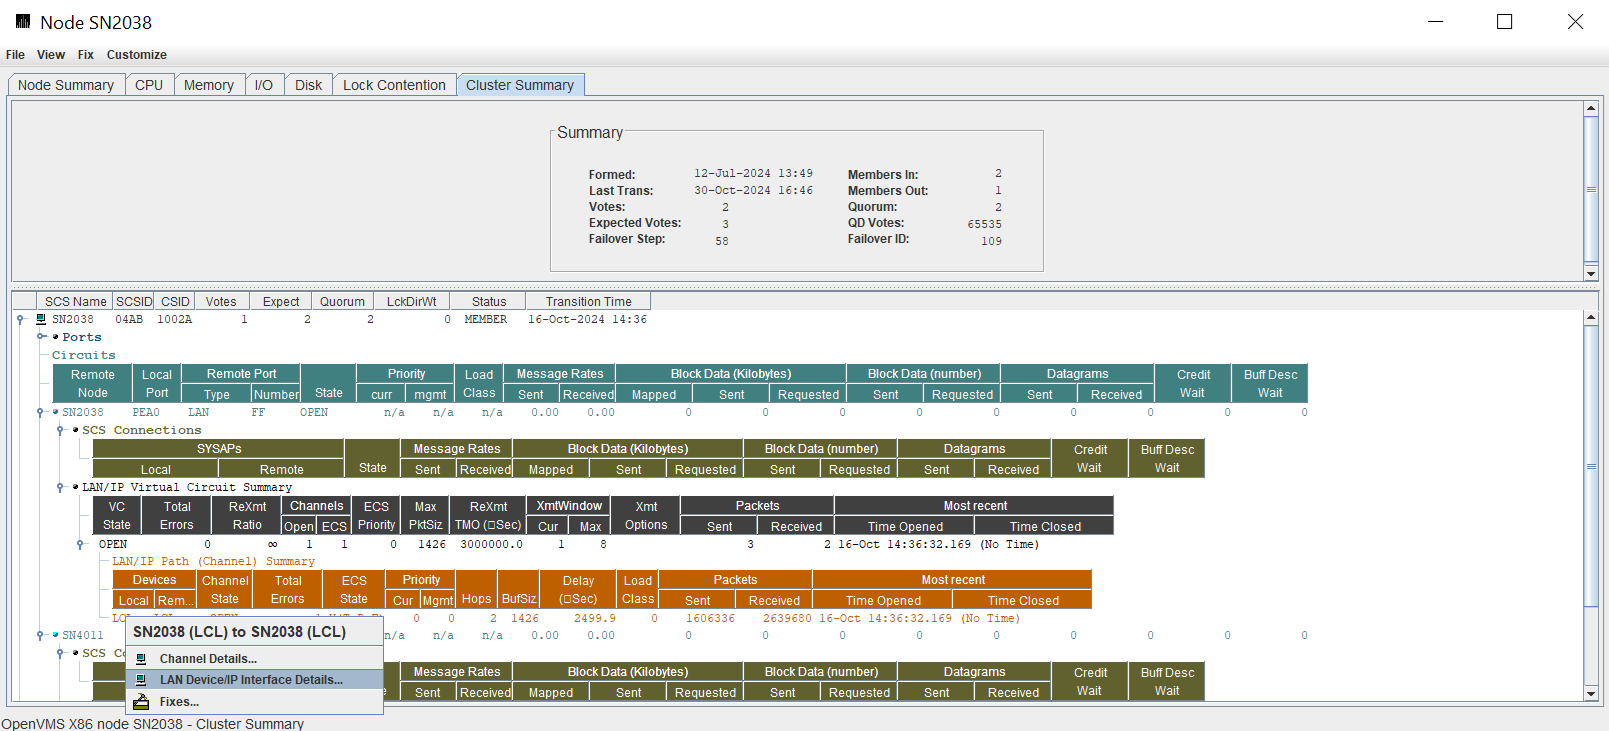 |
To display device details, select the item on the menu. After a brief delay, a LAN Device Overview Data page (Figure 4.9, ''LAN Device Overview Data'') is displayed.
A series of tabs at the top of the LAN Device Overview Data page indicate additional LAN device pages that you can display. Much of the LAN device detail data corresponds to data displayed by the SCACP command SHOW LAN_DEVICE.
4.3.2.1. LAN Device Overview Data
The LAN Device Overview Data page (Figure 4.9, ''LAN Device Overview Data'') displays LAN device summary data.
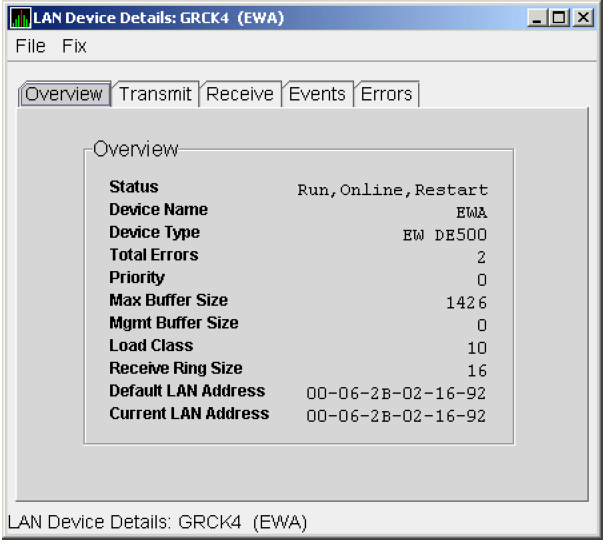
|
Data |
Description |
|---|---|
|
Status |
Device status: Run, Online, Local, Hello_Busy, Build_Hello, Init, Wait_Mgmt, Wait_Evnt, Broken, XChain_Disabled, Delete_pend, Restart, or Restart_Delay. Alternatively, "Not in use by SCA" can be displayed. |
|
Device Name |
Name of the LAN device. |
|
Device Type |
OpenVMS device type value. |
|
Total Errors |
Total number of errors listed on the Errors page. |
|
Priority |
Dynamic management-assigned priority. |
|
Max Buffer Size |
Maximum data buffer size for this LAN device. |
|
Mgmt Buffer Size |
Dynamic management-assigned maximum block data field size. |
|
Load Class |
Load class. The rate in MBs currently being reported by the LAN device. |
|
Receive Ring Size |
Number of packets the LAN device can buffer before it discards incoming packets. |
|
Default LAN Address |
LAN device's hardware LAN address. |
|
Current LAN Address |
Current LAN address being used by this LAN device. |
4.3.2.2. LAN Device Transmit Data
The LAN Device Transmit Data page (Figure 4.10, ''LAN Device Transmit Data'') displays LAN device transmit data.
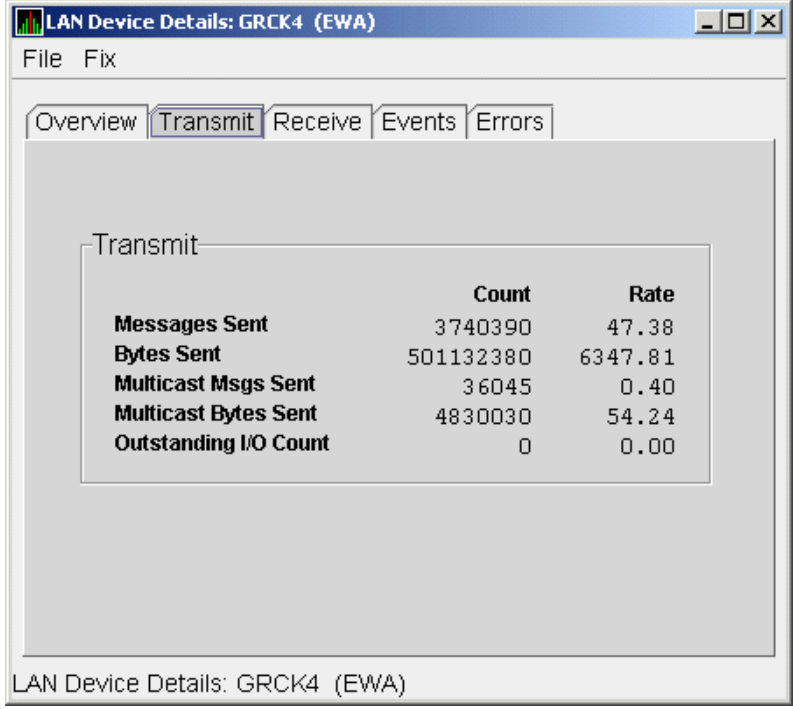
|
Data |
Description |
|---|---|
|
Messages Sent |
Number of packets sent by this bus, including multicast "Hello" packets. |
|
Bytes Sent |
Number of bytes in packets sent by this LAN device, including multicast "Hello" packets. |
|
Multicast Msgs Sent |
Number of multicast "Hello" packets sent by this LAN device. |
|
Multicast Bytes Sent |
Number of multicast bytes in "Hello" packets sent by this LAN device. |
|
Outstanding I/O Count |
Number of transmit requests being processed by LAN driver. |
4.3.2.3. LAN Device Receive Data
The LAN Device Receive Data page (Figure 4.11, ''LAN Device Receive Data'') displays LAN device receive data.
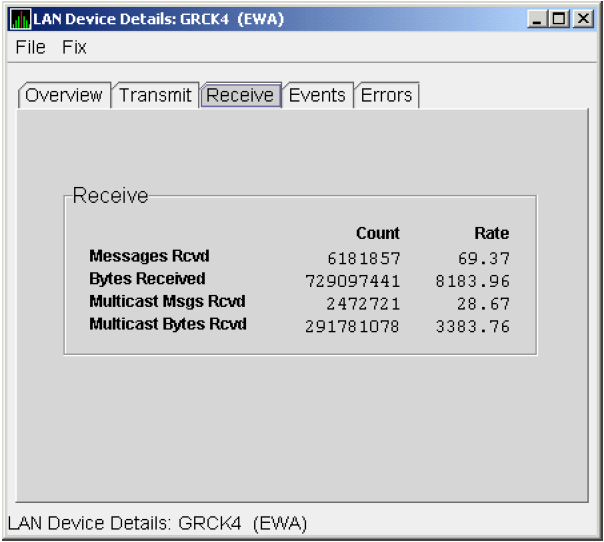
|
Data |
Description |
|---|---|
|
Messages Rcvd |
Number of packets received by this LAN device, including multicast packets. |
|
Bytes Received |
Number of bytes in packets received by this LAN device, including multicast packets. |
|
Multicast Msgs Rcvd |
Number of multicast NISCA packets received by this LAN device. |
|
Multicast Bytes Rcvd |
Number of multicast bytes received by this LAN device. |
4.3.2.4. LAN Device Events Data
The LAN Device Events Data page (Figure 4.12, ''LAN Device Events Data'') displays LAN device events data.
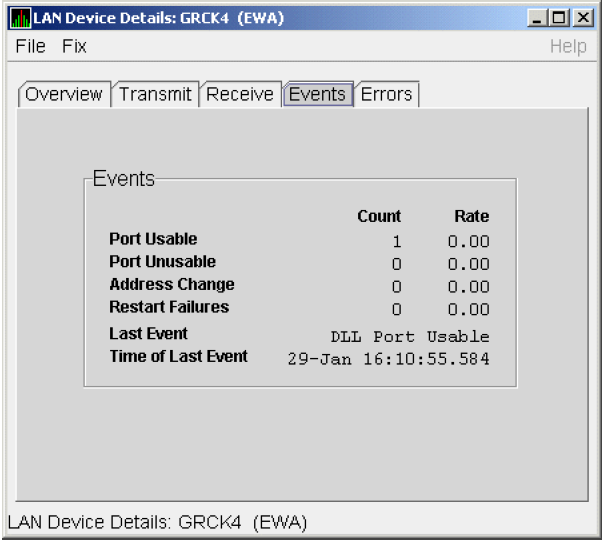
|
Data |
Description |
|---|---|
|
Port Usable |
Number of times the LAN device became usable. |
|
Port Unusable |
Number of times the LAN device became unusable. |
|
Address Change |
Number of times the LAN device's LAN address changed. |
|
Restart Failures |
Number of times the LAN device failed to restart. |
|
Last Event |
Event type of the last LAN device event (for example, LAN address change, an error, and so on). |
|
Time of Last Event |
Time the last event occurred. |
4.3.2.5. LAN Device Errors Data
The LAN Device Errors Data page (Figure 4.13, ''LAN Device Errors Data'') displays LAN device errors data.
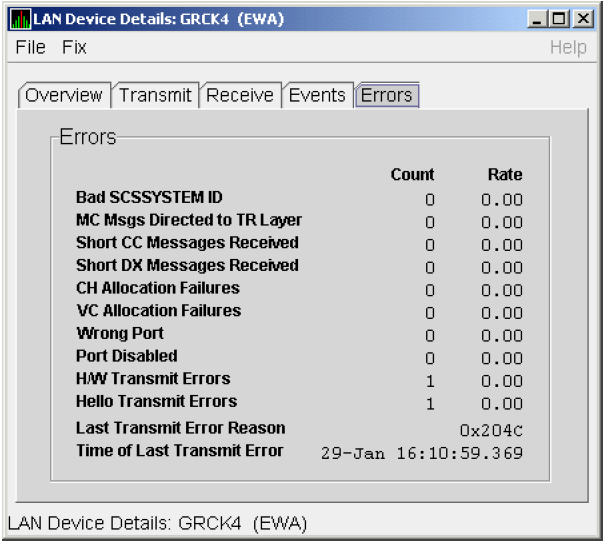
|
Data |
Description |
|---|---|
|
Bad SCSSYSTEM ID |
Received a packet with the wrong SCSSYSTEM ID in it. |
|
MC Msgs Directed to TR Layer |
Number of multicast packets directed to the NISCA Transport layer. |
|
Short CC Messages Received |
Number of packets received that were too short to contain a NISCA channel control header. |
|
Short DX Messages Received |
Number of packets received that were too short to contain a NISCA DX header. |
|
CH Allocation Failures |
Number of times the system failed to allocate memory for use as a channel structure in response to a packet received by this LAN device. |
|
VC Allocation Failures |
Number of times the system failed to allocate memory for use as a VC structure in response to a packet received by this LAN device. |
|
Wrong Port |
Number of packets addressed to the wrong NISCA address. |
|
Port Disabled |
Number of packets discarded because the LAN device was disabled. |
|
H/W Transmit Errors |
Number of local hardware transmit errors. |
|
Hello Transmit Errors |
Number of transmit errors during HELLOs. |
|
Last Transmit Error Reason |
Reason for last transmit error. |
|
Time of Last Transmit Error |
Time of last transmit error: date and time. |
4.3.3. LAN Path (Channel) Detail Data
To display LAN path (channel) detail data, right-click a LAN channel summary data item on the Cluster Summary page (Figure 4.6, ''LAN Virtual Circuit Summary Data''). The Data Analyzer displays a shortcut menu with the options shown in Figure 4.8, ''LAN Path (Channel) Details Menu''.
To display LAN channel details, select the item on the menu. After a brief delay, a LAN Channel Overview Data page (Figure 4.14, ''LAN Channel Overview Data'') is displayed. A series of tabs at the top of this page indicate additional channel pages that you can display.
4.3.3.1. LAN Channel Overview Data
The LAN Channel Overview Data page (Figure 4.14, ''LAN Channel Overview Data'') displays general channel data, including the state, status, and total errors of the channel.
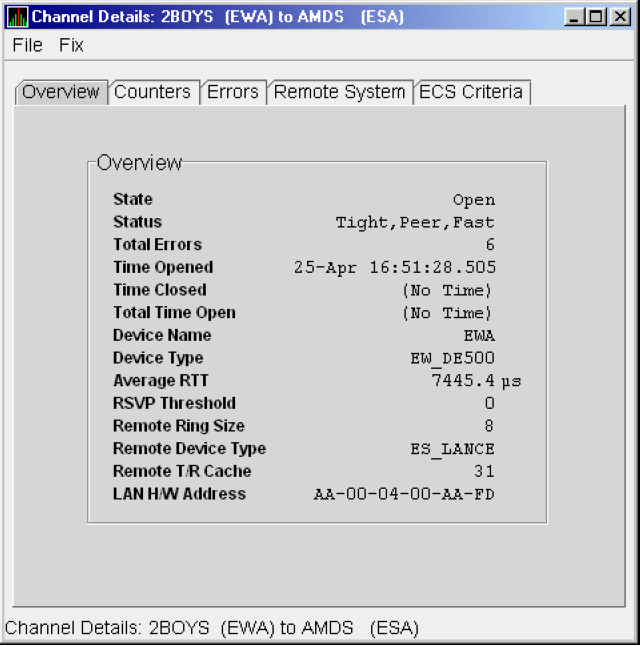
|
Data |
Description |
|---|---|
|
State |
Channel's current state: OPEN, PATH, or CLOSED. |
|
Status |
Channel status. |
|
Total Errors |
Sum of channel's error counters. |
|
Time Opened |
Last time that this channel had a path to a remote system. |
|
Time Closed |
Last time that this channel was closed. |
|
Total Time Open |
Total time that this channel has been open. |
|
Device Name |
Local LAN device name. |
|
Device Type |
Local LAN device type. |
|
Average RTT |
Average of measured round-trip time. |
|
RSVP Threshold |
Number of packets before requesting that the remote node immediately return an acknowledgment. |
|
Remote Ring Size |
Number of entries in the remote LAN device. |
|
Remote Device Type |
Remote LAN device type. |
|
Remote T/R Cache |
Number of out-of-order packets that the remote transmit/receive resequencing cache can buffer. |
|
LAN H/W Address |
LAN device's hardware address. |
4.3.3.2. LAN Channel Counters Data
The LAN Channel Counters Data page (Figure 4.15, ''LAN Channel Counters Data'') displays path counters data, including ECS transitions as well as messages and bytes sent.
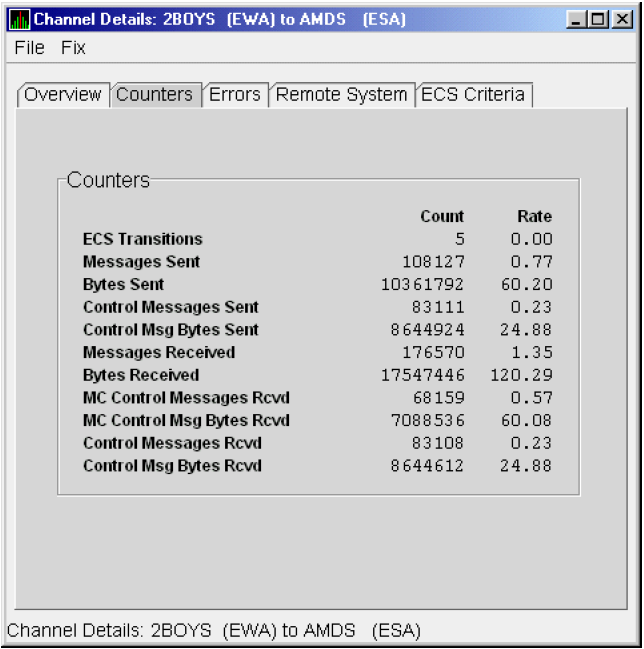
|
Data |
Description |
|---|---|
|
ECS Transitions |
Number of times this channel has been in and out of the equivalent channel set (ECS). |
|
Messages Sent |
Number of packets sent over this channel, including control packets. |
|
Bytes Sent |
Number of bytes transmitted on this channel, including control packets. |
|
Control Messages Sent |
Number of control packets sent, not including multicast packets. |
|
Control Msg Bytes Sent |
Number of control packet bytes sent, not including multicast packets. |
|
Messages Received |
Number of packets received by this channel. |
|
Bytes Received |
Number of bytes in packets received by this channel. |
|
MC Control Messages Rcvd |
Number of multicast control packets received. |
|
MC Control Msg Bytes Rcvd |
Number of multicast control packets bytes received. |
|
Control Messages Rcvd |
Number of control packets received. |
|
Control Msg Bytes Rcvd |
Number of control packet bytes received. |
4.3.3.3. LAN Channel Errors Data
The LAN Channel Errors Data page (Figure 4.16, ''LAN Channel Errors Data'') displays LAN channel errors data.
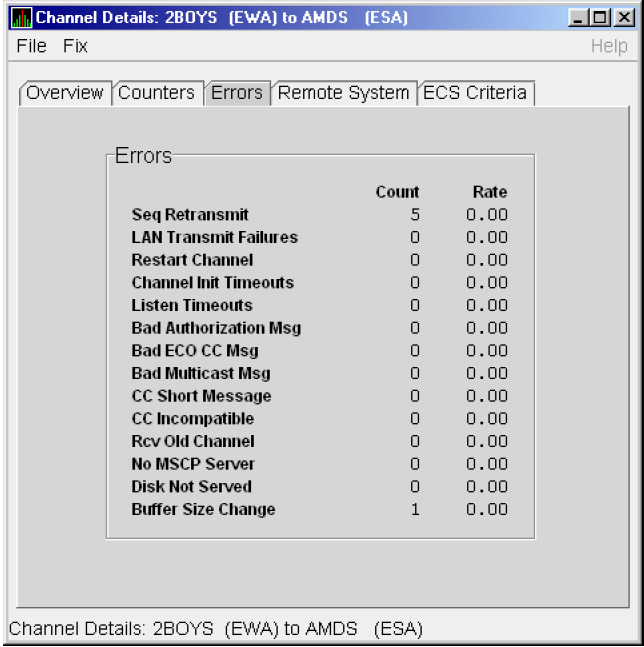
|
Data |
Description |
|---|---|
|
Seq Retransmit |
Number of times a sequenced VC packet sent on this channel was retransmitted, and the channel was penalized for the lost packet. |
|
LAN Transmit Failures |
Number of times the local LAN device reported a failure to transmit a packet, and channel was penalized for the lost packet. |
|
Restart Channel |
Close/restart because of channel control packet was received indicating the other end closed the channel and is restarting the channel handshake. |
|
Channel Init Timeouts |
Channel initialization handshake timeout. |
|
Listen Timeouts |
No packets of any kind, including HELLOs, were received in LISTEN_TIMEOUT seconds. |
|
Bad Authorization Msg |
Received a CC (channel control) packet with a bad authorization field. |
|
Bad ECO CC Msg |
Received a CC packet with an incompatible NISCA protocol ECO rev. field value. |
|
Bad Multicast Msg |
Received a bad multicast CC packet. |
|
CC Short Packet |
Received a CC packet that was too short. |
|
CC Incompatible |
Received a CC packet that was incompatible with existing channels for this virtual circuit. |
|
Rcv Old Channel |
Received a packet from an old instance of a channel. |
|
No MSCP Server |
No MSCP server available to respond to a received channel control solicit service packet asking this node to boot serve another node. |
|
Disk Not Served |
Disk is not served by this system. |
|
Buffer Size Change |
Change in buffer size. |
4.3.3.4. LAN Channel Remote System Data
The LAN Channel Remote System Data page (Figure 4.17, ''LAN Channel Remote System Data'') displays LAN path remote system data.
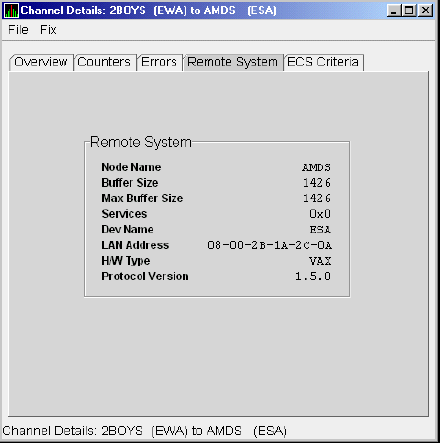
|
Data |
Description |
|---|---|
|
Node Name |
Node name of remote system. |
|
Buffer Size |
Buffer size (largest possible buffer size) of remote system. |
|
Max Buffer Size |
Current upper bound on buffer size usable on this channel. |
|
Services |
NISCA services supported on this channel. |
|
Dev Name |
Name of the remote LAN device. |
|
LAN Address |
Remote hardware address. |
|
H/W Type |
Hardware type of remote node. |
|
Protocol Version |
NISCA protocol version of remote system. |
4.3.3.5. LAN Channel ECS (Equivalent Channel Set) Criteria Data
The LAN Channel ECS Criteria Data page (Figure 4.18, ''LAN Channel ECS Criteria Data'') displays equivalent channel set criteria data.
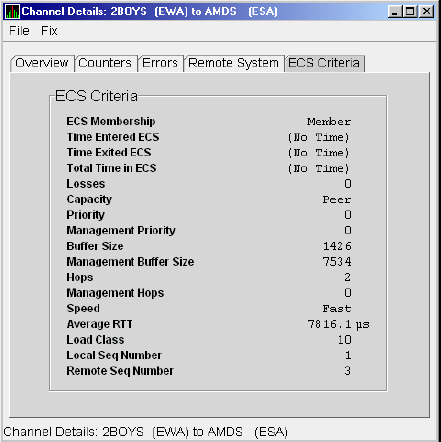
|
Data |
Description |
|---|---|
|
ECS Membership |
ECS membership status; that is, Member or Nonmember. |
|
Time Entered ECS |
Last time this channel entered the ECS. |
|
Time Exited ECS |
Last time this channel exited the ECS. |
|
Total Time in ECS |
Total time this channel was in the ECS. |
|
Losses |
Value representing channel's recent packet loss history. |
|
Capacity |
Channel's capacity rating based on evaluating its priority, buffer size, and hops values relative to the current ECS criteria. Values are: Ungraded, Peer, Inferior, Superior. |
|
Priority |
Channel's current priority for ECS calculations; it is the sum of the management priorities assigned to the local LAN device and to the channel. |
|
Management Priority |
Dynamic management-assigned priority. |
|
Buffer Size |
Negotiated maximum common buffer size: the smaller of local and remote BUS$ limits on block data field sizes. |
|
Management Buffer Size |
Maximum block data field size assigned by dynamic management. |
|
Hops |
Number of switches or bridges for this channel. |
|
Management Hops |
Management-supplied hops or media packet storage equivalent. |
|
Speed |
Classification of channel's delay relative to that of the lowest delay of any ECS member. |
|
Average RTT |
Average measured round-trip time. |
|
Load Class |
Lesser of the local and remote LAN device load class values. |
|
Local Seq Number |
Sequence number of the local channel. |
|
Remote Seq Number |
Sequence number of the remote channel. |
4.3.4. LAN Virtual Circuit Detail Data
The Network Interconnect for System Communications Architecture (NISCA) is the transport protocol responsible for carrying packets such as disk I/Os and lock packets across Ethernet and FDDI LANs to other nodes in the cluster.
The LAN virtual circuit details (NISCA) pages show detailed information about the LAN Ethernet or FDDI connection between two nodes. The Data Analyzer displays one window for each LAN virtual circuit. This page is intended primarily to provide real-time aids for diagnosing LAN-related cluster communications problems. VSI OpenVMS Cluster Systems describes the parameters shown on these pages and tells how to diagnose LAN-related cluster problems.
The LAN Virtual Circuit Details pages provide the same information as the SCACP command SHOW VC and as the following OpenVMS System Dump Analyzer (SDA) commands: PE VC and SHOW PORTS/VC=VC_ remote-node-name. In these commands, remote-node-name is the SCS name of another node in the cluster.
SDA defines VC_ remote-node-name and performs the first SHOW PORTS action after SDA is started. Thus, the /CH and /VC options are valid only with the second and subsequent SHOW PORT commands.
You can display LAN virtual circuit details data by double-clicking a "LAN Virtual Circuit Summary" data row or by right-clicking a menu on the Cluster Summary page (Figure 4.6, ''LAN Virtual Circuit Summary Data''). After a brief delay, a LAN VC Transmit Data page (Figure 4.19, ''LAN VC Transmit Data'') is displayed. The tabs at the top of the page indicate additional pages that you can display.
The data items displayed depend on the type of virtual circuit. Currently, this feature is available only for LAN virtual circuits.
4.3.4.1. LAN VC Transmit Data
Transmit data is information about the transmission of data packets, including the numbers of packets and bytes sent. Figure 4.19, ''LAN VC Transmit Data'' is an example of a LAN VC Transmit Data page.
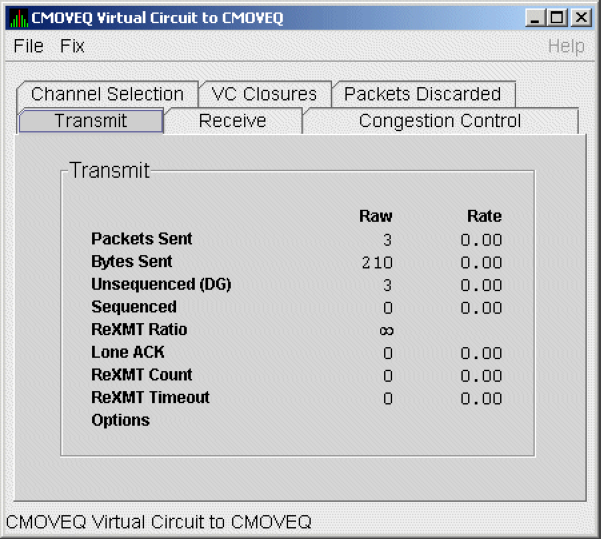
|
Data |
Description |
|---|---|
|
Packets Sent |
(Raw) count and rate of packets transmitted through the virtual circuit to the remote node, including both sequenced and unsequenced (channel control) packets and lone acknowledgments. |
|
Bytes Sent |
(Raw) count and rate of bytes transmitted through the virtual circuit. |
|
Unsequenced (DG) |
(Raw) count and rate of the number of unsequenced packets that are transmitted. |
|
Sequenced |
(Raw) count and rate of sequenced packets transmitted. Sequenced packets are guaranteed to be delivered. |
|
ReXMT Ratio |
Ratio of the total number of sequenced packets sent to the current retransmission count. |
|
Lone ACK |
(Raw) count and rate of packets sent solely for the purpose of acknowledging receipt of one or more packets. |
|
ReXMT Count |
Number of packets retransmitted. Retransmission occurs when the local node does not receive an acknowledgment for a transmitted packet within a predetermined timeout interval. |
|
ReXMT Timeout |
Number of retransmission timeouts that have occurred. |
|
Options |
Transmit options enabled:
|
4.3.4.2. LAN VC Receive Data
Receive data is information about the receipt of data packets. Figure 4.20, ''LAN VC Receive Data'' is an example of a LAN VC Receive Data page.
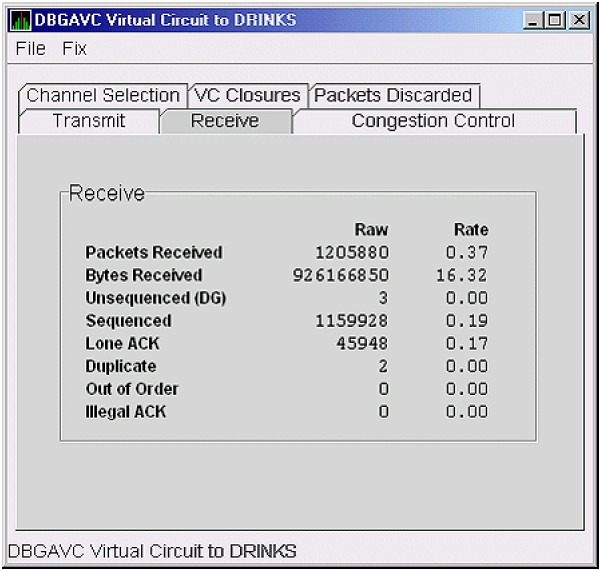
|
Data |
Description |
|---|---|
|
Packets Received |
(Raw) count and rate of packets received on the virtual circuit from the remote node, including both sequenced and unsequenced – that is, datagram packets and lone acknowledgments. |
|
Bytes Received |
(Raw) count and rate of bytes received in packets over the virtual circuit. |
|
Unsequenced (DG) |
(Raw) count and rate of unsequenced – datagram – packets received. |
|
Sequenced |
(Raw) count and rate of sequenced packets received. |
|
Lone ACK |
(Raw) count and rate of lone acknowledgments received. |
|
Duplicate |
Number of duplicated packets received by this system. Duplicates occur when the sending node retransmits a packet, and both the original and the retransmitted packets are received. |
|
Out of Order |
Number of packets received out of order by this system. |
|
Illegal ACK |
Number of illegal acknowledgments received – that is, acknowledgments of an out-of-range sequence number. |
4.3.4.3. LAN VC Congestion Control Data
LAN VC congestion control data is information about LAN traffic. The values indicate the number of packets that can be sent to the remote node before receiving an acknowledgment and the retransmission timeout.
Figure 4.21, ''LAN VC Congestion Control Data'' is an example of a LAN VC Congestion Control Data page. An item that is dimmed indicates that the current version of OpenVMS does not support that item.
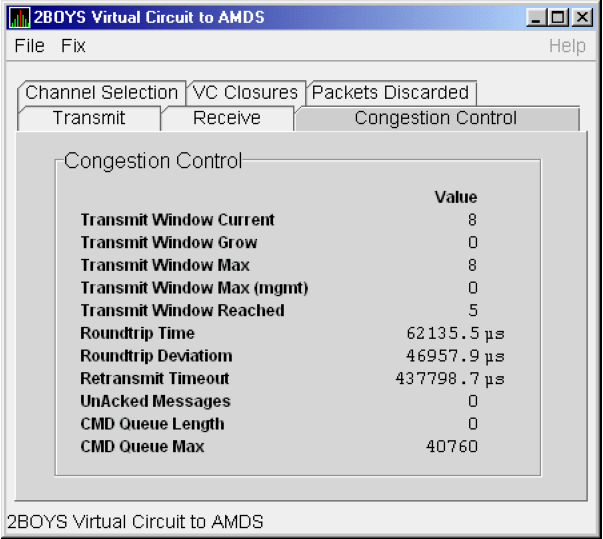
|
Data |
Description |
|---|---|
|
Transmit Window Current |
Current value of the transmit window (or pipe quota). After a timeout, the pipe quota is reset to 1 to decrease network path congestion. The pipe quota is allowed to increase as quickly as acknowledgments are received. |
|
Transmit Window Grow |
The slow growth threshold. The size at which the increase rate of the window is slowed to avoid congestion on the network again. |
|
Transmit Window Max |
Maximum transmit window size currently allowed for the virtual circuit based on channel and remote PEDRIVER receive cache limitations. |
|
Transmit Window Max (mgmt) |
Management override to calculated value for Maximum Transmit Window size. N/A on systems prior to Version 2.0. |
|
Transmit Window Reached |
Number of times the entire transmit window was full. If this number is small compared with the number of sequenced packets transmitted, then either the local node is not sending large bursts of data to the remote node, or acknowledging packets are being received so promptly that the window limit is never reached. |
|
Roundtrip Time |
Average round-trip time, in microseconds, for a packet to be sent and acknowledged. |
|
Roundtrip Deviation |
Average deviation, in microseconds, of the round-trip time. |
|
Retransmit Timeout |
Value, in microseconds, used to determine packet retransmission timeout. If a packet does not receive either an acknowledging or a responding packet, the packet is assumed to be lost and will be resent. |
|
UnAcked Packets |
Current number of unacknowledged packets. |
|
CMD Queue Length |
Current length of the virtual circuit's command queue. |
|
CMD Queue Max |
Maximum number of commands in the virtual circuit's command queue so far. |
4.3.4.4. LAN VC Channel Selection Data (Nonmanaged Objects)
The display of information about LAN VC channel selection depends on the version of OpenVMS and whether managed objects have been enabled. (For more information about managed objects, see the introduction to this chapter.)
Figure 4.22, ''LAN VC Channel Selection Data (Nonmanaged Objects)'' is an example of a Nonmanaged Object LAN VC Channel Selection Data page.
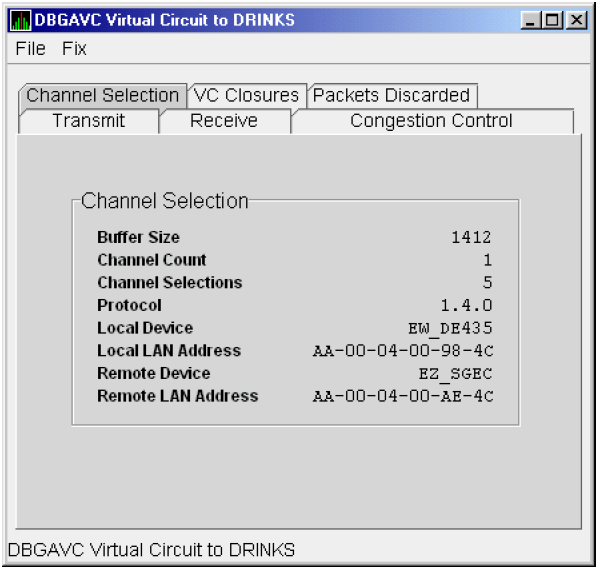
|
Data |
Description |
|---|---|
|
Buffer Size |
Maximum data buffer size for this virtual circuit. |
|
Channel Count |
Number of channels available for use by this virtual circuit. |
|
Channel Selections |
Number of channel selections performed. |
|
Protocol |
NISCA protocol version. |
|
Local Device |
Name of the local LAN device that the channel uses to send and receive packets. |
|
Local LAN Address |
Address of the local LAN device that performs sends and receives. |
|
Remote Device |
Name of the remote LAN device that the channel uses to send and receive packets. |
|
Remote LAN Address |
Address of the remote LAN device performing the sends and receives. |
4.3.4.5. LAN VC Channel Selection Data (Managed Objects Enabled)
Note
An additional requirement for displaying some of the data on this data page is that managed objects be enabled on your system. For more information, see the VSI Availability Manager Installation Instructions.
Figure 4.23, ''LAN VC Channel Selection Data (Managed Objects Enabled)'' is an example of a LAN VC Channel Selection Data page with managed objects enabled.
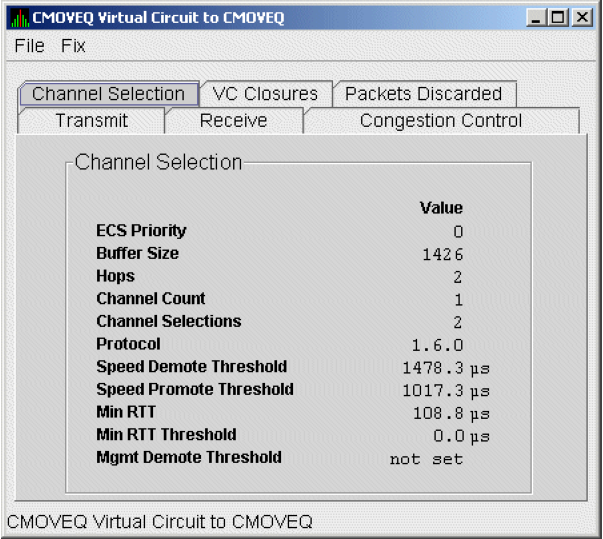
|
Data |
Description |
|---|---|
|
ECS Priority |
Current minimum priority a tight channel must have in order to be an ECS member. |
|
Buffer Size |
Maximum data buffer size for this virtual circuit. A channel must have this buffer size in order to be an ECS member. See ECS State in Table 4.7, ''LAN Path (Channel) Data'' for an explanation of a tight channel. |
|
Hops |
Current minimum management hops a channel must have in order to be included in the ECS. |
|
Channel Count |
Number of channels currently available for use by this virtual circuit. |
|
Channel Selections |
Number of channel selections performed. |
|
Protocol |
Remote node's NISCA protocol version. |
|
Speed Demote Threshold |
Current threshold for reclassifying a FAST channel to SLOW. |
|
Speed Promote Threshold |
Current threshold for reclassifying a SLOW channel to FAST. |
|
Min RTT |
Current minimum average delay of any current ECS members. |
|
Min RTT Threshold |
Current threshold for reclassifying a channel as FASTER than the current set of ECS channels. |
|
Mgmt Demote Threshold |
A management-specified lower limit on the maximum delay (in microseconds) an ECS member channel can have. Whenever at least one tight peer channel has a delay of less than the management-supplied value, all tight peer channels with delays less than the management-supplied value are automatically included in the ECS. When all tight peer channels have delays equal to or greater than the management setting, the ECS membership delay thresholds are automatically calculated and used. |
4.3.4.6. LAN VC Closures Data
LAN VC closures data is information about the number of times a virtual circuit has closed for a particular reason. Figure 4.24, ''LAN VC Closures Data'' is an example of a LAN VC Closures Data page.
An entry that is dimmed indicates that the current version of OpenVMS does not support that item.
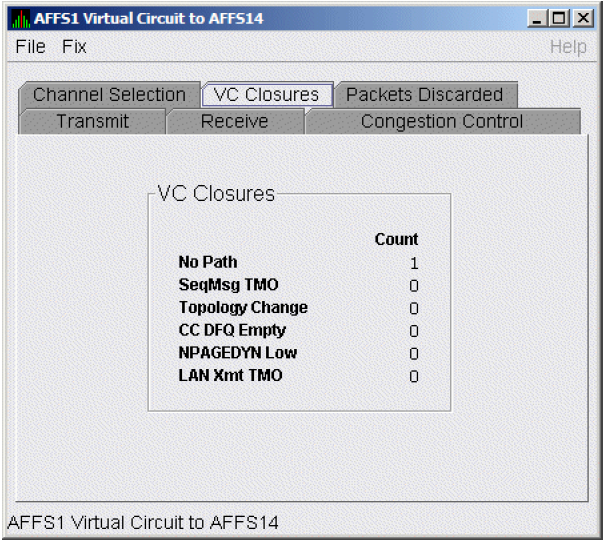
|
Data |
Description |
|---|---|
|
No Path |
Number of times the VC was closed because no usable LAN path was available. |
|
SeqMsg TMO |
Number of times the VC was closed because a sequenced packet's retransmit timeout count limit was exceeded. |
|
Topology Change |
Number of times the VC was closed because PEDRIVER performed a failover from a LAN path (or paths) with a large packet size to a LAN path with a smaller packet size. |
|
CC DFQ Empty |
Number of times the VC was closed because the channel control data-free queue (DFQ) was empty. |
|
NPAGEDYN Low |
Number of times the VC was closed because of a nonpaged pool allocation failure in the local node. |
|
LAN Xmt TMO |
Number of times the VC was closed because the LAN device used to send the packet did not report transmit completion before the packet's transmit timeout limit was exceeded. |
4.3.4.7. LAN VC Packets Discarded Data
LAN VC packets discarded data is information about the number of times packets were discarded for a particular reason. Figure 4.25, ''LAN VC Packets Discarded Data'' is an example of a LAN VC Packets Discarded Data page.
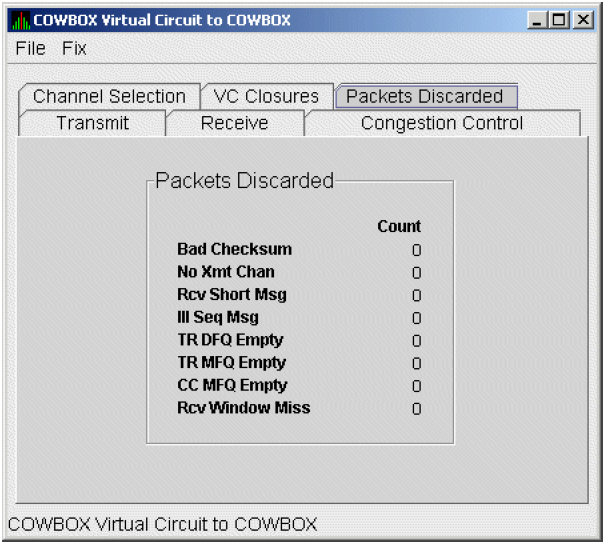
|
Data |
Description |
|---|---|
|
Bad Checksum |
Number of times there was a checksum failure on a received packet. |
|
No Xmt Chan |
Number of times no transmit channel was available. |
|
Rcv Short Msg |
Number of times an undersized transport packet was received. |
|
Ill Seq Msg |
Number of times an out-of-range sequence numbered packet was received. |
|
TR DFQ Empty |
Number of times the transmit data-free queue (DFQ) was empty. |
|
TR MFQ Empty |
Number of times the TR layer message-free queue (MFQ) was empty. |
|
CC MFQ Empty |
Number of times the channel control MFQ was empty. |
|
Rcv Window Miss |
Number of packets that could not be placed in the virtual circuit's receive cache because the cache was full. |
Chapter 5. Getting Information About Events
The Availability Manager Data Analyzer indicates resource availability problems in the Event pane (Figure 5.1, ''OpenVMS Event Pane'') of the main System Overview window (Figure 1.1, ''System Overview Window'').
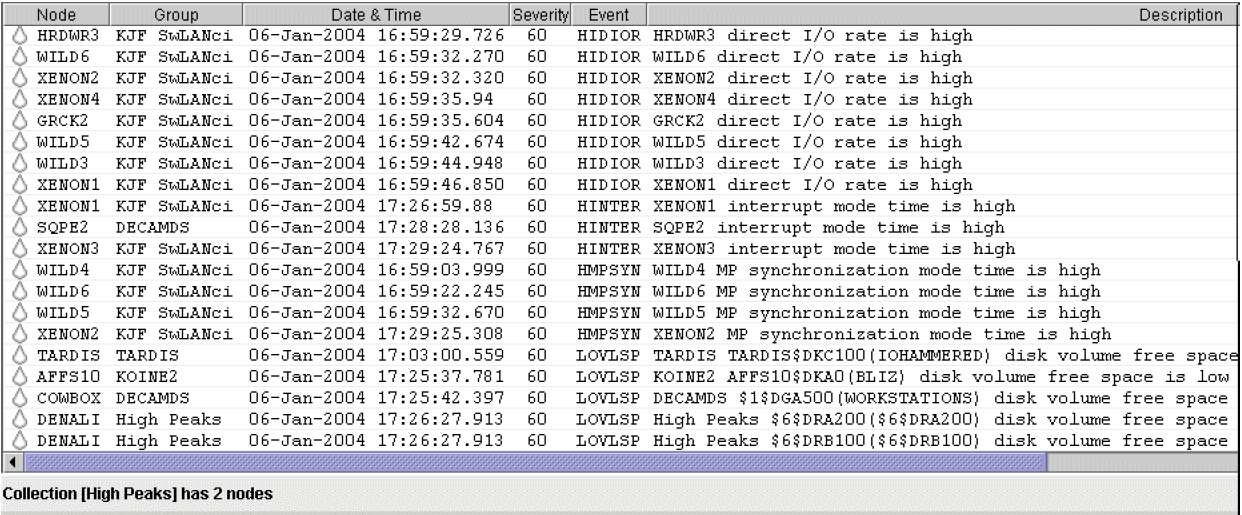
The Event pane helps you identify system problems. In many cases, you can apply fixes to correct these problems as well, as explained in Chapter 6, "Performing Fixes on OpenVMS Nodes".
The Data Analyzer displays a warning message in the Event pane whenever it detects a resource availability problem. If logging is enabled (the default), the Data Analyzer also logs each event in the Event Log file, which you can display or print. (For the location of this file and a cautionary note about it, see Section 5.2, ''Criteria for Evaluating an Event'').
5.1. Event Information Displayed in the Event Pane
The Data Analyzer can display events for all nodes that are currently in communication with the Data Analyzer. When an event of a certain severity occurs, the Data Analyzer adds the event to a list in the Event pane.
How long an event is displayed depends on the severity of the event. Less severe events are displayed for a short period of time (30 seconds); more severe events are displayed until you explicitly remove the event from the Event pane (explained in the section called “Event Pane Menu Options”).
Data in the Event Pane
|
Data Item |
Description |
|---|---|
|
Node |
Name of the node causing the event |
|
Group |
Group of the node causing the event |
|
Date |
Date the event occurred |
|
Time |
Time that an event was detected |
|
Sev |
Severity: a value from 0 to 100. (You can customize this value to indicate the importance of the event, with 100 as the most important.) |
|
Event |
Alphanumeric identifier of the type of event |
|
Description |
Short description of the resource availability problem |
Appendix C, "Tables of Events" contains tables of events that are displayed in the Event pane. In addition, these tables contain an explanation of each event and the recommended remedial action.
Event Pane Menu Options
|
Menu Option |
Description |
|---|---|
|
Display |
Displays the Node Summary page associated with that event. |
|
Remove |
Removes an event from the display. |
|
Freeze/Unfreeze |
Freezes a value in the display until you "unfreeze" it; a snowflake icon is displayed to the left of an event that is frozen. |
|
Customize |
Allows you to customize events. |
5.2. Criteria for Evaluating an Event
During data collection, any time data meets or exceeds the threshold for an event, an occurrence counter is incremented. When the incremented value matches the value in the Occurrence box on the Event Customization page (Figure 5.2, ''Sample Event Customization''), the event is posted in the Event pane of the System Overview window (Figure 1.1, ''System Overview Window'').
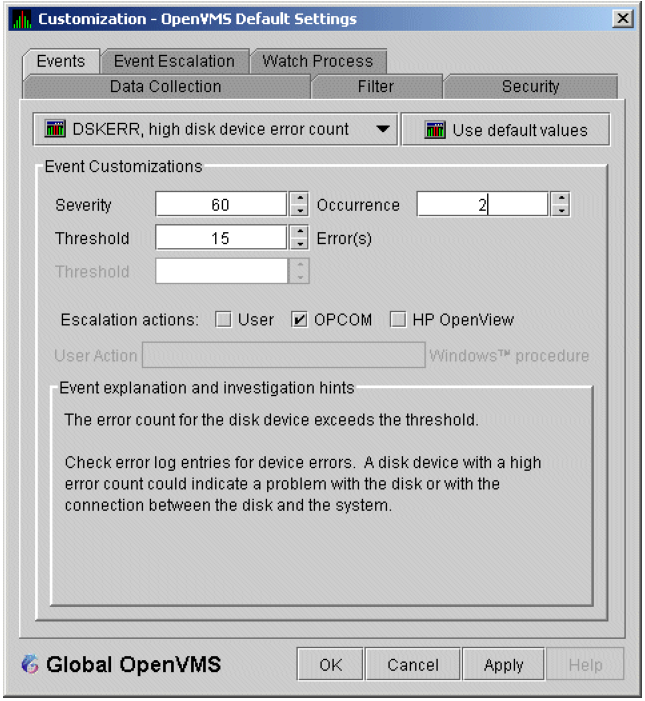
The sample Event Customization page indicates a threshold of 15 errors and an occurrence value of 2. This means that if the DSKERR event exceeds its threshold of 15 for two consecutive data collections, the DSKERR event is posted in the Event pane.
Note that some events are triggered when data is lower than the threshold; other events are triggered when data is higher than the threshold.
If, at any time during data collection, the data does not meet or exceed the threshold, the occurrence counter is set to zero, and the event is removed from the Event pane. Figure 5.3, ''Testing for Events'' depicts this sequence.
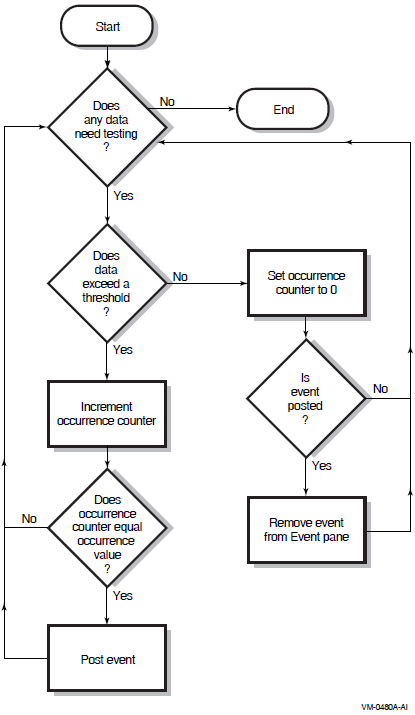
5.3. Criteria for Posting and Displaying an Event
The event is displayed in the Event pane.
The data associated with the event is collected at the Event interval shown on the Data Collection Customization page (Figure 5.4, ''OpenVMS Data Collection Customization''). In this example, the event is associated with the Disk Status data collection.
Figure 5.4. OpenVMS Data Collection Customization 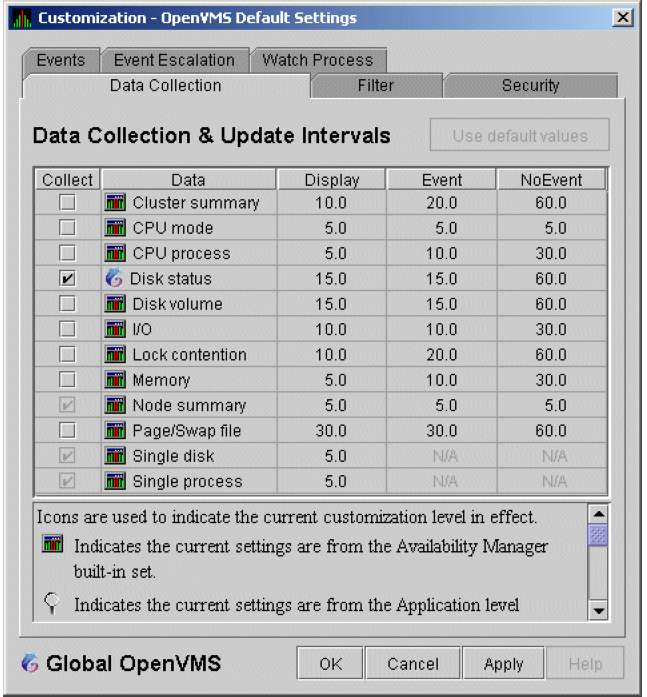
On the Data Collection Customization page, for example, the Event interval for Disk Status data collection is every 15 seconds.
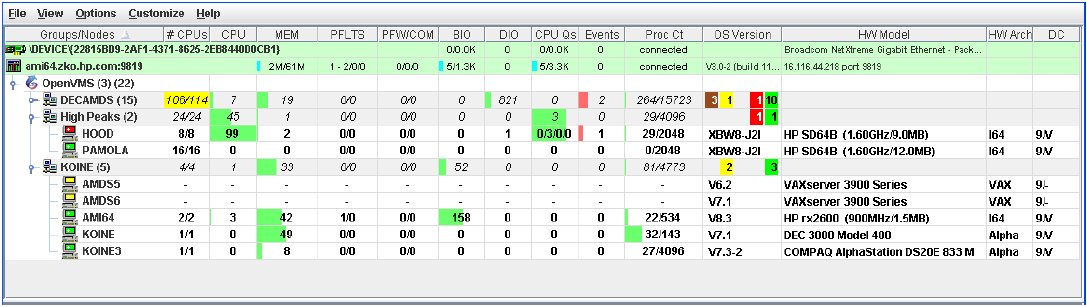
The Events field in the Group/Node pane is incremented, and the node icon in the Node Name field turns red (see Figure 5.5, ''OpenVMS Group/Node Pane''). You can see the events posted for this node in a tooltip by placing the mouse over the node name.
- When an event is posted, it is added to the Event Log file by default:
- On OpenVMS systems, the Event Log file is:
AMDS$AM_LOG:ANALYZEREVENTS_CONNi_yyyymmdd-hhmm.LOG
The
iin the file is an integer indicating the connection in the Data Analyzer. The other small letters indicate the date and time the log file was created. On Windows systems, the Event Log file name has the same format, and is located in C:\Users\username\AMDS$AM_Config by default, where username is your Windows username, or where the path specified by the AMDS$AM_Config environment variable. See Appendix A, "Location of the Availability Manager Configuration and Log Files" for further details.
The Event Log consists of the following fields:
| Event Column | Description | |
| Group name | AMDS Group name | |
| Node | Node name for the OpenVMS system | |
| Date/Time | The date and time for the Event Log entry | |
| Severity | Severity of the event | |
| Event | Alphanumeric event identifier | |
| EventKey | A hex value identifying an event for a node. For instance, all HINTER events for a node have the same value. Each time the HINTER event is signaled for a node, the value will be the same, making it easy to search for all the HINTER events for a node. | |
| EventID | A hex value identifying an individual event. For instance, if the HICOMQ event on node SAM is signaled, the BEGIN and END/CANCELD/EXPIRED entries that mark when the event was signaled and cancelled will have the same value. The next time the HICOMQ event is signaled on node SAM, the hex value will be different. This value makes it easy to find the entry that signals when the event has been cancelled. | |
| Status | The value describes the status of the event. Values are as follows: | |
|
Status Value |
Description | |
| INFO | This event is informational. | |
| BEGIN | The event entry marks the beginning of the interval when the values for an event have exceeded the threshold. | |
| END | The event entry marks the end of the interval when the values for an event have exceeded the threshold. | |
| CANCELD | The event entry marks when the event was removed because the data used to evaluate the event is now longer being collected. | |
| EXPIRED | The event entry marks when the event has expired. | |
| Description | Event description | |
Caution About Event Logs
If you collect data on many nodes, running the Data Analyzer for a long period of time can result in a large event log. For example, in a run that monitors more than 50 nodes with most of the background data collection enabled, the event log can grow by up to 30 MB per day. At this rate, systems with small disks might fill up the disk on which the event log resides. For Windows systems, it is useful to turn on file compression for the AMDS$AM folder to save space. File compression is enabled by clicking on the button in the folder's Properties dialog.
Closing the Data Analyzer application allows you to access the event log for tasks such as archiving. Starting the Data Analyzer starts a new event log.
5.4. Displaying Additional Event Information
For more detailed information about a specific event, double-click any event data item in the Event pane. The Data Analyzer first displays a data page that most closely corresponds to the cause of the event. You can choose other tabs for additional detailed information.
For a description of data pages and the information they contain, see Chapter 3, "Getting Information About Nodes".
Chapter 6. Performing Fixes on OpenVMS Nodes
Fixes allow you to resolve resource availability problems and improve system availability.
Understanding fixes
Performing fixes
Caution
Performing certain fixes can have serious repercussions, including possible system failure. Therefore, only experienced system managers should perform fixes.
6.1. Understanding Fixes
When you suspect or detect a resource availability problem, in many cases you can use the Availability Manager Data Analyzer to analyze the problem and to perform a fix to improve the situation.
Node fixes
Process fixes
Cluster interconnect fixes
|
Fix Category and Name |
Available from This Page |
|---|---|
|
Node fixes:
|
|
|
Process fixes:
|
All of the process fixes are available from the following pages:
|
|
Disk volume fixes: | |
|
Cancel Disk Volume Mount Verification | Disk Status Summary |
|
Cancel Shadow Set Mount Verification | Disk Volume Summary |
|
Cluster interconnect fixes: |
These fixes are available from the following lines of data on the Cluster Summary page (Figure 4.1, ''OpenVMS Cluster Summary''): |
|
SCA Port:/ Adjust Priority |
Right-click a data item on the Local Port Data display line to display a menu. Then select . |
|
SCA Circuit:/ Adjust Priority |
Right-click a data item on the Circuits Data display line to display a menu. Then select . |
|
LAN Virtual Circuit Summary:
|
Right-click a data item on the LAN Virtual Circuit Summary line to display a menu. Then select . Alternatively, you can use the menu on the LAN VC Details page. |
|
LAN Path (Channel) Summary:
|
Right-click a data item on the LAN Path (Channel) Summary line to display a menu. Then select . Alternatively, you can use the menu on the Channel Details page. |
|
LAN Device Details:
|
You can access these fixes in the following ways:
|
|
Problem |
Fix |
Result |
|---|---|---|
|
Node resource hanging cluster |
Crash Node |
Node fails with operator-requested shutdown. See Section 6.2.2, ''Crash Node'' for the crash dump footprint for this type of shutdown. |
|
Cluster hung |
Adjust Quorum |
Quorum for cluster is adjusted. |
|
Process looping, intruder |
Delete Process |
Process no longer exists. |
|
Endless process loop in same PC range |
Exit Image |
Exits from current image. |
|
Runaway process, unwelcome intruder |
Suspend Process |
Process is suspended from execution. |
|
Process previously suspended |
Resume Process |
Process starts from point it was suspended. |
|
Runaway process or process that is overconsuming |
Process Priority |
Base priority changes to selected setting. |
|
Low node memory |
Purge Working Set (WS) |
Frees memory on node; page faulting might occur for process affected. |
|
Working set too high or low |
Adjust Working Set (WS) |
Removes unused pages from working set; page faulting might occur. |
|
Process quota has reached its limit and has entered RWAIT state |
Adjust Process Limits |
Process limit is increased, which in many cases frees the process to continue execution. |
|
Process has exhausted its pagefile quota |
Adjust Pagefile Quota |
Pagefile quota limit of the process is adjusted. |
|
A disk volume is in a Mount Verify state, and the host node for the disk volume is down. This can result in processes that have open files on the disk volume to hang. If the host node can not be rebooted, these processes remain hung. |
Cancel Disk MV |
The disk volume is put into the Mount Verify Timeout state, and processes that have open files on the disk volume are no longer hung. |
|
A shadow set is not available for use because one of the shadow set members is in a Mount Verify state. |
Cancel SSM MV |
The shadow set member is put into a Mount Verify Timeout state, and the shadow set is released to function with the remaining shadow set members. Processes that were hung are no longer hung. |
|
Process Fix |
System Service Call |
|---|---|
|
Delete Process |
$DELPRC |
|
Exit Image |
$FORCEX |
|
Suspend Process |
$SUSPND |
|
Resume Process |
$RESUME |
|
Process Priority |
$SETPRI |
|
Purge Working Set (WS) |
$PURGWS |
|
Adjust Working Set (WS) |
$ADJWSL |
|
Adjust process limits of the following:
|
None |
Note
Each fix that uses a system service call requires that the process execute the system service. A hung process has the fix queued to it, and the fix does not execute until the process is operational again.
You must have write access to perform a fix. To perform LAN fixes, you must have control access.
You cannot undo many fixes. For example, after using the Crash Node fix, the node must be rebooted (either by the node if the node reboots automatically, or by a person performing a manual boot).
Do not apply the Exit Image, Delete Process, or Suspend Process fix to system processes. Doing so might require you to reboot the node.
Whenever you exit an image, you cannot return to that image.
You cannot delete processes that have exceeded their job or process quota.
The Availability Manager Data Collector ignores fixes applied to the SWAPPER process.
How to Perform Fixes
Standard OpenVMS privileges restrict users' write access. When you run the Data Analyzer, you must have the CMKRNL privilege to send a write (fix) instruction to a node with a problem.
|
Option |
Description |
|---|---|
|
OK |
Applies the fix and then exits the page. Any message associated with the fix is displayed in the Event pane. |
|
Cancel |
Cancels the fix. |
|
Apply |
Applies the fix and does not exit the page. Any message associated with the fix is displayed in the Return Status section of the page and in the Event pane. |
The following sections explain how to perform node fixes and process fixes.
Note
Node, process, and disk fixes generate an event when they are executed. The events are entered into the event log on the system that is running the Data Analyzer. See the "Events generated by fixes" section in Table D.2, ''OpenVMS Nonthreshold Events'' for a list of these events.
6.2. Performing Node Fixes
Fixes that allow you to deliberately fail (or crash) a node
A fix that allows you to adjust cluster quorum.
On the Node Summary, CPU, Memory, or I/O page, select the menu.
Select .
6.2.1. Adjust Quorum
The default node fix displayed is the Adjust Quorum fix, which forces a node to recalculate the quorum value. This fix is the equivalent of the Interrupt Priority level C (IPC) mechanism used at system consoles for the same purpose. The fix forces the adjustment for the entire cluster so that each node in the cluster has the same new quorum value.
The Adjust Quorum fix is useful when the number of votes in a cluster falls below the quorum set for that cluster. This fix allows you to readjust the quorum so that it corresponds to the current number of votes in the cluster.
The Adjust Quorum page is shown in Figure 6.1, ''Adjust Quorum''.
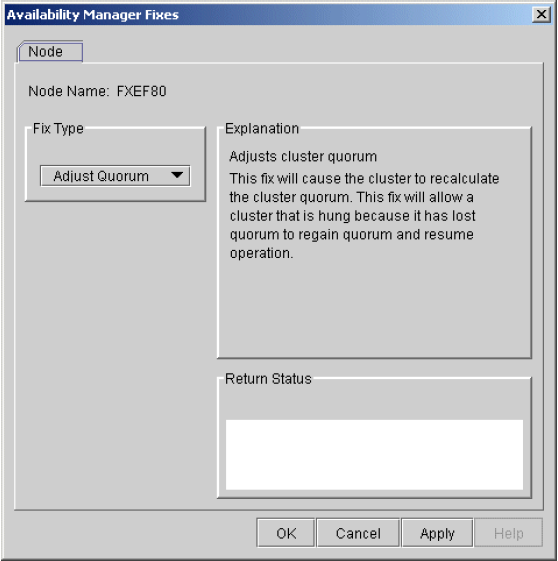
6.2.2. Crash Node
Caution
The Crash Node fix is an operator-requested bugcheck from the driver. It takes place as soon as you click in the Crash Node fix. After you perform this fix, the node cannot be restored to its previous state. After a crash, the node must be rebooted.
When you select the Crash Node option, the Data Analyzer displays the Crash Node page, shown in Figure 6.2, ''Crash Node''.
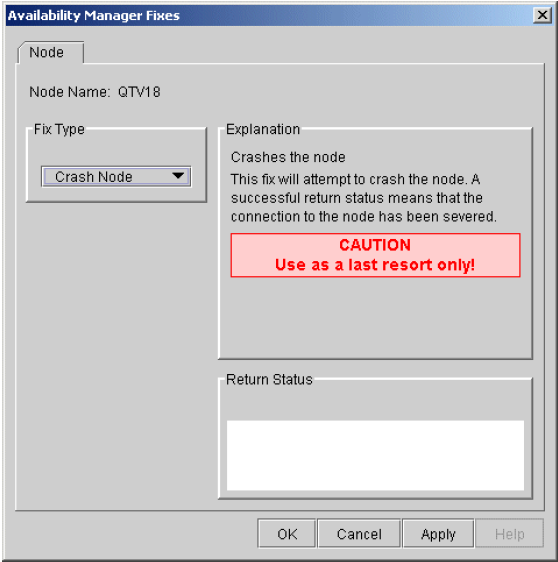
Note
Because the node cannot report a confirmation when a Crash Node fix is successful, the crash success message is displayed after the timeout period for the fix confirmation has expired.
Recognizing a System Failure Forced by the Availability Manager
                SP => Quadword system address
                      Quadword data
                      1BE0DEAD.00000000
                      00000000.00000000
                      Quadword data            TRAP$CRASH
                      Quadword data            SYS$RMDRIVER + offset
6.3. Performing Process Fixes
Process fixes fall into the following categories:
Fixes that allow you to affect the process. For instance, change its priority, suspend it, or resume it.
A fix that allows you to adjust the memory of a process.
A fix that allows you to adjust the quotas or limits of a process.
On the CPU Process, Memory, or I/O page, right-click a process name.
Click .
The Data Analyzer displays these Process tabs:- Process General
- Process Memory
- Process Limits
Click one of these tabs to bring it to the front.
Click the down arrow to display the process fixes in this group, as shown in Figure 6.3, ''Process General Options'', where the Process General tab has been chosen.
Figure 6.3. Process General Options 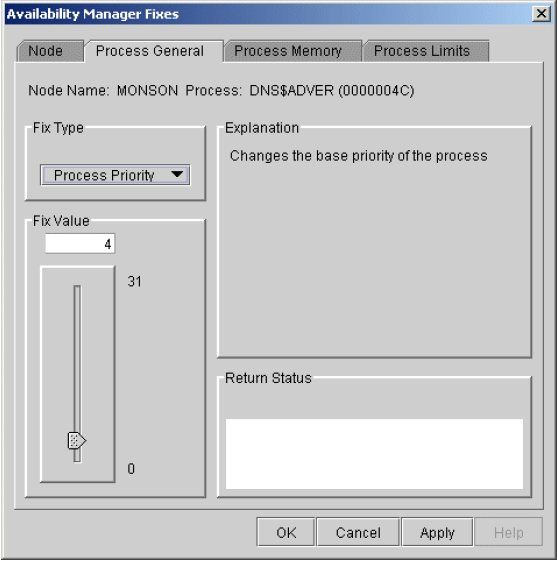
Select a process fix (for example, Process Priority, shown in Figure 6.3, ''Process General Options''), to display a fix page.
Some of the fixes, such as Process Priority, require you to use a slider to change the default value. When you finish setting a new process priority, click at the bottom of the page to apply that fix.
6.3.1. General Process Fixes
The following sections describe Data Analyzer general process fixes. These fixes include instructions telling how to delete, suspend, and resume a process.
6.3.1.1. Delete Process
Caution
Deleting a system process can cause the system to hang or become unstable.
When you select the Delete Process option, the Data Analyzer displays the page shown in Figure 6.4, ''Delete Process''.
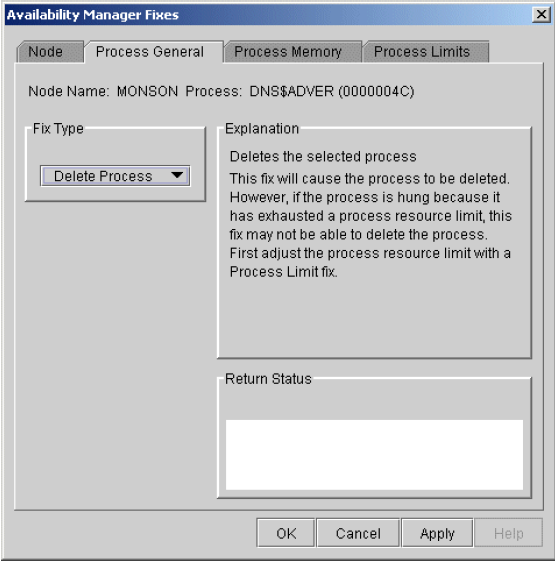
After reading the explanation, click at the bottom of the page to apply the fix. A message displayed on the page indicates that the fix has been successful.
6.3.1.2. Exit Image
Caution
Exiting an image on a system process could cause the system to hang or become unstable.
When you select the Exit Image option, the Data Analyzer displays the page shown in Figure 6.5, ''Exit Image Page''.
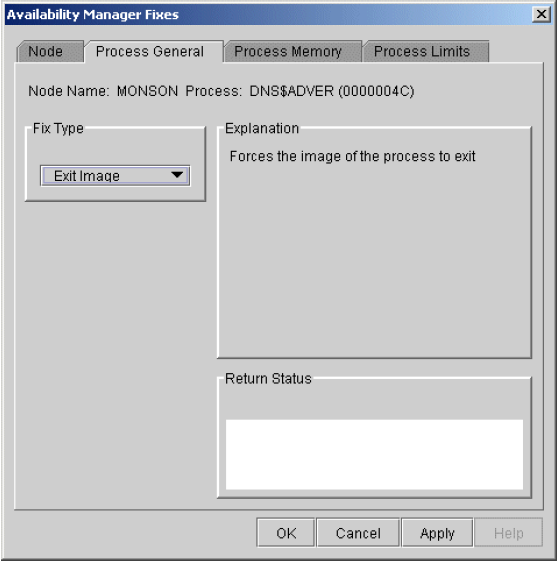
After reading the explanation in the page, click at the bottom of the page to apply the fix. A message displayed on the page indicates that the fix has been successful.
6.3.1.3. Suspend Process
Caution
Do not suspend system processes, especially JOB_CONTROL, because this might make your system unusable. (For more information, see VSI OpenVMS Programming Concepts Manual, Volume I.)
When you select the Suspend Process option, the Data Analyzer displays the page shown in Figure 6.6, ''Suspend Process''.

After reading the explanation, click at the bottom of the page to apply the fix. A message displayed on the page indicates that the fix has been successful.
6.3.1.4. Resume Process
Resuming a process that was using excess CPU time while running might reduce perceived CPU performance on the node. (Conversely, suspending a process that is consuming excess CPU time can improve perceived CPU performance by freeing the CPU for other processes to use.)
When you select the Resume Process option, the Data Analyzer displays the page shown in Figure 6.7, ''Resume Process''.
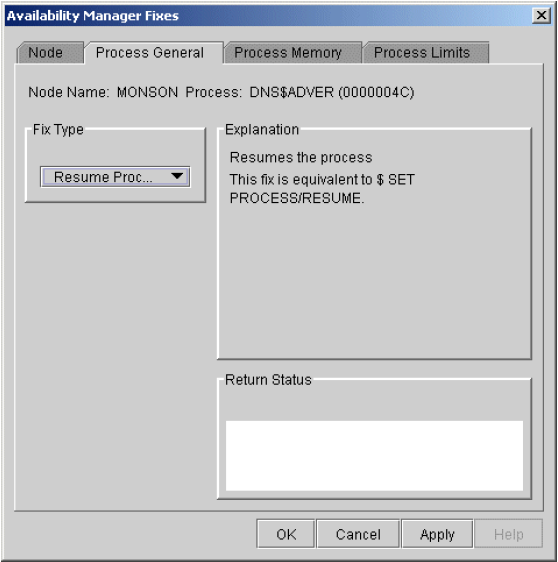
After reading the explanation, click at the bottom of the page to apply the fix. A message displayed on the page indicates that the fix has been successful.
6.3.1.5. Process Priority
If the priority of a compute-bound process is too high, the process can consume all the CPU cycles on the node, affecting performance dramatically. On the other hand, if the priority of a process is too low, the process might not obtain enough CPU cycles to do its job, also affecting performance.
When you select the Process Priority option, the Data Analyzer displays the page shown in Figure 6.8, ''Process Priority''.
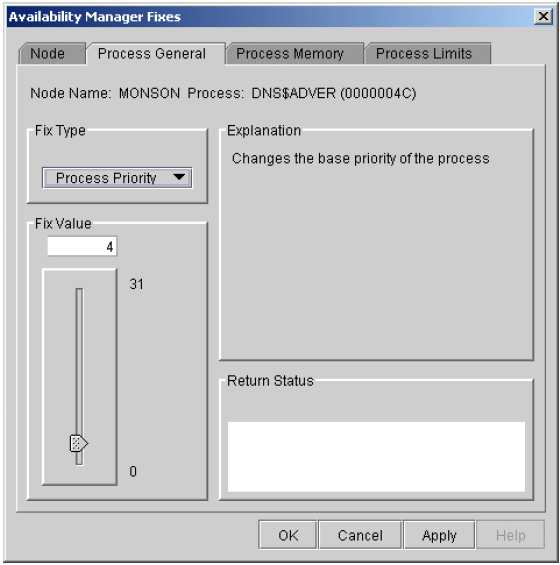
To change the base priority for a process, drag the slider on the scale to the number you want. The current priority number is displayed in a small box above the slider. You can also click the line above or below the slider to adjust the number by 1.
When you are satisfied with the new base priority, click at the bottom of the page to apply the fix. A message displayed on the page indicates that the fix has been successful.
6.3.2. Process Memory Fixes
The following sections describe the Availability Manager fixes you can use to correct process memory problems – Purge Working Set and Adjust Working Set fixes.
6.3.2.1. Purge Working Set
This fix purges the working set to a minimal size. You can use this fix to reclaim a process's pages that are not in active use. If the process is in a wait state, the working set remains at a minimal size, and the purged pages become available for other uses. If the process becomes active, pages the process needs are page-faulted back into memory, and the unneeded pages are available for other uses.
Be careful not to repeat this fix too often: a process that continually reclaims needed pages can cause excessive page faulting, which can affect system performance.
When you select the Purge WS option, the Data Analyzer displays the page shown in Figure 6.9, ''Purge Working Set''.
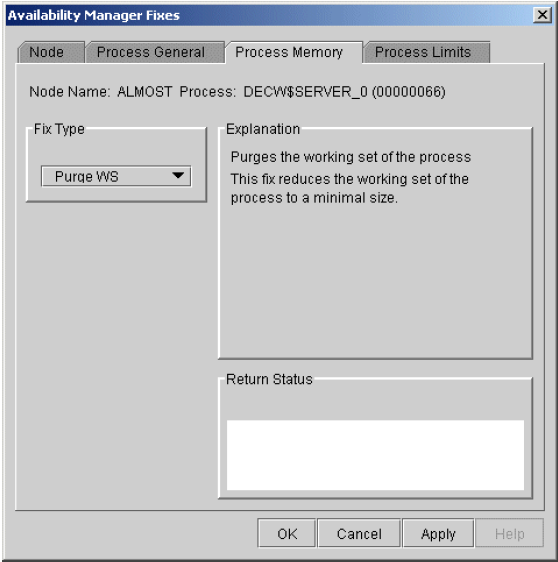
After reading the explanation on the page, click at the bottom of the page to apply the fix. A message displayed on the page indicates that the fix has been successful.
6.3.2.2. Adjust Working Set
If a process is page-faulting because of insufficient memory, you can reclaim unused memory from other processes by decreasing the working set of one or more of them.
If a process is page-faulting too frequently because its working set is too small, you can increase its working set.
Caution
If the automatic working set adjustment is enabled for the system, a fix to adjust the working set size disables the automatic adjustment for the process. For more information, see OpenVMS online help for SET WORKING_SET/ADJUST, which includes /NOADJUST.
When you select the Adjust WS option, the Data Analyzer displays the page shown in Figure 6.10, ''Adjust Working Set''.
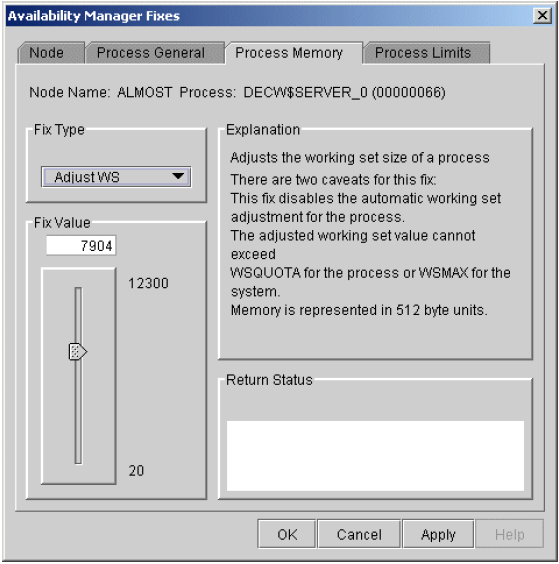
To perform this fix, use the slider to adjust the working set to the limit you want. You can also click the line above or below the slider to adjust the number by 1.
When you are satisfied with the new working set limit, click at the bottom of the page to apply the fix. A message displayed on the page indicates that the fix has been successful.
6.3.3. Process Limits Fixes
If a process is waiting for a resource, you can use a Process Limits fix to increase the resource limit so that the process can continue. The increased limit is in effect only for the life of the process, however; any new process is assigned the quota that was set in the UAF.
- Direct I/O
- Buffered I/O
- AST
- Open File
- Lock
- Timer
- Subprocess
- I/O Byte
- Pagefile Quota
These fix options are described in the following sections.
6.3.3.1. Direct I/O Count Limit
You can use this fix to adjust the direct I/O count limit of a process. When you select the Direct I/O option, the Data Analyzer displays the page shown in Figure 6.11, ''Direct I/O Count Limit''.
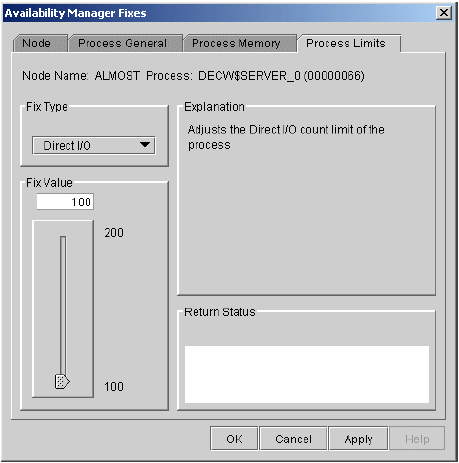
To perform this fix, use the slider to adjust the direct I/O count to the limit you want. You can also click the line above or below the slider to adjust the number by 1.
When you are satisfied with the new direct I/O count limit, click at the bottom of the page to apply the fix. A message displayed on the page indicates that the fix has been successful.
6.3.3.2. Buffered I/O Count Limit
You can use this fix to adjust the buffered I/O count limit of a process. When you select the Buffered I/O option, the Data Analyzer displays the page shown in Figure 6.12, ''Buffered I/O Count Limit''.
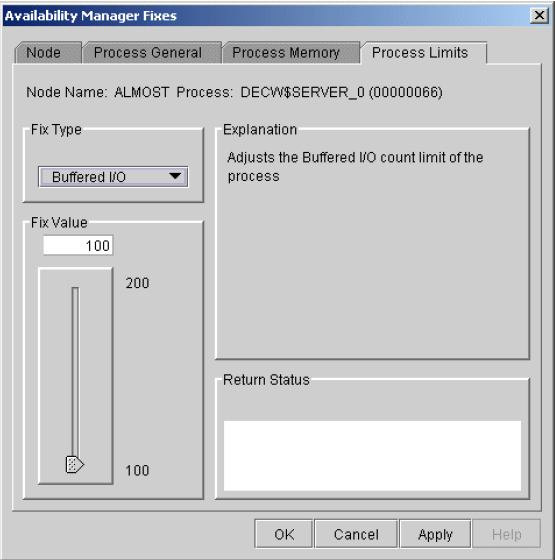
To perform this fix, use the slider to adjust the buffered I/O count to the limit you want. You can also click the line above or below the slider to adjust the number by 1.
When you are satisfied with the new buffered I/O count limit, click at the bottom of the page to apply the fix. A message displayed on the page indicates that the fix has been successful.
6.3.3.3. AST Queue Limit
You can use this fix to adjust the AST queue limit of a process. When you select the AST option, the Data Analyzer displays a page similar to the one shown in Figure 6.13, ''AST Queue Limit''.
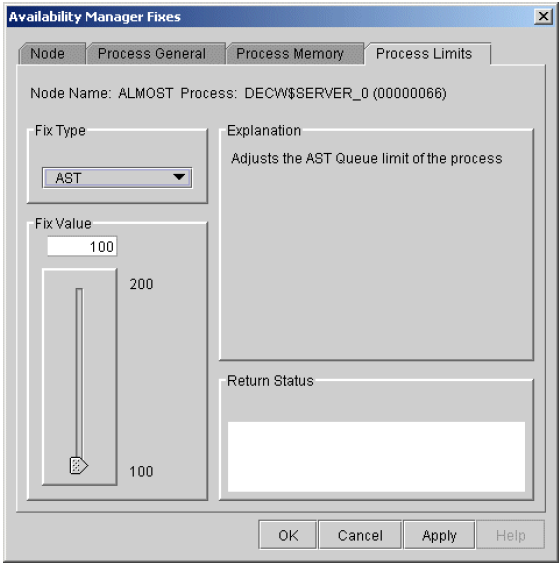
To perform this fix, use the slider to adjust the AST queue limit to the number you want. You can also click the line above or below the slider to adjust the number by 1.
When you are satisfied with the new AST queue limit, click at the bottom of the page to apply the fix. A message displayed on the page indicates that the fix has been successful.
6.3.3.4. Open File Limit
You can use this fix to adjust the open file limit of a process. When you select the Open File option, the Data Analyzer displays a page similar to the one shown in Figure 6.14, ''Open File Limit''.
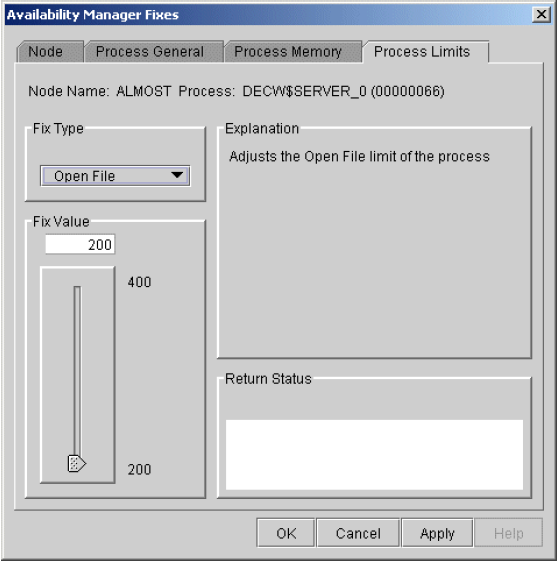
To perform this fix, use the slider to adjust the open file limit to the number you want. You can also click the line above or below the slider to adjust the number by 1.
When you are satisfied with the new open file limit, click at the bottom of the page to apply the fix. A message displayed on the page indicates that the fix has been successful.
6.3.3.5. Lock Queue Limit
You can use this fix to adjust the lock queue limit of a process. When you select the Lock option, the Data Analyzer displays a page that is similar to the one shown in Figure 6.15, ''Lock Queue Limit''.
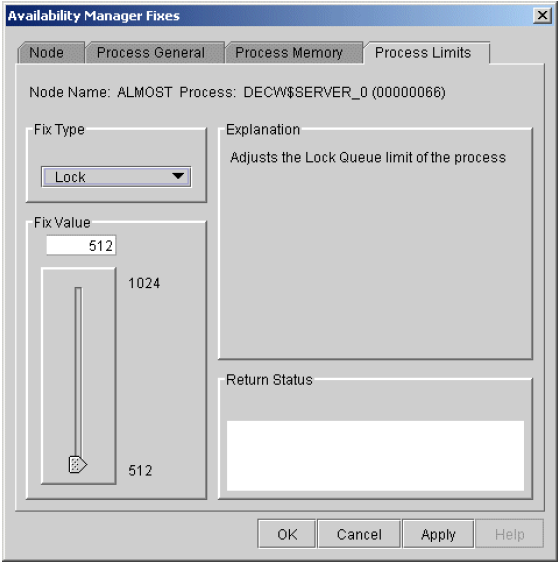
To perform this fix, use the slider to adjust the lock queue limit to the number you want. You can also click the line above or below the slider to adjust the number by 1.
When you are satisfied with the new lock queue limit, click at the bottom of the page to apply the fix. A message displayed on the page indicates that the fix has been successful.
6.3.3.6. Timer Queue Entry Limit
You can use this fix to adjust the timer queue entry limit of a process. When you select the Timer option, the Data Analyzer displays the page shown in Figure 6.16, ''Timer Queue Entry Limit''.
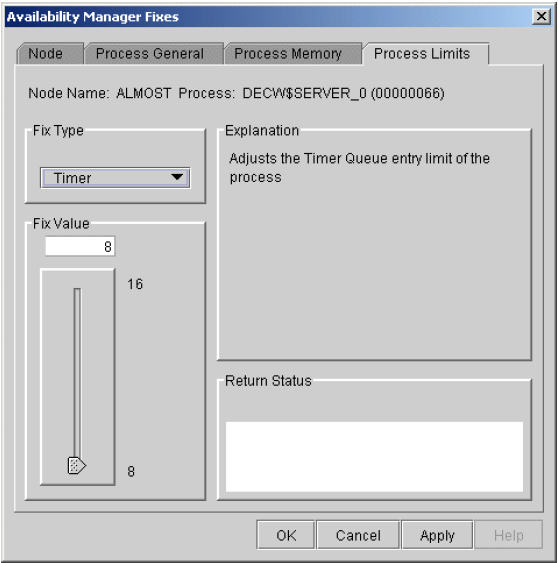
To perform this fix, use the slider to adjust the timer queue entry limit to the number you want. You can also click the line above or below the slider to adjust the number by 1.
When you are satisfied with the new timer queue entry limit, click at the bottom of the page to apply the fix. A message displayed on the page indicates that the fix has been successful.
6.3.3.7. Subprocess Creation Limit
You can use this fix to adjust the creation limit of the subprocess of a process. When you select the Subprocess option, the Data Analyzer displays the page shown in Figure 6.17, ''Subprocess Creation Limit''.
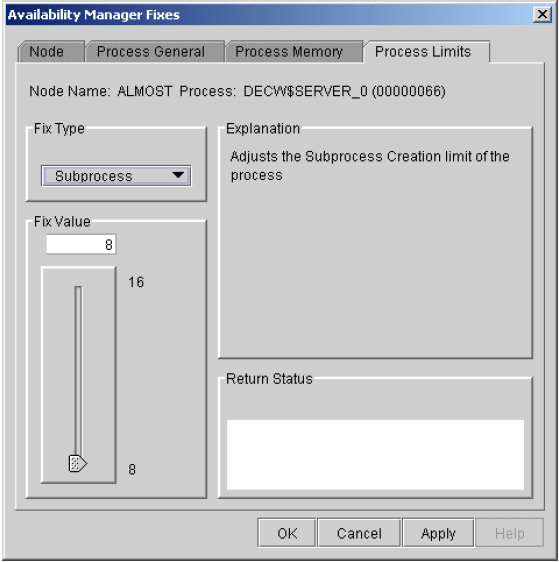
To perform this fix, use the slider to adjust the subprocess creation limit of a process to the number you want. You can also click the line above or below the slider to adjust the number by 1.
When you are satisfied with the new subprocess creation limit, click at the bottom of the page to apply the fix. A message displayed on the page indicates that the fix has been successful.
6.3.3.8. I/O Byte
You can use this fix to adjust the I/O byte limit of a process. When you select the I/O Byte option, the Data Analyzer displays a page similar to the one shown in Figure 6.18, ''I/O Byte''.

To perform this fix, use the slider to adjust the I/O byte limit to the number you want. You can also click the line above or below the slider to adjust the number by 1.
When you are satisfied with the new I/O byte limit, click at the bottom of the page to apply the fix. A message displayed on the page indicates that the fix has been successful.
6.3.3.9. Pagefile Quota
You can use this fix to adjust the pagefile quota limit of a process. This quota is share among all the processes in a job. When you select the Pagefile Quota option, the Data Analyzer displays the page shown in Figure 6.19, ''Pagefile Quota''.
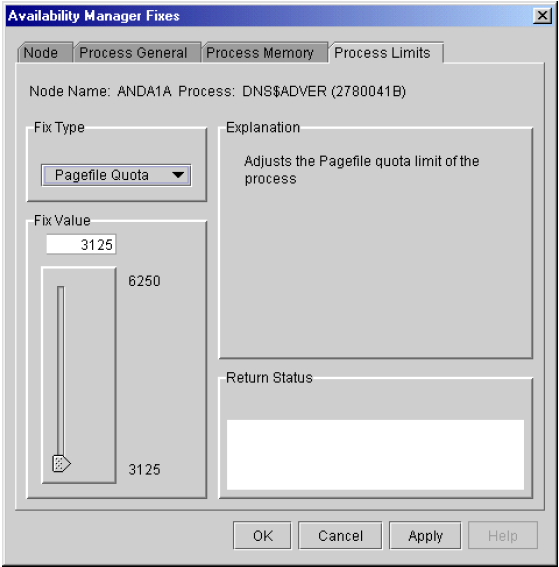
To perform this fix, use the slider to adjust the pagefile quota limit to the number you want. You can also click above or below the slider to adjust the fix value by 1.
When you are satisfied with the new pagefile quota limit, click at the bottom of the page to apply the fix. A message displayed on the page indicates that the fix has been successful.
6.4. Performing Disk Fixes
Disk fixes fall into the following categories:
Forcing a disk volume out of a mount verify state
Forcing a shadow set member out of a shadow set, allowing the shadow set to come out of a mount verify state and resume normal operations
To perform a node fix, follow these steps:
On the Disk Status Summary or Disk Volume Summary page, select the menu.
Select .
6.4.1. Cancel Disk Volume Mount Verification
The default disk fix displayed is the Cancel Disk Mount Verification (MV) fix, which forces a disk volume that is in a mount verify state into a mount verify timeout state. This fix is the equivalent of the Interrupt Priority level C (IPC) mechanism used at system consoles for the same purpose.
The Cancel Disk Mount Verification (MV) fix is useful where disk volumes are mounted cluster-wide, and the host node for the disk volume fails. Once this fix is used on a disk volume, the disk then can be dismounted with the DISMOUNT/ABORT command.
The Cancel Disk MV page is shown in Figure 6.20, ''Cancel Disk MV''.
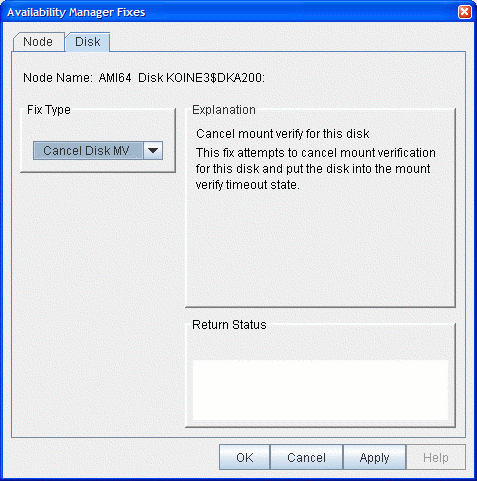
After reading the explanation on the page, click at the bottom of the page to apply the fix. A message displayed on the page indicates that the fix has been successful.
6.4.2. Cancel Shadow Set Mount Verification
The Cancel Shadow Set Mount Verification (SSM MV) fix forces the ejection of an unavailable shadow set member from a shadow set that is in a mount verify state.
The Cancel SSM MV fix is useful to regain use of a shadow set that is in a mount verify state because a shadow set member resides on a host node that has failed. This is especially useful where the shadow set contains the System Authorization file, and having the shadow set in a mount verify state prevents logins to the node or cluster.
This fix is the equivalent to the SET SHADOW/FORCE_REMOVAL command.
The Cancel SSM MV page is shown in Figure 6.21, ''Cancel SSM MV''.
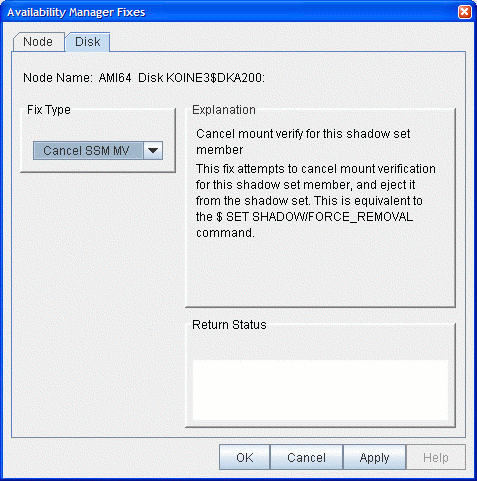
After reading the explanation on the page, click at the bottom of the page to apply the fix. A message displayed on the page indicates that the fix has been successful.
6.5. Performing Cluster Interconnect Fixes
Note
All cluster interconnect fixes require that managed objects be enabled. For more details on how to enable collection of managed object data, see the VSI Availability Manager Installation Instructions.
Port adjust priority fix
Circuit adjust priority fix
LAN virtual circuit (VC) summary fixes
LAN channel (path) fixes
LAN device fixes
The following sections describe these types of fixes. The descriptions also indicate whether or not the fix is currently available.
6.5.1. Port Adjust Priority Fix
To access the Port Adjust Priority fix, right-click a data item in the Local Port Data display line (see Figure 4.3, ''Port Summary Data''). The Data Analyzer displays a shortcut menu with the option.
The Port Adjust Priority page (see Figure 6.22, ''Port Adjust Priority'') allows you to change the cost associated with this port, which, in turn, affects the routing of cluster traffic.
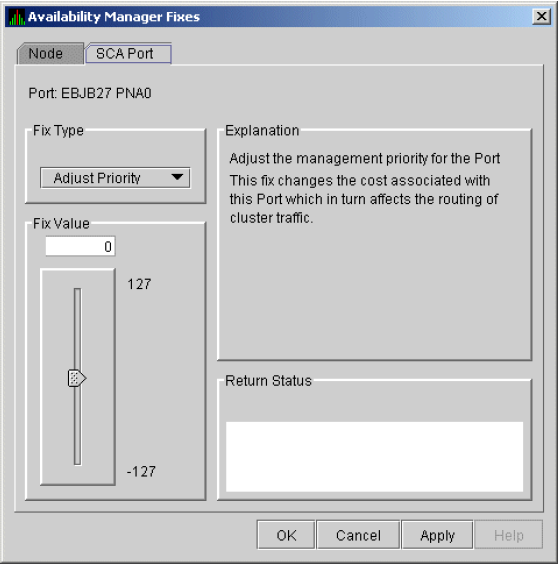
6.5.2. Circuit Adjust Priority Fix
To access the Circuit Adjust Priority fix, right-click a data item in the circuits data display line (see Figure 4.4, ''SCA Summary Data''). The Data Analyzer displays a shortcut menu with the option.
The Circuit Adjust Priority page (Figure 6.23, ''Circuit Adjust Priority'') allows you to change the cost associated with this circuit, which, in turn, affects the routing of cluster traffic.
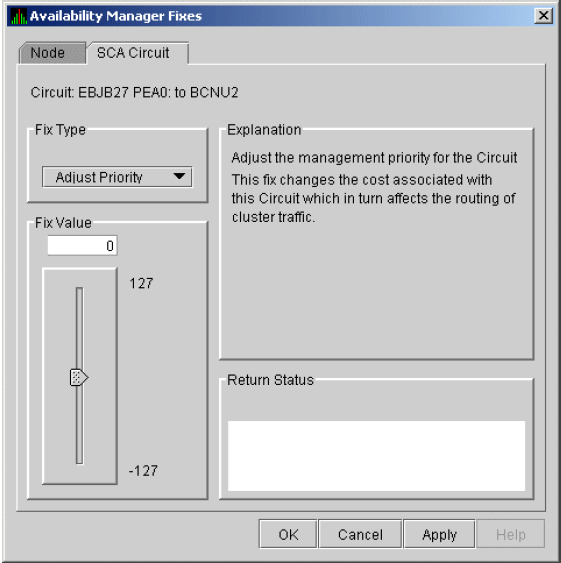
6.5.3. LAN Virtual Circuit Fixes
To access LAN virtual circuit fixes, right-click a data item in the LAN Virtual Circuit Summary category (see Figure 4.6, ''LAN Virtual Circuit Summary Data''), or use the menu on the LAN Device Details... page.
Channel Summary
VC LAN Details...
VC LAN Fix...
Maximum Transmit Window Size
Maximum Receive Window Size
Checksumming
Compression
ECS Maximum Delay
These fixes are described in the following sections.
6.5.3.1. LAN VC Checksumming Fix
The LAN VC Checksumming fix (Figure 6.24, ''LAN VC Checksumming'') allows you to turn checksumming on or off for the virtual circuit.
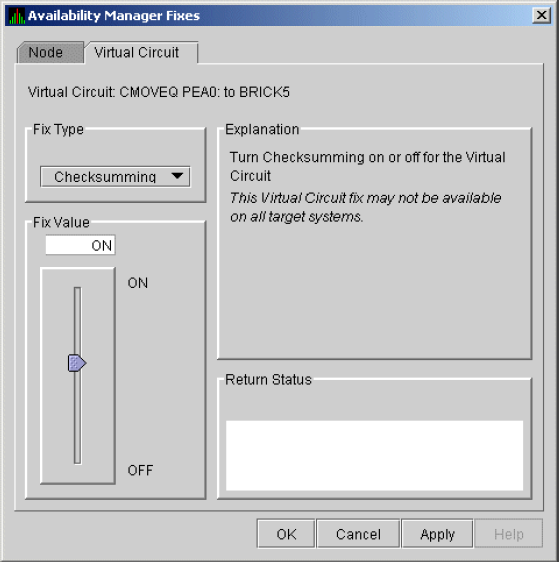
6.5.3.2. LAN VC Maximum Transmit Window Size Fix
The LAN VC Transmit Window Size fix (Figure 6.25, ''LAN VC Maximum Transmit Window Size'') allows you to adjust the maximum transmit window size for the virtual circuit.

6.5.3.3. LAN VC Maximum Receive Window Size Fix
The LAN VC Maximum Receive Window Size fix (Figure 6.26, ''LAN VC Maximum Receive Window Size'') allows you to adjust the maximum receive window size for the virtual circuit.
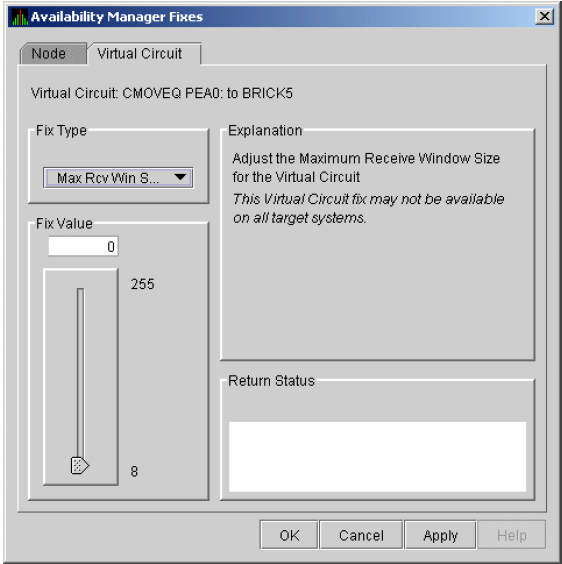
6.5.3.4. LAN VC Compression Fix
The LAN VC Compression fix (Figure 6.27, ''LAN VC Compression'') allows you to turn compression on or off for the virtual circuit. This fix, however, might not be available on all target systems.
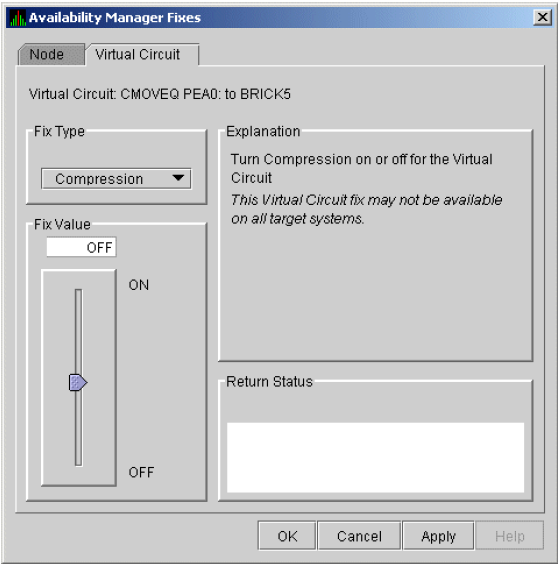
6.5.3.5. LAN VC ECS Maximum Delay Fix
The LAN VC ECS Maximum Delay fix (Figure 6.28, ''LAN VC ECS Maximum Delay'') sets a management-specific limit on the maximum delay (in microseconds) an ECS member channel can have. You can set a value between 0 and 3000000. Zero disables a prior management delay setting.
You can use this fix to override PEdriver automatically calculated delay thresholds. This ensures that all channels with delays less than the value supplied are included in the VC's ECS.
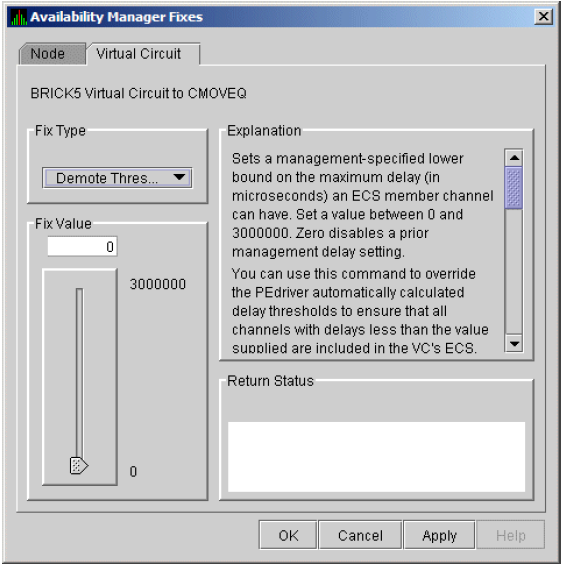
On the page shown in Figure 6.28, ''LAN VC ECS Maximum Delay'', you can scroll down to display the following text: "The fix operates as follows: Whenever at least none tight peer channel has a delay of less than the management-supplied value, all tight peer channels with delays less than the management-supplied value are automatically included in the ECS. When all tight peer channels have delays equal to or greater than the management setting, the ECS membership delay thresholds are automatically calculated and used.
You must determine an appropriate value for your configuration by experimentation. An initial value of 2000 (2ms) to 5000 (5ms) is suggested.
Caution
By overriding the automatic delay calculations, you can include a channel in the ECS whose average delay is consistently greater than 1.5 to 2 times the average delay of the fastest channels. When this occurs, the overall VC throughput becomes the speed of the slowest ECS member channel. An extreme example is when the management delay permits a 10Mb/sec Ethernet channel to be included with multiple 1Gb/sec channels. The resultant VC throughput drops to 10Mb/sec.
6.5.4. LAN Channel Fixes
Channel Details...
LAN Device Details...
Fixes...
Adjust Priority
Hops
Max Packet Size
These fixes are described in the following sections.
6.5.4.1. LAN Path (Channel) Adjust Priority Fix
The LAN Path (Channel) Adjust Priority fix (Figure 6.29, ''LAN Path (Channel) Adjust Priority'') allows you to change the cost associated with this channel by adjusting its priority. This, in turn, affects the routing of cluster traffic.
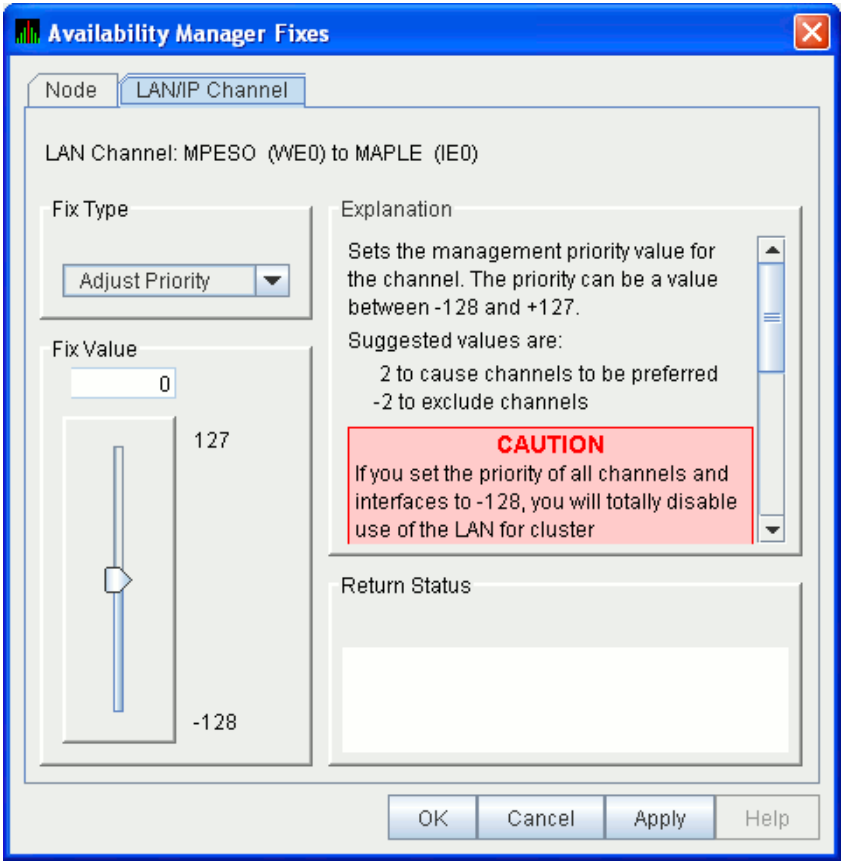
6.5.4.2. LAN Path (Channel) Hops Fix
LAN Path (Channel) Hops fix (Figure 6.30, ''LAN Path (Channel) Hops'') allows you to change the hops for the channel. This change, in turn, affects the routing of cluster traffic.
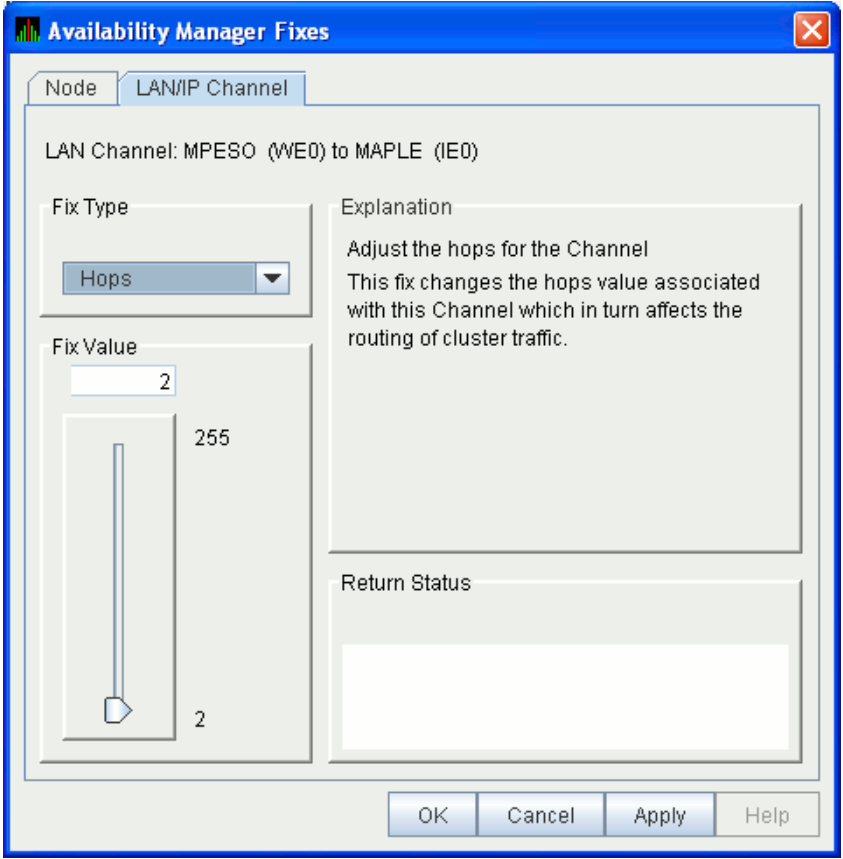
6.5.5. LAN Device Fixes
Channel Details...
LAN Device Details...
Fixes...
Select to display the LAN Device Details window. From the Device Details window, select from the menu. (These fixes are also accessible from the LAN Device Summary page.)
- Adjust Priority
- Set Max Buffer Size
- Start LAN Device
- Stop LAN Device
These fixes are described in the following sections.
6.5.5.1. LAN Device Adjust Priority Fix
The LAN Device Adjust Priority fix (Figure 6.31, ''LAN/IP Device Adjust Priority'') allows you to adjust the management priority for the device. This fix changes the cost associated with this device, which, in turn, affects the routing of cluster traffic.
Starting with OpenVMS Version 7.3-2, a channel whose priority is -128 is not used for cluster communications. The priority of a channel is the sum of the management priority assigned to the local LAN device and the channel itself. Therefore, you can assign any combination of channel and LAN device management priority values to arrive at a total of -128.
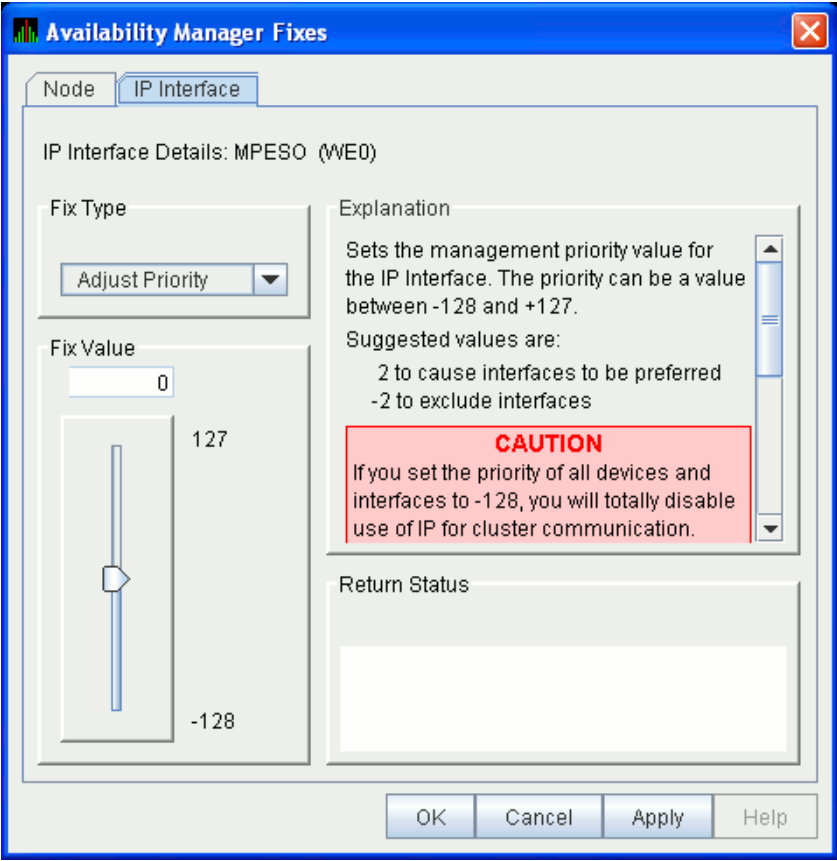
6.5.5.2. LAN Device Set Maximum Buffer Fix
The LAN Device Set Maximum Buffer fix (Figure 6.32, ''LAN Device Set Maximum Buffer Size'') allows you to set the maximum packet size for the device, which changes the maximum packet size associated with this channel. This change, in turn, affects the routing of cluster traffic.
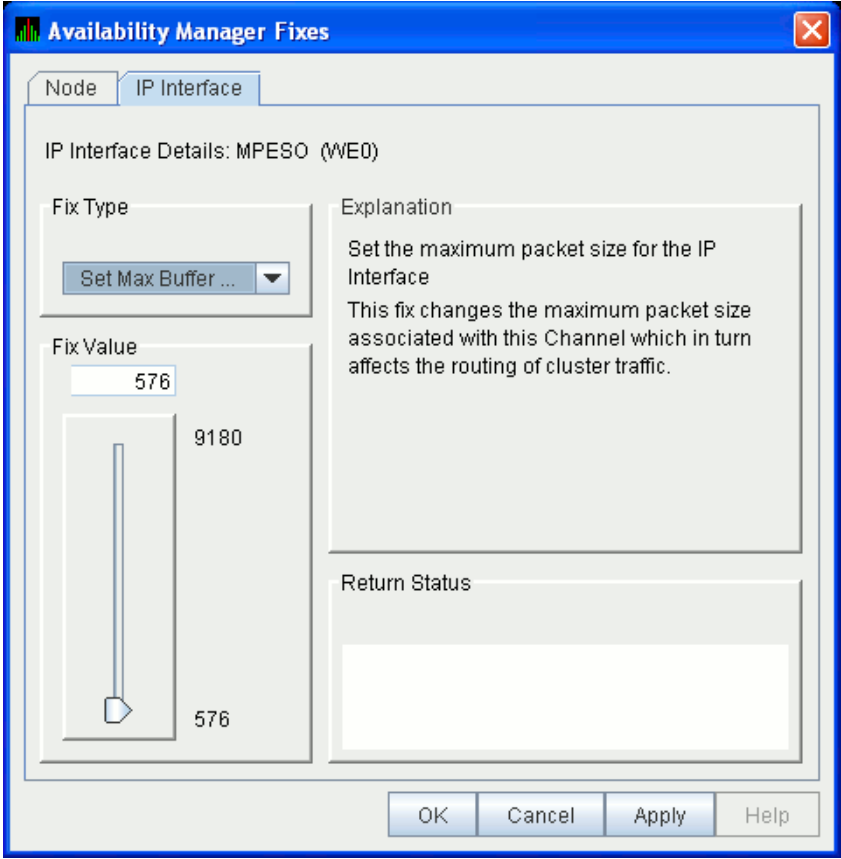
6.5.5.3. LAN Device Start Fix
The LAN Device Start fix (Figure 6.33, ''LAN/IP Device Start'') starts the use of this particular LAN device. This fix allows you, at the same time, to enable this device for cluster traffic.
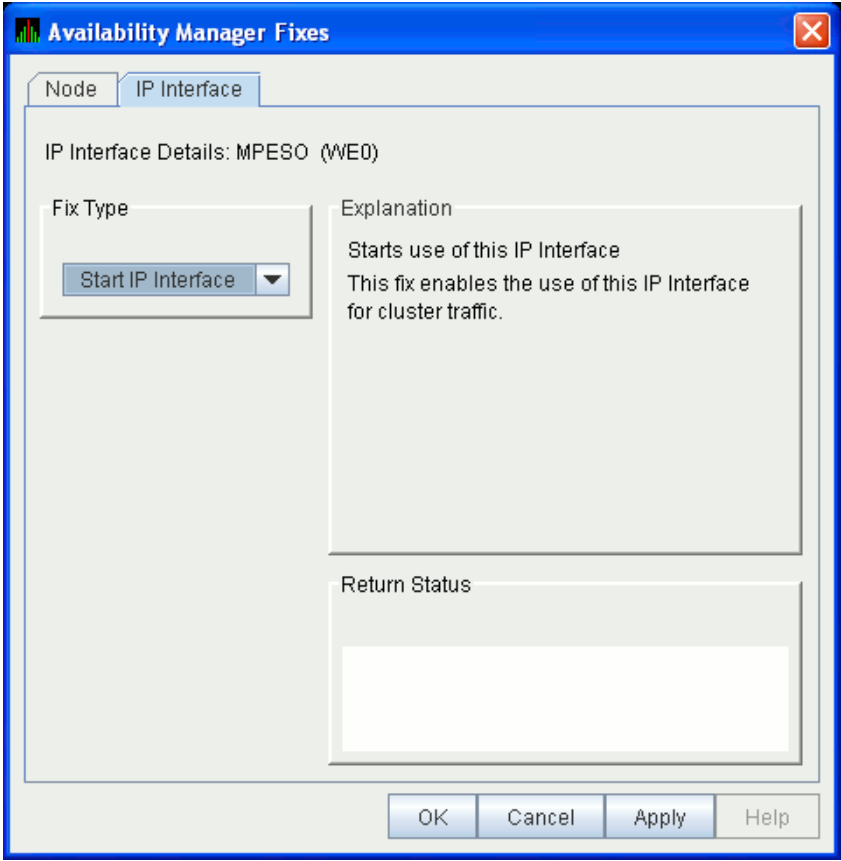
6.5.5.4. LAN Device Stop Fix
Caution
This fix could result in interruption of cluster communications for this node. The node might exit the cluster (CLUEXIT crash).
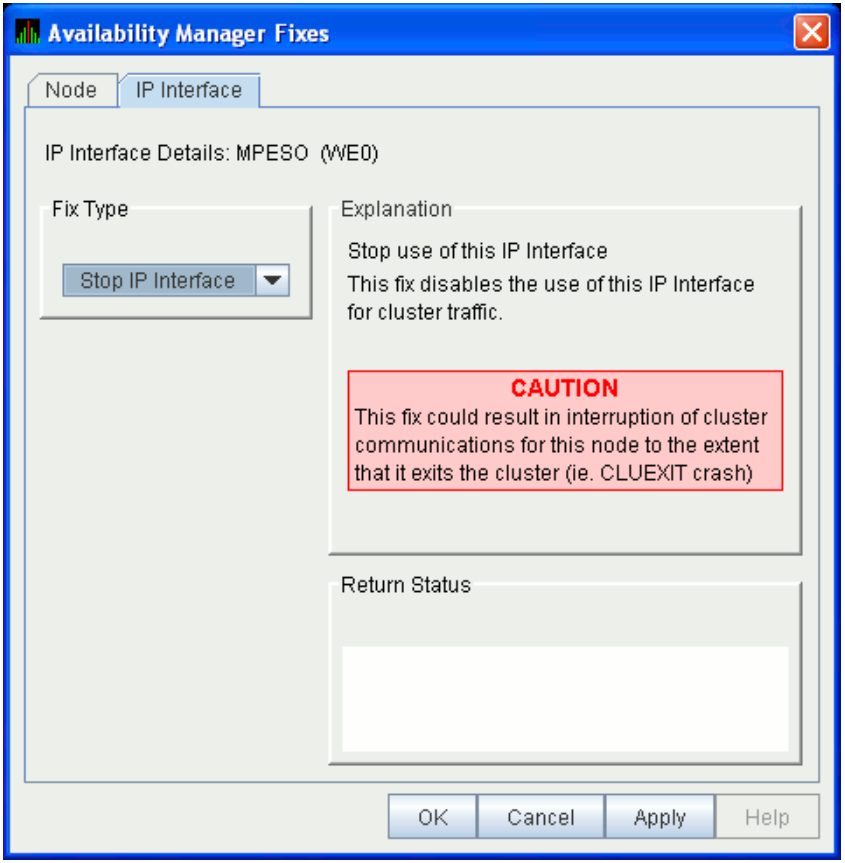
Chapter 7. Customizing the Availability Manager Data Analyzer
|
Feature |
Description |
|---|---|
|
Nodes or node groups |
You can select one or more groups or individual nodes to monitor. |
|
Data collection |
For OpenVMS nodes, you can choose the types of data you want to collect as well as set several types of collection intervals. (On Windows nodes, specific types of data are collected by default.) |
|
Data filters |
For OpenVMS nodes, you can specify a number of parameters and values that limit the amount of data that is collected. |
|
Event escalation |
You can customize the way events are displayed in the Event pane of the System Overview window (Figure 2.30, ''System Overview Window''), and you can configure events to be signaled to OPCOM. |
|
Event filters |
You can specify the severity of events that are displayed as well as several other filter settings for events. |
|
Security |
On Data Analyzer and Data Collector nodes, you can change passwords. On OpenVMS Data Collector nodes, you can edit a file that contains security triplets. |
|
Watch process |
You can specify up to eight processes for the Data Analyzer to monitor and report on if they exit and also if they subsequently are created. |
In addition, you can change the group membership of nodes, as explained in Sections 7.4.1 and 7.4.2.
|
Customizable Features |
Application |
Operating System |
Group |
Node |
|---|---|---|---|---|
|
Nodes or node groups |
X | |||
|
Data collection |
X |
X |
X | |
|
Data filters |
X |
X |
X | |
|
Event escalation |
X |
X |
X |
X |
|
Event filters |
X |
X |
X | |
|
Security |
X |
X |
X | |
|
Watch process |
X |
X |
X |
7.1. Understanding Levels of Customization
Application
Operating System
Group
Node
In addition to the four levels of customization are Availability Manager Data Analyzer Defaults (AM Defaults), which are top-level, built-in values that are preset (hardcoded) within the Availability Manager Data Analyzer. Users cannot change these settings themselves. If no customizations are made at any of the four levels, the AM Default values are used.
Application values override AM Defaults for nodes and groups of nodes as well as event escalation (unless overriding customization are made at the operating system, group, or node levels).
Operating system values override Application values for event escalation. Operating System values override AM Defaults for the remaining features shown in Table 7.1, ''Levels of Customization''.
Group values override Operating System and Application values as well as AM Defaults.
Node values override Group, Operating System, and Application values, as well as AM Defaults.
Any of these four levels of customization overrides AM Defaults. Also, customizing values at any successive level overrides the value set at the previous level. For example, customizing values for Data filters at the Group level overrides values for Data filters set at the Operating System level. Similarly, customizing values for Data filters at the Node level overrides values for Data filters set at the Group level.
7.1.1. Recognizing Levels of Customization
The customization levels for various Data Analyzer values are displayed as icons on some pages. The OpenVMS Data Collection Customization page (Figure 7.1, ''OpenVMS Data Collection Customization'') displays several of these icons.
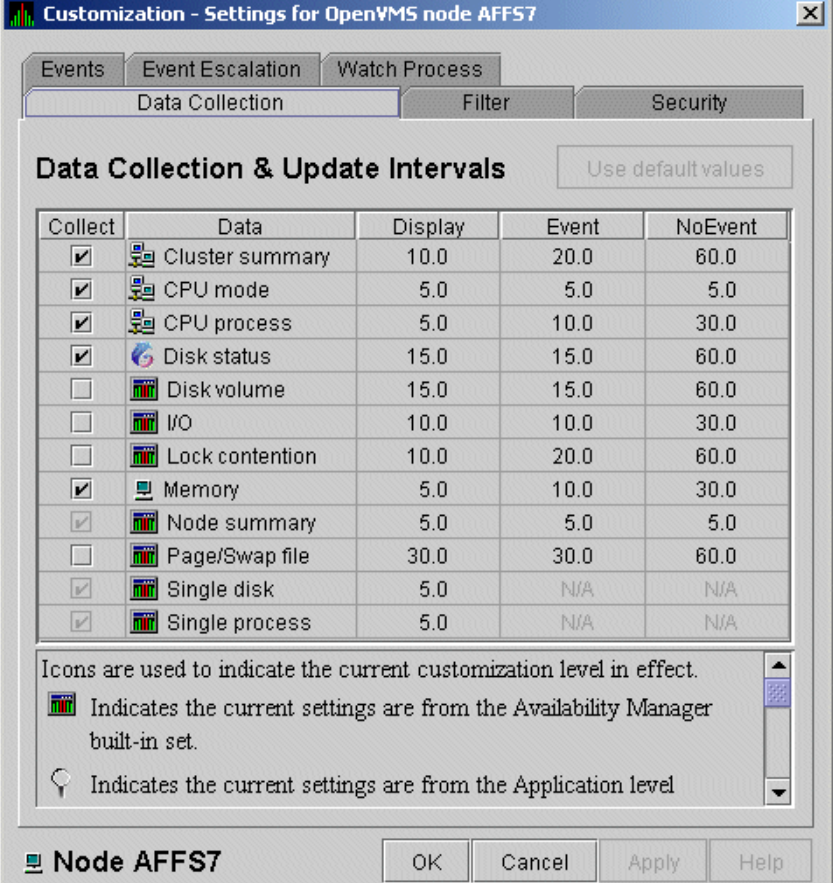
|
Icon |
Location |
Meaning |
|---|---|---|
|
Graph |
Before "Disk volume" |
Current setting is from the built-in AM Defaults. |
|
Magnifying glass |
Bottom left of window |
Current setting is from the Application level. |
|
Swoosh |
Before "Disk status" |
Current setting has been modified at the OpenVMS Operating System Level. |
|
Double monitors |
Before "Cluster summary" |
Current setting has been modified at the group level. |
|
Single monitor |
Before "Memory" |
Current setting has been modified at the node level. |
7.1.2. Setting Levels of Customization
When you customize values, the Data Analyzer keeps track of the next higher level of each value. This means that you can reset a value to the value set at the next higher level.
To return to the values set at the preceding level, click the button at the top of a customization page. The icon on the button and explanation at the bottom of the page indicate the previous customization level.
In the main System Overview window (see Figure 2.30, ''System Overview Window''), you can select the customization levels that are shown in Table 7.1, ''Levels of Customization''. The following sections explain levels of customization in more detail.
7.1.3. Knowing the Number of Nodes Affected by Each Customization Level
|
Nodes Affected |
Action |
|---|---|
|
All nodes |
Select on the menu shown in Figure 7.2, ''Application and Operating System Customization Menu''. |
|
All Windows nodes |
Select → on the menu shown in Figure 7.2, ''Application and Operating System Customization Menu''. |
|
All OpenVMS nodes |
Select → on the menu shown in Figure 7.2, ''Application and Operating System Customization Menu''. |
|
Nodes in a group |
Select on the shortcut menu shown in Figure 7.7, ''Group Customization Menu''. The customization options you choose affect only the group of nodes that you select. |
|
One node |
Select on the shortcut menu shown in Figure 7.8, ''Node Customization Menu'' or on the shortcut menu on the Node page. The customization options you choose affect only the node that you select. |
7.2. Customizing Settings at the Application and Operating System Levels
In the System Overview window menu bar, select . The Data Analyzer displays the shortcut menu shown in Figure 7.2, ''Application and Operating System Customization Menu''.
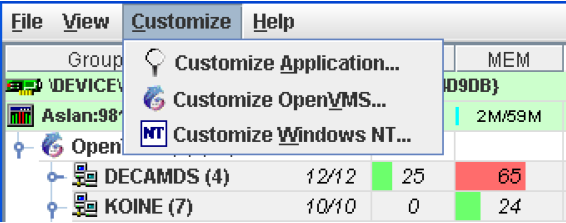
7.2.1. Customizing Application Settings
Note
The Event Escalation tab displayed on the Application Settings page (Figure 7.3, ''Application Settings – Groups/Nodes Inclusion'') is explained in Section 7.7, ''Customizing Event Escalation''.
7.2.1.1. Application Settings – Groups/Nodes Inclusion Page
On the Groups/Nodes Inclusion page (Figure 7.3, ''Application Settings – Groups/Nodes Inclusion'') you can select groups of nodes or individual nodes to be displayed.
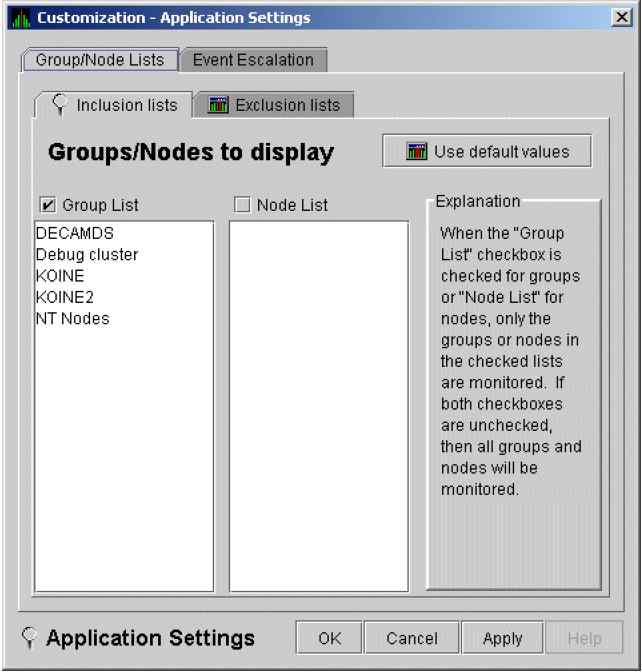
Group List
Select the Group List checkbox. Then enter the names of the groups of nodes you want to monitor. (The names are case-sensitive, so be sure to enter the correct case.)
For instructions for changing the group membership of a node, see Section 7.4.1, ''Changing the Group of an OpenVMS Node'' and Section 7.4.2, ''Changing the Group of a Windows Node''.
Node List
Select the Node List checkbox. Then enter the names of individual nodes you want to monitor. (The names are case-sensitive, so be sure to enter the correct case.)
Both Group List and Node List
If you select both checkboxes, you can enter the names of groups of nodes as well as individual nodes you want to monitor. (If you enter the name of an individual node, the Data Analyzer displays the name of the group that the node is in, but no additional nodes in that group.)
Neither list
The Group List and Node List are not used; all groups and all nodes are monitored.
If you decide to return to the default (Group List: DECAMDS) or to enter names again, select Use default values.
|
Option |
Description |
|---|---|
|
OK |
Accepts the choice of names you have entered and exits the page. |
|
Cancel |
Cancels the choice of names and does not exit the page. |
|
Apply |
Accepts the choice of names you have entered but does not exit the page. |
If nodes were previously selected for monitoring, their names are not removed from the display even if you click OK or Apply. They are filtered out the next time the Data Analyzer is started.
7.2.1.2. Application Settings – Groups/Nodes Exclusion Lists
As an alternative to the Inclusion lists on the Groups/Nodes Inclusion page, you can click the Exclusion lists tab in Figure 7.4, ''Application Settings – Groups/Nodes Exclusion Lists'', where you can select groups of nodes or individual nodes to be excluded from display.
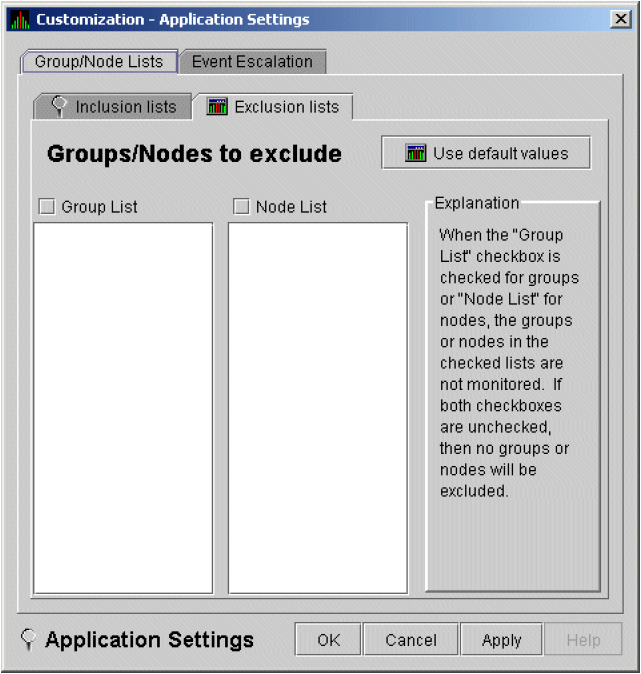
Group List
Select the Group List checkbox. Then enter the names of the groups of nodes you want to exclude from monitoring. (The names are case-sensitive, so be sure to enter the correct case.)
For instructions on changing the group membership of a node, see Section 7.4.1, ''Changing the Group of an OpenVMS Node'' and Section 7.4.2, ''Changing the Group of a Windows Node''.
Node List
Select the Node List checkbox. Then enter the names of individual nodes you want to exclude from monitoring. (The names are case-sensitive, so be sure to enter the correct case.)
Both Group List and Node List
If you select both checkboxes, you can enter the names of groups of nodes as well as individual nodes you want to exclude from monitoring. (If you enter the name of an individual node, the Data Analyzer displays the name of the group that the node is in, but no additional nodes in that group.)
Neither box
The Group List and Node List are not used; all groups and all nodes are monitored.
|
Option |
Description |
|---|---|
|
OK |
Accepts the choice of names you have entered and exits the page. |
|
Cancel |
Cancels the choice of names and does not exit the page. |
|
Apply |
Accepts the choice of names you have entered but does not exit the page. |
If nodes were previously selected for monitoring, their names are not removed from the display even if you click or to exclude them from monitoring. They are filtered out the next time the Data Analyzer is started.
7.2.2. Customizing Windows Operating System Settings
When you select , the Data Analyzer displays a page similar to the one shown in Figure 7.5, ''Windows Operating System Customization''.
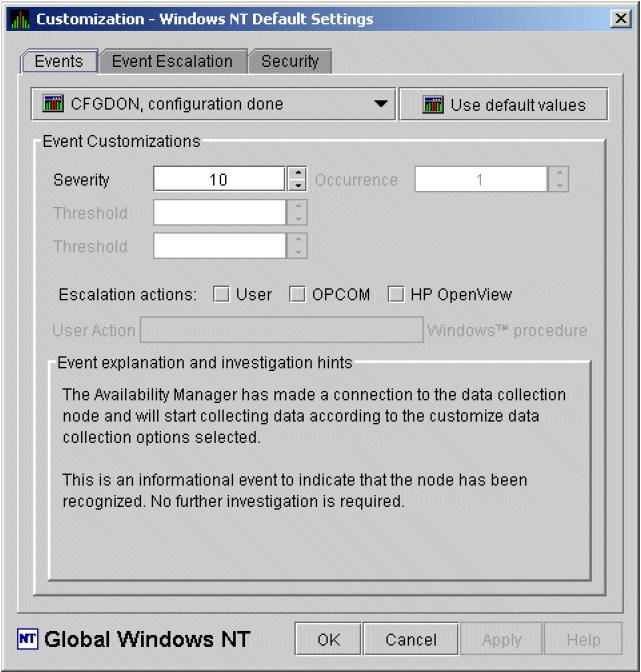
The default page displayed is the Event Customization page. Instructions for using this page are in Section 7.8.1, ''Customizing Events''. The other tabs displayed are the Event Escalation page, which is explained in Section 7.7, ''Customizing Event Escalation'', and the Windows Security Customization page, which is explained in Section 7.9.2.2, ''Changing a Data Analyzer Password for a Windows Data Collector Node''.
7.2.3. Customizing OpenVMS Operating System Settings
When you select , the Data Analyzer displays the pages shown in Figure 7.6, ''OpenVMS Operating System Customization'', which contains tabs for the last six types of customization listed in Table 7.1, ''Levels of Customization''. (Instructions for making these types of customizations are later in this chapter, beginning in Section 7.5, ''Customizing OpenVMS Data Collection''.)
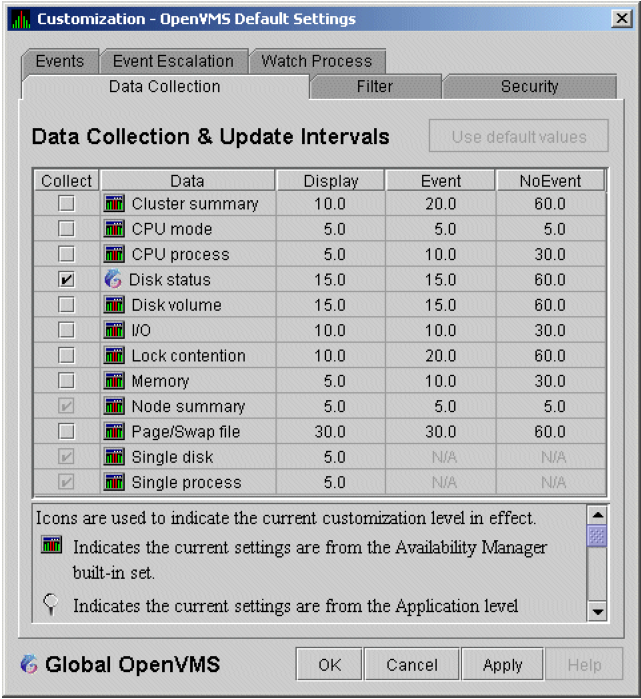
7.3. Customizing Settings at the Group Level
To perform customizations at the group level, right-click a group name in the System Overview window. The Data Analyzer displays a small menu similar to the one shown in Figure 7.7, ''Group Customization Menu''.
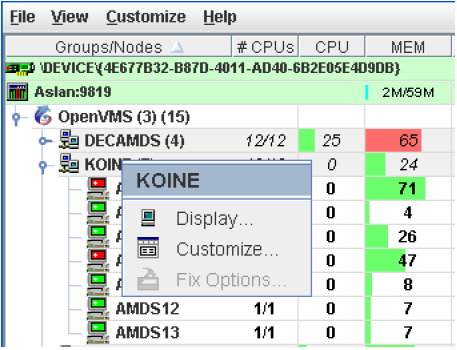
When you select , the Data Analyzer displays a page similar to the one shown in Figure 7.6, ''OpenVMS Operating System Customization''.
7.4. Customizing Settings at the Node Level
Select the option at the top of the Group/Node page.
Right-click a node name in the Node pane of the System Overview window (see Figure 2.30, ''System Overview Window'').
The Data Analyzer displays the shortcut menu shown in Figure 7.8, ''Node Customization Menu''.
Note
You can customize nodes in any state.
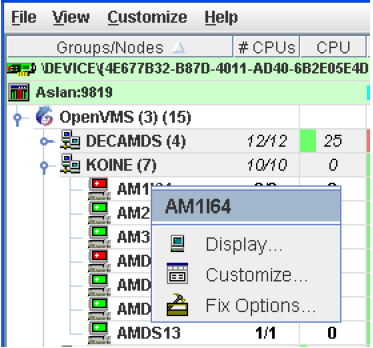
When you select , the Data Analyzer displays a customization page similar to the one shown in Figure 7.6, ''OpenVMS Operating System Customization''.
7.4.1. Changing the Group of an OpenVMS Node
Note
You need to place nodes that are in the same cluster in the same group. If such nodes are placed in different groups, some of the data collected might be misleading.
- Assign a unique name of up to 15 alphanumeric characters to the AMDS$GROUP_NAME logical name in the AMDS$AM_SYSTEM:AMDS$LOGICALS.COM file. For example:
$ AMDS$DEF AMDS$GROUP_NAME FINANCE ! Group FINANCE; OpenVMS Cluster ! alias - Apply the logical name by restarting the Data Collector:
$ @SYS$STARTUP:AMDS$STARTUP RESTART
7.4.2. Changing the Group of a Windows Node
Note
These instructions apply to versions prior to Version 2.0-1.
Click the Windows Start button. On the menu displayed, first select Programs, then Accessories, and then Command Prompt.
Type REGEDIT after the angle prompt (>).
The system displays a screen for the Registry Editor, with a list of entries under My Computer.
On the list displayed, expand the HKEY_LOCAL_MACHINE entry.
Double-click SYSTEM.
Click CurrentControlSet.
Click Services.
Click damdrvr.
Click Parameters.
Double-click Group Name. Then type a new group name of 15 alphanumeric characters or fewer, and click OK to make the change.
On the Control Panel, select Services, and then select Stop for "PerfServ."
Again on the Control Panel, select Devices, and then select Stop for "damdrvr."
First restart damdrvr under "Devices," and then restart PerfServ under "Services."
This step completes the change of groups for this node.
7.5. Customizing OpenVMS Data Collection
When you choose the menu option in the System Overview window (see Figure 7.2, ''Application and Operating System Customization Menu''), by default the Data Analyzer displays the OpenVMS Data Collection Customization page (Figure 7.9, ''OpenVMS Data Collection Customization'') where you can select types of data you want to collect for all of the OpenVMS nodes you are currently monitoring. You can also change the default Data Analyzer intervals at which data is collected or updated.
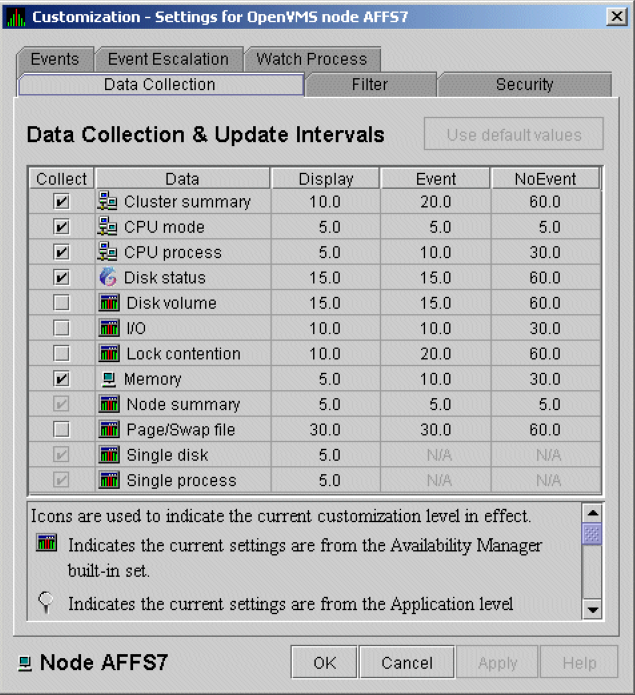
Note
When you select a type of data collection, an icon appears on the button indicating the previous (higher) level of customization where customizations might have been made. Pressing the button followed by the button causes any customizations made at the current level to be discarded and the values from the previous collection to be used.
You can select more than one collection choice using the Shift and/or Ctrl keys. In this case, none of the icons appear on the button. Pressing the button causes each selected collection choice to be reset to the value at its own previous level of customization.
|
Data Collected |
Background Data Collection Default |
Page Where Data Is Displayed |
|---|---|---|
|
Cluster summary |
No |
Cluster Summary page |
|
CPU mode |
No |
CPU Modes Summary page |
|
CPU summary |
No |
CPU Process States page |
|
Disk status |
No |
Disk Status Summary page |
|
Disk volume |
No |
Disk Volume Summary page |
|
I/O data |
No |
I/O Summary page |
|
Lock contention |
No |
Lock Contention page |
|
Memory |
No |
Memory Summary page |
|
Node summary |
Yes |
Node pane, Node Summary page, and the top pane of the CPU, Memory, and I/O pages |
|
Page/Swap file |
No |
I/O Page Faults page |
|
Single disk |
Yes? |
Single Disk Summary page |
|
Single process |
Yes? |
Data collection for the Process Information page |
|
Interval Name |
Description |
|---|---|
|
Display |
How often the data is collected when its corresponding display is active. |
|
Event |
How often the data is collected when its corresponding display is not active and when events are active. |
|
NoEvent |
How often the data is collected when its corresponding display is not active and when events are not active. |
You can enter a different collection interval by selecting a row of data and selecting a value. Then delete the old value and enter a new one.
If you change your mind and decide to return to the default collection interval, select one or more rows of data items, and then select . The system displays the default values for all the collection intervals.
|
Option |
Description |
|---|---|
|
OK |
To confirm any changes you have made and exit the page. |
|
Cancel |
To cancel any changes you have made and exit the page. |
|
Apply |
To confirm and apply any changes you have made and not exit the page. |
7.6. Customizing OpenVMS Data Filters
CPU
Disk Status
Disk Volume
I/O
Lock Contention
Memory
Page/Swap File
Filters can vary depending on the type of data collected. For example, filters might be process states or a variety of rates and counts. The following sections describe data filters that are available for various types of data collection.
You can also customize filters at the group and node levels (see Section 7.1, ''Understanding Levels of Customization'').
Keep in mind that the customizations that you make at the various levels override the ones set at the previous level (see Table 7.1, ''Levels of Customization''). The icons preceding each data item (see Table 7.2, ''Customization Icons in Figure 7.9, ''OpenVMS Data Collection Customization'''') indicate the level at which the data item was customized. In Figure 7.10, ''OpenVMS CPU Filters'', for example, the icon preceding "CPU" indicates that the current setting comes from the AM Defaults.
If you change your mind and decide to return to filter values set at the previous level, select . The icon appearing on the button indicates the level of the previous values. In Figure 7.10, ''OpenVMS CPU Filters'', for example, the previous value is the AM Defaults value.
|
Option |
Description |
|---|---|
|
OK |
To confirm any changes you have made and exit the page. |
|
Cancel |
To cancel any changes you have made and exit the page. |
|
Apply |
To confirm and apply any changes you have made and continue to display the page. |
7.6.1. OpenVMS CPU Filters
When you select CPU on the Filter tabs, the Data Analyzer displays the OpenVMS CPU Filters page (Figure 7.10, ''OpenVMS CPU Filters'').
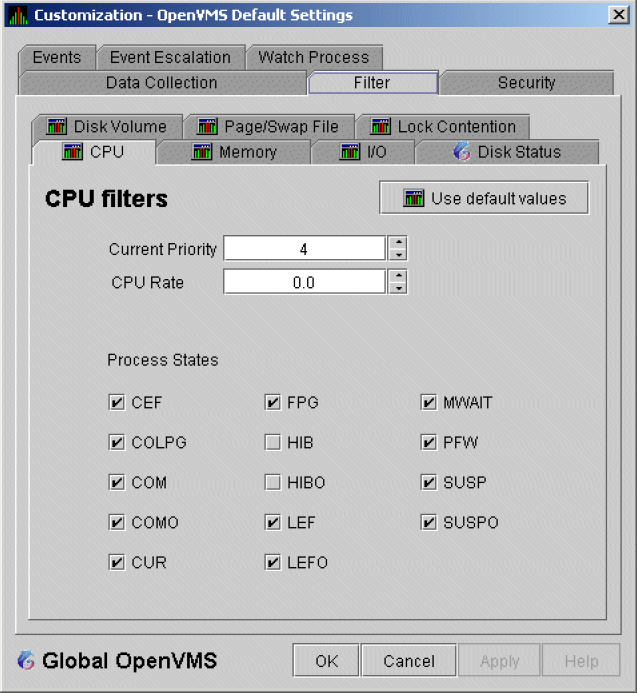
The OpenVMS CPU Filters page allows you to change and select values that are displayed on the OpenVMS CPU Process States page (Figure 3.8, ''OpenVMS CPU Process Summary Pane'').
You can change the current priority and rate of a process. By default, a process is displayed only if it has a Current Priority of 4 or more. Click the up or down arrow to increase or decrease the priority value by one. The default CPU rate is 0.0, which means that processes with any CPU rate used will be displayed. To limit the number of processes displayed, you can click the up or down arrow to increase or decrease the CPU rate by .5 each time you click.
The OpenVMS CPU Filters page also allows you to select the states of the processes that you want to display on the CPU Process States page. Select the checkbox for each state you want to display.(Process states are described in Appendix C, "Tables of Events".)
7.6.2. OpenVMS Disk Status Filters
When you select Disk Status on the Filter tabs, the Data Analyzer displays the OpenVMS Disk Status Filters page (Figure 7.11, ''OpenVMS Disk Status Filters'').
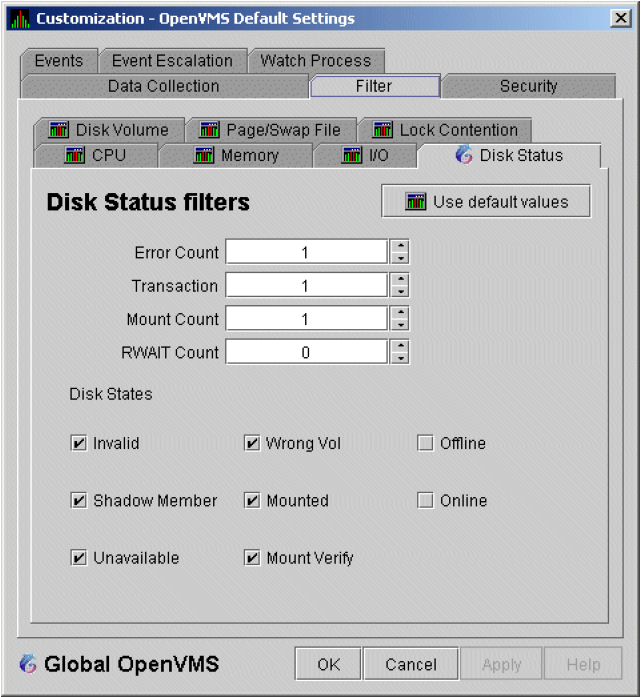
The OpenVMS Disk Status Summary page (Figure 3.14, ''OpenVMS Disk Status Summary'') displays the values you set on this page.
|
Data |
Description |
|---|---|
|
Error Count |
The number of errors generated by the disk (a quick indicator of device problems). |
|
Transaction |
The number of in-progress file system operations for the disk. |
|
Mount Count |
The number of nodes that have the specified disk mounted. |
|
RWAIT Count |
An indicator that a system I/O operation is stalled, usually during normal connection failure recovery or volume processing of host-based shadowing. |
|
Disk State |
Description |
|---|---|
|
Invalid |
Disk is in an invalid state (Mount Verify Timeout is likely). |
|
Shadow Member |
Disk is a member of a shadow set. |
|
Unavailable |
Disk is set to unavailable. |
|
Wrong Vol |
Disk was mounted with the wrong volume name. |
|
Mounted |
Disk is logically mounted by a MOUNT command or a service call. |
|
Mount Verify |
Disk is waiting for a mount verification. |
|
Offline |
Disk is no longer physically mounted in device drive. |
|
Online |
Disk is physically mounted in device drive. |
7.6.3. OpenVMS Disk Volume Filters
When you select Disk Volume on the Filter tabs, the Data Analyzer displays the OpenVMS Disk Volume Filters page (Figure 7.12, ''OpenVMS Disk Volume Filters'').
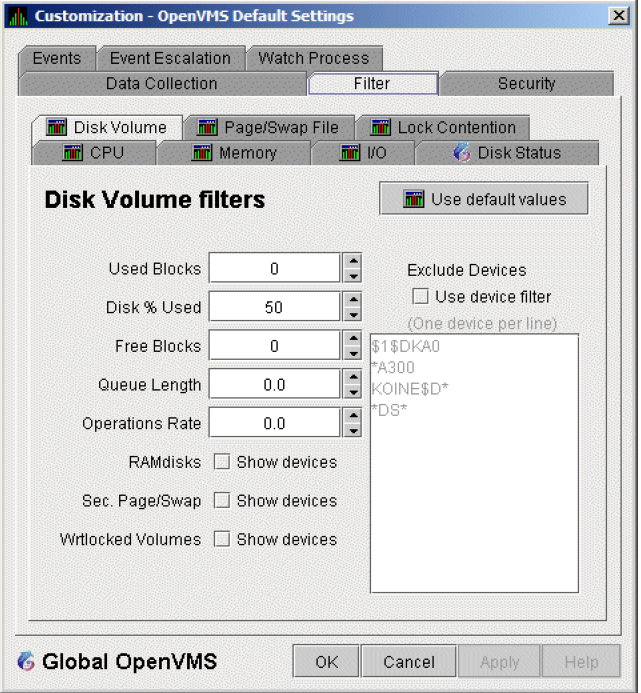
|
Data |
Description |
|---|---|
|
Used Blocks |
The number of volume blocks in use. |
|
Disk % Used |
The percentage of the number of volume blocks in use in relation to the total volume blocks available. |
|
Free Blocks |
The number of blocks of volume space available for new data. |
|
Queue Length |
Current length of I/O queue for a volume. |
|
Operations Rate |
The rate at which the operations count to the volume has changed since the last sampling. The rate measures the amount of activity on a volume. The optimal load is device specific. |
RAMdisks: Show devices
Sec. Page/Swap: Show devices
Secondary Page or Swap devices are disk volumes that have "PAGE" or "SWAP" in the volume name. This filter is useful for filtering out disks that are used only as page or swap devices.
Wrtlocked Volumes: Show devices (for example, CDROM devices)
Exclude Devices: Use device filter
You can exclude specific disk volumes by listing them in the Exclude Devices text box. You can use wildcards to specify the disk volumes. Four examples are shown in Figure 7.12, ''OpenVMS Disk Volume Filters''.
7.6.4. OpenVMS I/O Filters
When you select I/O on the Filter tabs, the Data Analyzer displays the OpenVMS I/O Filters page (Figure 7.13, ''OpenVMS I/O Filters'').
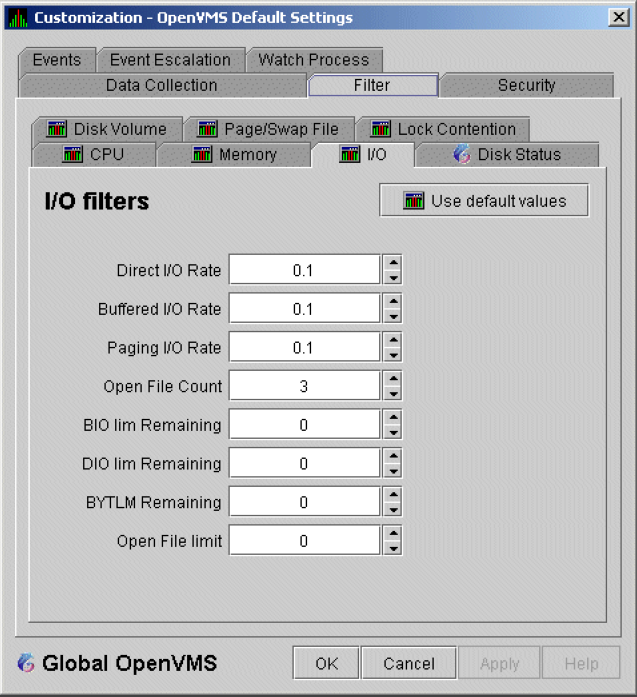
The OpenVMS I/O Summary page (Figure 3.12, ''OpenVMS I/O Summary'') displays the values you set on this filters page.
|
Data |
Description |
|---|---|
|
Direct I/O Rate |
The rate of direct I/O transfers. Direct I/O is the average percentage of time that the process waits for data to be read from or written to a disk or tape. The possible state is DIO. Direct I/O is usually disk or tape I/O. |
|
Buffered I/O Rate |
The rate of buffered I/O transfers. Buffered I/O is the average percentage of time that the process waits for data to be read from or written to a slower device such as a terminal, line printer, mailbox. The possible state is BIO. Buffered I/O is usually terminal, printer I/O, or network traffic. |
|
Paging I/O Rate |
The rate of read attempts necessary to satisfy page faults (also known as Page Read I/O or the Hard Fault Rate). |
|
Open File Count |
The number of open files. |
|
BIO lim Remaining |
The number of remaining buffered I/O operations available before the process reaches its quota. BIOLM quota is the maximum number of buffered I/O operations a process can have outstanding at one time. |
|
DIO lim Remaining |
The number of remaining direct I/O limit operations available before the process reaches its quota. DIOLM quota is the maximum number of direct I/O operations a process can have outstanding at one time. |
|
BYTLM Remaining |
The number of buffered I/O bytes available before the process reaches its quota. BYTLM is the maximum number of bytes of nonpaged system dynamic memory that a process can claim at onetime. |
|
Open File limit |
The number of additional files the process can open before reaching its quota. FILLM quota is the maximum number of files that can be opened simultaneously by the process, including active network logical links. |
7.6.5. OpenVMS Lock Contention Filters
The OpenVMS Lock Contention Filters page allows you to remove (filter out) resource names from the Lock Contention page (Figure 3.19, ''OpenVMS Lock Contention (Decoded Format)'').
When you select Lock Contention on the Filter tabs, the Data Analyzer displays the OpenVMS Lock Contention Filters page (Figure 7.14, ''OpenVMS Lock Contention Filters'').
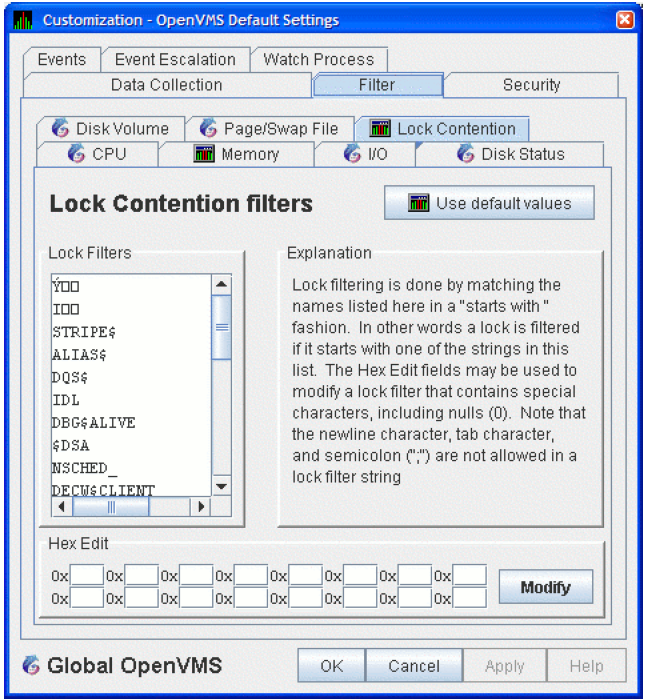
Each entry on the Lock Contention Filters page is a resource name or part of a resource name that you want to filter out. For example, the STRIPE$ entry filters out any value that starts with the characters STRIPE$. In the example of |** in Figure 7.14, ''OpenVMS Lock Contention Filters'', the two asterisks are literal asterisks, not wildcard characters.
To redisplay values set previously, select Use default values.
7.6.6. OpenVMS Memory Filters
When you select Memory Filters on the Filter tabs, the Data Analyzer displays an OpenVMS Memory Filters page that is similar to the one shown in (Figure 7.15, ''OpenVMS Memory Filters'').
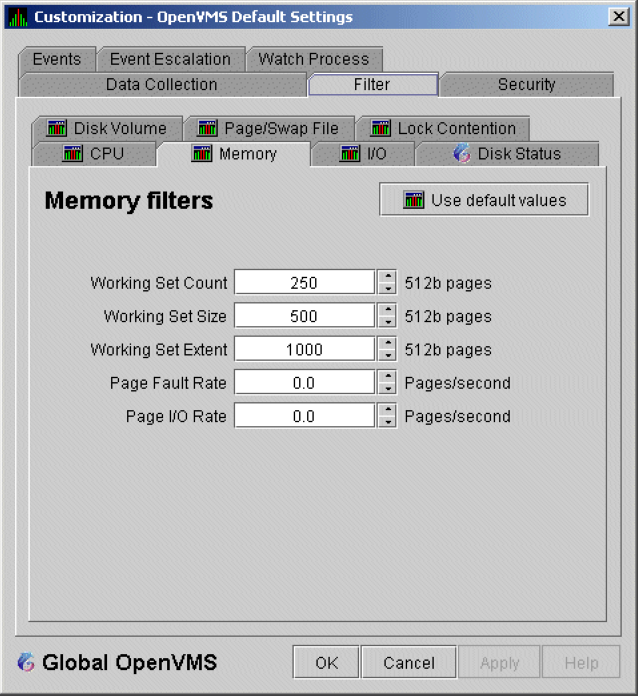
The OpenVMS Memory page (Figure 3.10, ''OpenVMS Memory Summary'') displays the values on this filter page.
|
Data |
Description |
|---|---|
|
Working Set Count |
The number of physical pages or pagelets of memory that the process is using. |
|
Working Set Size |
The number of pages or pagelets of memory the process is allowed to use. The operating system periodically adjusts this value based on an analysis of page faults relative to CPU time used. An increase in this value in large units indicates a process is receiving a lot of page faults and its memory allocation is increasing. |
|
Working Set Extent |
The number of pages or pagelets of memory in the process's WSEXTENT quota as defined in the user authorization file (UAF). The number of pages or pagelets will not exceed the value of the system parameter WSMAX. |
|
Page Fault Rate |
The number of page faults per second for the process. |
|
Page I/O Rate |
The rate of read attempts necessary to satisfy page faults (also known as page read I/O or the hard fault rate). |
7.6.7. OpenVMS Page/Swap File Filters
When you select Page/Swap File on the Filter tabs, the Data Analyzer displays the OpenVMS Page/Swap File Filters page (Figure 7.16, ''OpenVMS Page/Swap File Filters'').
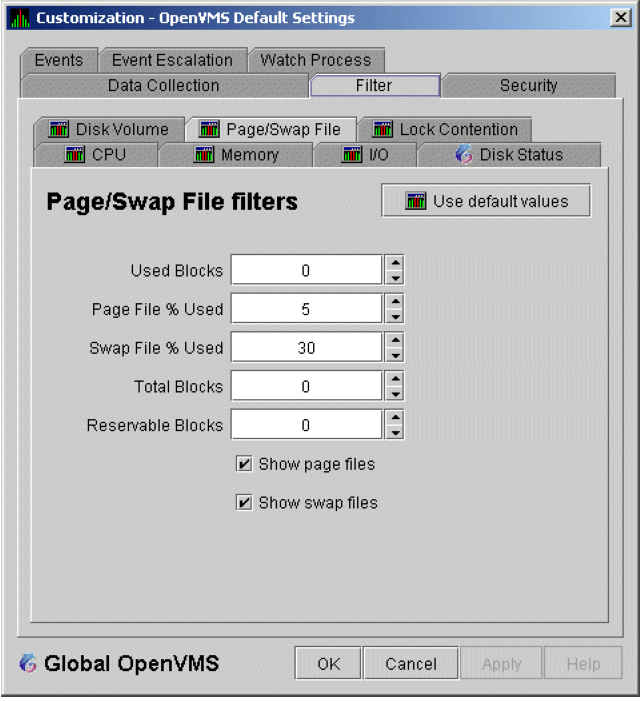
The OpenVMS I/O Summary page (Figure 3.12, ''OpenVMS I/O Summary'') displays the values that you set on this filter page.
|
Data |
Description |
|---|---|
|
Used Blocks |
The number of used blocks within the file. |
|
Page File % Used |
The percentage of the blocks from the page file that have been used. |
|
Swap File % Used |
The percentage of the blocks from the swap file that have been used. |
|
Total Blocks |
The total number of blocks in paging and swapping files. |
|
Reservable Blocks |
Number of reservable blocks in each page and swap file
currently installed. Reservable blocks can be logically
claimed by a process for a future physical allocation. A
negative value indicates that the file might be
overcommitted. Note that a negative value is not an
immediate concern, it indicates that the file might become
overcommitted if physical memory becomes scarce.
NoteReservable blocks are not used on OpenVMS Version 7.3-1 and later systems. |
Show page files
Show swap files
7.7. Customizing Event Escalation
Note
Event escalation is the one set of Data Analyzer parameters that you can adjust at all four configuration levels (Application, Operating System, Group, and Node).
When you select any of the customization options, the Data Analyzer displays a tabbed page similar to the one shown in Figure 7.17, ''Event Escalation Customization''.
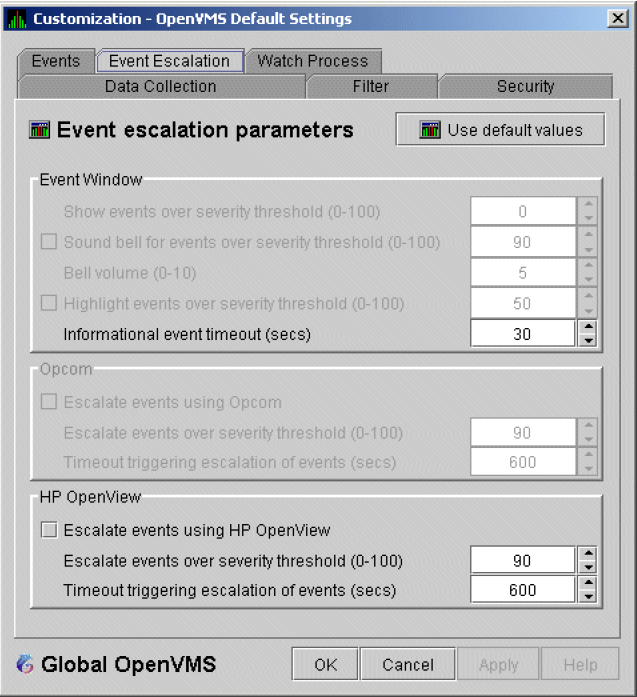
Event Window
With the exception of "Informational event timeout (secs)", the items in this section are dimmed because they have not yet been implemented. However, you can set the number of seconds that an informational event is displayed in the Event pane of the System Overview window (Figure 2.30, ''System Overview Window''). (The default is 30 seconds.)
OPCOM
The items in this section are dimmed if you are not using an OpenVMS system.
If you are using an OpenVMS system, you can check the box in the OPCOM section of the page and then enter two values that work together to determine whether an event is sent to OPCOM:Escalate events over severity threshold (0-100)
The severity level over which an event might be sent to OPCOM if the second criterion is met.
Timeout triggering escalation of events (secs)
The length of time, in seconds, that an event (over a severity threshold that you have entered) is displayed in the Event pane of the System Overview window (Figure 2.30, ''System Overview Window'') before the event is sent to OPCOM.
The following table compares Availability Manager and OPCOM severity levels:Availability Manager
OPCOM
0 – 19
Normal
20 – 39
Warning
40 – 59
Minor
60 – 79
Major
80 – 100
Critical
Important
On the Event Customizations page (Figure 7.18, ''Event Customizations''), the OPCOM box must be checked.
On the Event Escalation page (Figure 7.17, ''Event Escalation Customization''), the box in the OPCOM section of the page must be checked.
On the Event Escalation page (Figure 7.17, ''Event Escalation Customization''), the severity of an event must meet or exceed the corresponding severity threshold for the event, which is shown on the Event Customizations page (Figure 7.18, ''Event Customizations'').
The event must be displayed in the Event pane of the System Overview window (Figure 2.30, ''System Overview Window'') for the required length of time before the event is sent to OPCOM. (The default is 10 minutes.)
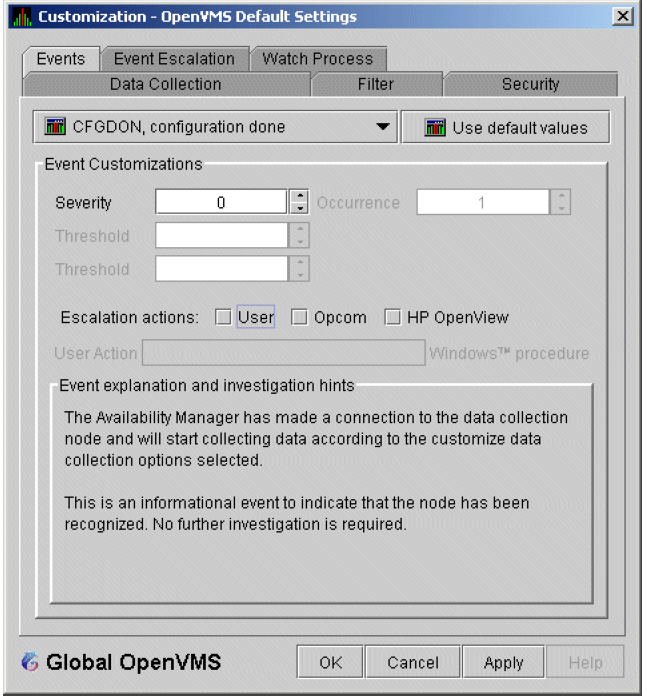
7.8. Customizing Events and User Notification of Events
You can customize a number of characteristics of the events that are displayed in the Event pane of the System Overview window (Figure 2.30, ''System Overview Window''). You can also use customization options to notify users when specific events occur.
When you select the → or → from the System Overview window menu, the Data Analyzer displays a tabbed page similar to the one shown in Figure 7.19, ''Event Customizations''.
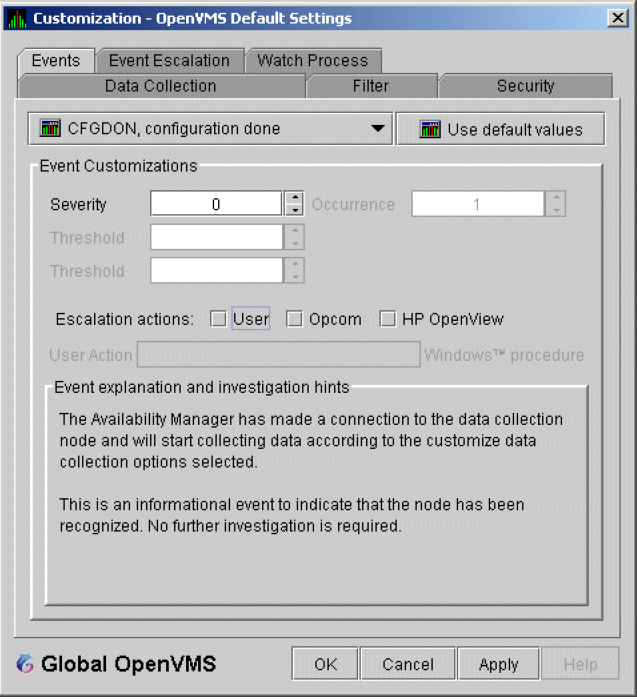
On OpenVMS systems, you can customize events at the operating system, group, or node level. On Windows systems, you can customize events at the operating system or node level.
Keep in mind that an event that you customize at the group level overrides the value set at a previous (higher) level (see Table 7.1, ''Levels of Customization'').
7.8.1. Customizing Events
|
Data |
Description |
|---|---|
|
Severity |
Controls the severity level at which events are displayed in the Event pane of the System Overview window (Figure 2.30, ''System Overview Window''). By default, all events are displayed. Increasing this value reduces the number of event messages in the Event pane of the System Overview window (Figure 2.30, ''System Overview Window'') and can improve perceived response time. |
|
Occurrence |
Each Availability Manager event is assigned an occurrence value, that is, the number of consecutive data samples that must exceed the event threshold before the event is signaled. By default, events have low occurrence values. However, you might find that a certain event indicates a problem only when it occurs repeatedly over an extended period of time. You can change the occurrence value assigned to that event so that the Data Analyzer signals the event only when necessary. For example, suppose page fault spikes are common in your
environment, and the Data Analyzer frequently signals
intermittent To avoid displaying insignificant events, you can customize an event so that the Data Analyzer signals it only when it occurs continuously. |
|
Threshold |
Most events are checked against only one threshold;
however, some events have dual thresholds: the event is
triggered if either one is true. For example, for the
LOVLSP, node disk volume free space is low
event, the Data Analyzer checks both of the following thresholds:
|
|
Escalation actions |
You can enter one or more of the following values:
|
|
User Action |
When the Event escalation action field is set to User, User Action is no longer dimmed. You can enter the name of a procedure to be executed if the event displayed at the top of the page occurs. To use this field, see the instructions in Section 7.8.2, ''Entering a User Action''. |
The "Event explanation and investigation hints" section of the Event Customizations page, which is not customizable, includes a description of the event displayed and suggestions for how to correct any problems that the event signals.
7.8.2. Entering a User Action
Note
OpenVMS and Windows execute the User Action procedure somewhat differently, as explained in the following paragraphs.
- The procedure that you specify as the User Action is executed in the following manner:
It is issued to the operating system that is running the Data Analyzer.
It is issued as a process separate from the one running the Data Analyzer to avoid affecting its operation.
It is run under the same account as the one running the Data Analyzer.
User Actions are intended to execute procedures that do not require interactive displays or user input.
- You can enter User Actions for events on either a systemwide basis or a per-node basis:
On a systemwide basis, the User Action is issued for an event that occurs on any node.
On a per-node basis, the User Action is issued for an event that occurs only on a specific node.
- If event logging is enabled, the Data Analyzer writes events to the event log file (called AnalyzerEvents.log by default on OpenVMS systems and Windows systems). A status line matching the original line indicates whether the User Action was successfully issued. For example:
AMGR/KOINE -- 13-Apr-2005 15:33:02.531 –-<0,CFGDON>KOINE configuration done
AMGR/KOINE -- 13-Apr-2005 15:33:02.531 --<0,CFGDON>KOINE configuration done
(User Action issued for this event on the client O/S)
Other events might appear between the first logging and the status line. The log file does not indicate whether the User Action executed successfully. You must obtain the execution status from the operating system, for example, the OpenVMS batch procedure log.
The User Action functionality might be enhanced in a future release of the Data Analyzer, but backward compatibility is not guaranteed for the format of User Action procedure strings or for the method of executing the procedures on a particular operating system.
7.8.2.1. Executing a Procedure on an OpenVMS System
Enter the name of the procedure you want OpenVMS to execute (see Figure 7.19, ''Event Customizations'') after User Action. Use the following format:
disk:[directory]filename.COM
disk is the name of the disk where the procedure resides.
directory is the name of the directory where the procedure resides.
filename.COM is the file name of the command procedure you want OpenVMS to execute. The file name must follow OpenVMS file-naming conventions.
The User Action procedure must contain one or more DCL command statements that form a valid OpenVMS command procedure.
The User Action procedure is passed as a string value to the DCL command interpreter as follows:
SUBMIT/NOPRINTER/LOG user_action_procedure arg_1 arg_2 arg_3 arg_4
The first command is the DCL command SUBMIT with associated qualifiers.
user_action_procedure is a valid OpenVMS file name.
- The arguments the Data Analyzer supplies to the User Action procedure are the following:
Argument
Description
arg_1
Node name of the node that generated the event.
arg_2
Date and time that the event was generated.
arg_3
Name of the event.
arg_4
Description of the event.
The Data Analyzer does not interpret the string contents. You can supply any content in the User Action procedure that DCL accepts in the OpenVMS environment for the user account running the Data Analyzer. However, if you include arguments in the User Action procedure, they might displace or overwrite arguments that the Data Analyzer supplies.
A suitable batch queue must be available on the Data Analyzer computer to be the target of the SUBMIT command. See the VSI OpenVMS DCL Dictionary for the SUBMIT, INITIALIZE/QUEUE, and START/QUEUE commands for use of batch queues and the queue manager.
DISK$PAYROLL:[AM_COMS]DISK_OFFLINE.COM$ if (p3.eqs."DSKOFF").and.(p1.eqs."PAYROL") $ then $ mail/subject="''p2' ''p3' ''p4'" urgent_instructions.txt call_center,finance,adams $ else $ mail/subject="''p2' ''p3' ''p4'" instructions.txt call_center $ endif
The pn numbers in the DCL procedure correspond in type, number, and position to the arguments in the preceding table.
You might use a procedure like this one to notify several groups if the payroll disk goes off line, or to notify the call center if any other event occurs.
7.8.2.2. Executing a Procedure on a Windows System
Enter the name of the procedure you want Windows to execute using the following format:
device:\directory\filename.BAT
device is the disk on which the procedure is located.
directory is the folder in which the procedure is located.
- filename.BAT is the name of the command file to be executed.
Note
The file name must follow Windows file-naming conventions. However, due to the processing of spaces in the Java JRE, VSI recommends that you not use spaces in a path or file name.
VSI recommends that you use a batch file to process and call procedures and applications.
The Data Analyzer passes the User Action procedure to the Windows command interpreter as a string value as follows:
"AT time CMD/C user_action_procedure arg_1 arg_2 arg_3 arg_4"
AT is the Windows command that schedules commands and programs at a specified time and date.
The time substring is a short period of time – approximately 2 minutes – in the future so that the AT utility processes the User Action procedure today rather than tomorrow. This is necessary because the AT utility cannot execute a procedure "now" rather than at an explicitly stated time.
user_action_procedure is a Windows command or valid file name. The file must contain one or more Windows command statements to form a valid command procedure. (See the example in this section.)
- The arguments are listed in the following table:
Argument
Description
arg_1
Node name of the node that generated the event.
arg_2
Date and time that the event was generated.
arg_3
Name of the event.
arg_4
Description of the event.
The Data Analyzer does not interpret the string contents. You can supply any content in the string that the Windows command-line interpreter accepts for the user account running the Data Analyzer. However, if you include arguments in the User Action procedure, they might displace or overwrite arguments that the Data Analyzer supplies.
You cannot specify positional command-line switches or arguments to the AT command, although you can include switches in the User Action procedure substring as qualifiers to the user-supplied command. This is a limitation of both the Windows command-line interpreter and the way the entire string is passed from the Data Analyzer to Windows.
The Schedule service must be running on the Data Analyzer computer in order to use the AT command. However, the Schedule service does not run by default. To start the Schedule service, see the Windows documentation.
Windows Example
Select an event on the Event Customizations page, for example, HIBIOR (see Figure 7.20, ''User Action Example'').
Change the Event escalation action to User.
- Enter the name of the program to run. For example:
c:\send_message.bat
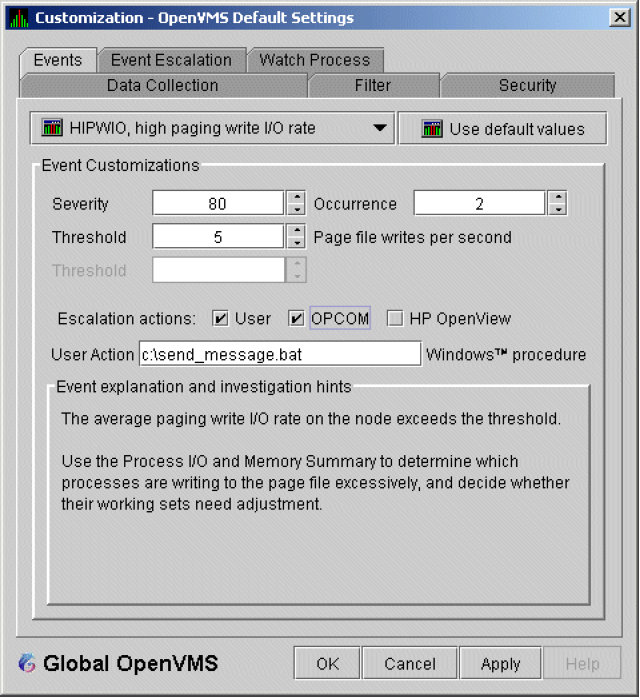
The command line parameters are automatically added when the Data Analyzer passes the command to the command processor.
net send affc17 "P4:system event: %1 %2 %3 %4"
On the target node, AFFC17, a message similar to the following one is displayed:
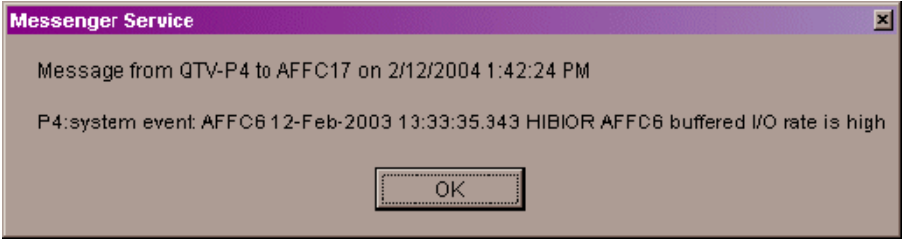
You can now apply the User Action to one node, all nodes, or a group of nodes, as explained in Section 7.8.2, ''Entering a User Action''.
7.9. Customizing Security Features
Passwords for groups and nodes
Data Analyzer passwords for OpenVMS and Windows Data Collector nodes
Security triplets on OpenVMS Data Collector nodes
Password on a Windows Data Collector node
Note
OpenVMS Data Collector nodes can have more than one password: each password is part of a security triplet. (Windows nodes allow you to have only one password per node.)
7.9.1. Customizing Passwords for Groups and Nodes
For both the Windows and OpenVMS Customization pages at the operating system, group, or node level is a page similar to the one shown in Figure 7.6, ''OpenVMS Operating System Customization''. It contains a tab labeled Security. If you select this tab on either system, the Data Analyzer displays a page similar to the one shown in Figure 7.21, ''OpenVMS Security Customization''.
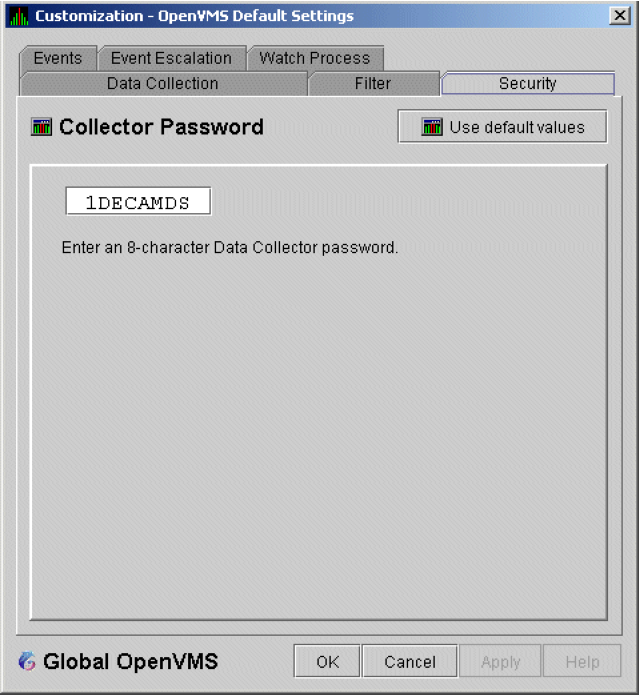
The level at which you can make password changes depends on whether you select the Security tab at the operating system, group, or node level.
Changing Passwords at the Group Level
If you monitor several groups, but the password for the nodes in one of those groups is different from the password for nodes in other groups, right-click the group you want to change, select from the list, select the Security tab, and change the password. The new password is then used for each node that is a member of that group.
Changing Passwords at the Node Level
As a second example, to change the password of one node in a group to a different password than the other nodes in the group, right-click that node, select from the list, select the Security tab, and change the password to one that differs from the other nodes in the group. For that node, the new password overrides the group password.
In the second password example, if you want to set the password for the single node back to the password that the rest of the group uses, click . The password value for the node now comes from the group-level password setting. At this point, if you change the group password, all nodes in the group get the new password. Additional information about changing passwords for security is in Section 7.9, ''Customizing Security Features''.
7.9.2. Changing Data Analyzer Passwords
You can change the passwords that the Windows Data Analyzer uses for OpenVMS Data Collector nodes and for Windows Data Collector nodes. The following sections explain how to perform both actions.
7.9.2.1. Changing a Data Analyzer Password for an OpenVMS Data Collector Node
When you select on the menu of the System Overview window, the Data Analyzer displays a default customization page. On it is a tab marked Security, which, if you select it, displays the OpenVMS Security Customization page (Figure 7.21, ''OpenVMS Security Customization'').
To change the default password for the Data Analyzer to use to access OpenVMS Data Collector nodes, enter a password of exactly 8 uppercase alphanumeric characters. The Data Analyzer uses this password to access OpenVMS Data Collector nodes. This password must match the password that is part of the OpenVMS Data Collector security triplet (Section 1.3.3, ''Changing Security Triplets on OpenVMS Data Collector Nodes'').
When you are satisfied with your password, click . Exit the Data Analyzer and restart the application for the password to take effect.
7.9.2.2. Changing a Data Analyzer Password for a Windows Data Collector Node
When you select on the menu of the System Overview window, the Data Analyzer displays a Windows Security Customization page (Figure 7.22, ''Windows Security Customization'').
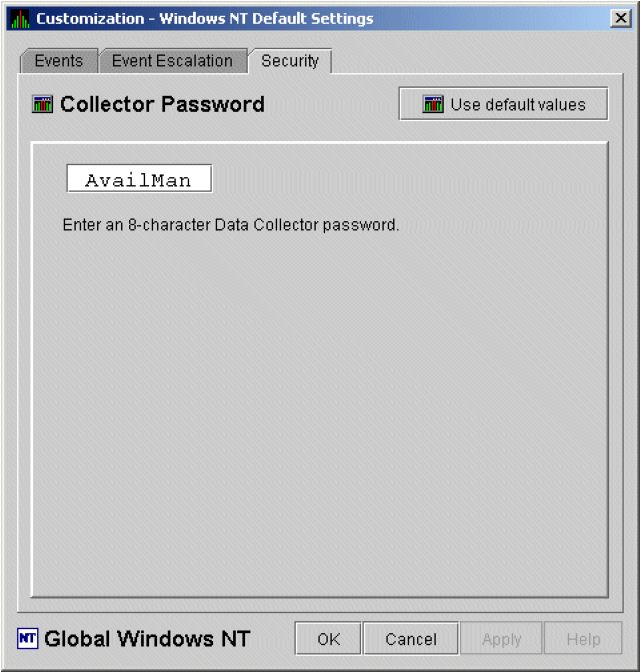
To change the default password for the Data Analyzer to use to access Windows Data Collector nodes, enter a password of exactly 8 alphanumeric characters. Note that this password is case sensitive; any time you type it, you must use the original capitalization.
This password must also match the password for the Windows Data Collector node that you want to access. (See Section 7.9.3, ''Changing a Password on a Windows Data Collector'' for instructions for changing that password.)
When you are satisfied with your password, click . Exit and restart the Data Analyzer for the password to take effect.
7.9.3. Changing a Password on a Windows Data Collector
Open the Windows Registry Editor by typing "regedit" in the Windows search box on the taskbar and pressing Enter. If prompted by User Account Control, click to open the Windows Registry Editor.
In the Windows Registry Editor, expand the HKEY_LOCAL_MACHINE entry, then expand SYSTEM, CurrentControlSet, Services, damdrvr, and select Parameters.
In the right pane, double-click Read Password and then type a new 8-character alphanumeric password.
Click to make the change.
To store the new password, in the main menu select → .
Open the Windows Services, by typing "services" in the Windows search box and pressing Enter.
In the Windows Services, right-click PerfServ and select from the menu.
Open the Windows Device Manager, by typing "device manager" in the Windows search box and pressing Enter.
In the Windows Device Manager, right-click damdrvr and select from the menu.
First, restart damdrvr in the Windows Device Manager and then restart PerfServ in the Windows Services.
The change of the Data Collector password is completed.
7.10. Monitoring Processes on a Node
As the Data Analyzer monitors all the processes on the system, you can configure the tool to notify you when particular processes are created or exit on your system. The Data Analyzer can watch up to eight processes on an individual node. This customization is available at the system, group or node level. (You cannot, however, use this feature to notify you about processes that should not be there.)
When you bring up the Customization page, it contains a tab labeled Watch Process. If you select this tab, the Data Analyzer displays the Watch Process page similar to the one shown in Figure 7.23, ''Process Watch''.
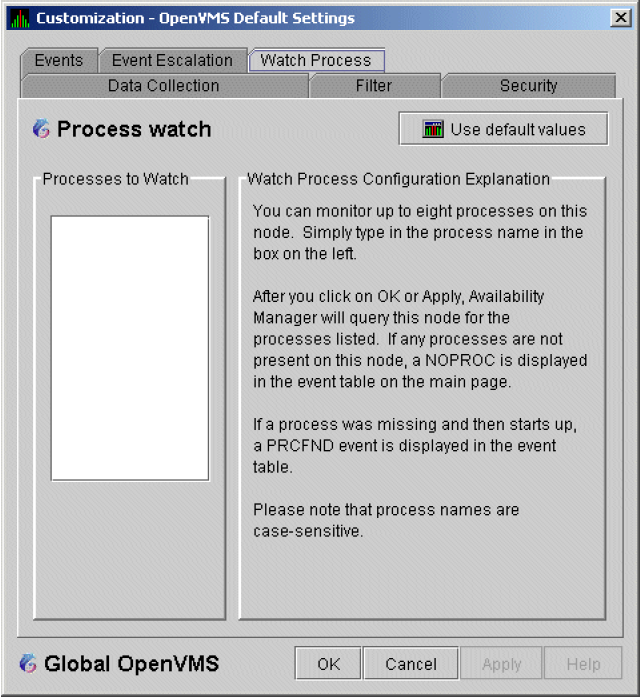
An explanation of the watch process feature is displayed on the right side of the page. You can enter up to 8 processes in the box on the left side of the page. After you enter process names, the Data Analyzer monitors these processes on the node you have selected.
 NOPROC -- The process process-name has disappeared on
           the node node-name.
 PRCFND -- The process process-name has recently
           reappeared on the node node-name.
Appendix A. Location of the Availability Manager Configuration and Log Files
The Availability Manager configuration and log files are located in a directory within the user's home directory location. This allows each user to have their own Availability Manager configuration parameters and location for the log files generated by the use of the Availability Manager.
Table A.1, ''Location of the Availability Manager Configuration and Log Files'' shows the default location for these files, and how to change the location using logicals on OpenVMS and environment variables on Windows.
| OpenVMS platform | Windows platform | ||
|---|---|---|---|
|
Configuration files | File list |
|
|
|
Default location |
[.AMDS$AM.Config] in the SYS$LOGIN: directory |
C:\Users\username\AMDS$AM\Config where username is your Windows username | |
|
Custom location |
AMDS$AM_CONFIG logical defined before starting the Data Analyzer or Data Server |
AMDS$AM_CONFIG environment variable defined before starting the Data Analyzer or Data Server | |
| Log files |
Default location |
[.AMDS$AM.Log] in the SYS$LOGIN: directory |
C:\Users\username\AMDS$AM\Log where username is your Windows username |
|
Custom location |
AMDS$AM_LOG logical defined before starting the Data Analyzer or Data Server |
AMDS$AM_LOG environment variable defined before starting the Data Analyzer or Data Server | |
Note
The AM$DS_Connections.xml file is located in the Availability Manager installation directory on Windows and AMDS$AM_MANAGER: on OpenVMS. The file is in a system location on both platforms since only one Data Server instance is supported on a particular machine.
Appendix B. CPU Process States
|
Process State |
Description | |
|---|---|---|
|
CEF |
Common Event Flag, waiting for a common event flag | |
|
COLPG |
Collided Page Wait, involuntary wait state; likely to indicate a memory shortage, waiting for hard page faults | |
|
COM |
Computable; ready to execute | |
|
COMO |
Computable Outswapped, COM, but swapped out | |
|
CUR |
Current, currently executing in a CPU | |
|
FPG |
Free Page Wait, involuntary wait state; most likely indicates a memory shortage | |
|
LEF |
Local Event Flag, waiting for a Local Event Flag | |
|
LEFO |
Local Event Flag Outswapped; LEF, but outswapped | |
|
HIB |
Hibernate, voluntary wait state requested by the process; it is inactive | |
|
HIBO |
Hibernate Outswapped, hibernating but swapped out | |
|
MWAIT |
Miscellaneous Resource Wait, involuntary wait state, possibly caused by a shortage of a systemwide resource, such as no page or swap file capacity or no synchronizations for single-threaded code. Types of MWAIT states are shown in the following table: | |
|
MWAIT State |
Definition | |
|
BWAIT |
Process waiting for buffered I/O byte count quota. | |
|
JWAIT |
Process in either BWAIT or TWAIT state. | |
|
TWAIT |
Process waiting for timer queue entry quota. | |
|
EXH |
Kernel thread in exit handler (not currently used). | |
|
IMODE |
Kernel thread waiting to acquire inner-mode semaphore. | |
|
PSXFR |
Process waiting during a POSIX fork operation. | |
|
RWAST |
Process waiting for system or special kernel mode AST. | |
|
RWMBX |
Process waiting because mailbox is full. | |
|
RWNBX |
Process waiting for nonpaged dynamic memory. | |
|
RWPFF |
Process waiting because page file is full. | |
|
RWPAG |
Process waiting for paged dynamic memory. | |
|
RWMPE |
Process waiting because modified page list is empty. | |
|
RWMPB |
Process waiting because modified page writer is busy. | |
|
RWSCS |
Process waiting for distributed lock manager. | |
|
RWCLU |
Process waiting because OpenVMS Cluster is in transition. | |
|
RWCAP |
Process waiting for CPU that has its capability set. | |
|
RWCSV |
Kernel thread waiting for request completion by OpenVMS Cluster server process. | |
|
PFW |
Page Fault Wait, involuntary wait state; possibly indicates a memory shortage, waiting for hard page faults. | |
|
RWAST |
Resource Wait State, waiting for delivery of an asynchronous system trap (AST) that signals a resource availability; usually an I/O is outstanding or a process quota is exhausted. | |
|
RWBRK |
Resource Wait for BROADCAST to finish | |
|
RWCAP |
Resource Wait for CPU Capability | |
|
RWCLU |
Resource Wait for Cluster Transition | |
|
RWCSV |
Resource Wait for Cluster Server Process | |
|
RWIMG |
Resource Wait for Image Activation Lock | |
|
RWLCK |
Resource Wait for Lock ID data base | |
|
RWMBX |
Resource Wait on MailBox, either waiting for data in mailbox (to read) or waiting to place data (write) into a full mailbox (some other process has not read from it; mailbox is full so this process cannot write). | |
|
RWMPB |
Resource Wait for Modified Page writer Busy | |
|
RWMPE |
Resource Wait for Modified Page list Empty | |
|
RWNPG |
Resource Wait for Non Paged Pool | |
|
RWPAG |
Resource Wait for Paged Pool | |
|
RWPFF |
Resource Wait for Page File Full | |
|
RWQUO |
Resource Wait for Pooled Quota | |
|
RWSCS |
Resource Wait for System Communications Services | |
|
RWSWP |
Resource Wait for Swap File space | |
|
SUSP |
Suspended, wait state process placed into suspension; it can be resumed at the request of an external process | |
|
SUSPO |
Suspended Outswapped, suspended but swapped out | |
Appendix C. Tables of Events
OpenVMS events (Table C.1, ''OpenVMS Events'')
Windows events (Table C.2, ''Windows Events'')
Alphabetical list of the events that the Availability Manager Data Analyzer signals in the Event pane of the System Overview window (Figure 1.1, ''System Overview Window'')
Abbreviation and brief description of each event (also displayed in the Event pane)
Explanation of the event and a suggestion for remedial action, if applicable
|
Event |
Description |
Explanation |
Recommended Action |
|---|---|---|---|
|
CFGDON |
Configuration done |
The server application has made a connection to the node and will start collecting the data according to the Customize Data Collection options. |
This informational event indicates that the node is recognized. No further investigation is required. |
|
DPGERR |
Error executing driver program |
The Data Collector has detected a program error while executing the data collection program. |
This event can occur if you have a bad driver program library, or there is a bug in the driver program. Make sure you have the program library that shipped with the kit; if it is correct, contact your customer support representative with the full text of the event. |
|
DSKERR |
High disk error count |
The error count for the disk device exceeds the threshold. |
Check error log entries for device errors. A disk device with a high error count could indicate a problem with the disk or with the connection between the disk and the system. |
|
DSKINV |
Disk is invalid |
The valid bit in the disk device status field is not set. The disk device is not considered valid by the operating system. |
Make sure that the disk device is valid and is known to the operating system. |
|
DSKMNV |
Disk in mount verify state |
The disk device is performing a mount verification. |
The system is performing a mount verification for the disk device.
This could be caused by:
|
|
DSKOFF |
Disk device is off line |
The disk device has been placed in the off line state. |
Check whether the disk device should be off line. This event is also signalled when the same device name is used for two different physical disks. The volume name in the event is the second node to use the same device name. |
|
DSKQLN |
High disk queue length |
The average number of pending I/Os to the disk device exceeds the threshold. |
More I/O requests are being queued to the disk device than the device can service. Reasons include a slow disk or too much work being done on the disk. |
|
DSKRWT |
High disk RWAIT count |
The RWAIT count on the disk device exceeds the threshold. |
RWAIT is an indicator that an I/O operation has stalled, usually during normal connection failure recovery or volume processing of host-based shadowing. A node has probably failed and shadowing is recovering data. |
|
DSKUNA |
Disk device is unavailable |
The disk device has been placed in the Unavailable state. |
The disk device state has been set to /NOAVAILABLE. See DCL help for the SET DEVICE/AVAILABLE command. |
|
DSKWRV |
Wrong volume mounted |
The disk device has been mounted with the wrong volume label. |
Set the correct volume name by entering the DCL command SET VOLUME/LABEL on the node. |
|
ELIBCR |
Bad CRC for exportable program library |
The CRC calculation for the exportable program library does not match the CRC value in the library. |
The exportable program library may be corrupt. Restore the exportable program library from its original source. |
|
ELIBNP |
No privilege to access exportable program library |
Unable to access the exportable program library. |
Check to make sure that the Data Analyzer has the proper security access to the exportable program library file. |
|
ELIBUR |
Unable to read exportable program library |
Unable to read the exportable program library for the combination of hardware architecture and OpenVMS version. |
The exportable program library may be corrupt. Restore the exportable program library from its original source. |
|
FXCPKT |
Received a corrupt fix response packet from node |
The Data Analyzer tried to perform a fix, but the fix acknowledgment from the node was corrupt. |
This event could occur if there is network congestion or some problem with the node. Confirm the connection to the node, and reapply the fix if necessary. |
|
FXCRSH |
Crash node fix |
The Data Analyzer has successfully performed a Crash Node fix on the node. |
This informational message indicates a successful fix. Expect to see a Path Lost event for the node. |
|
FXDCPR |
Decrement process priority fix |
The Data Analyzer has successfully performed a Decrement Process Priority fix on the process. |
This informational message indicates a successful fix. Setting a process priority too low takes CPU time away from the process. |
|
FXDCWS |
Decrement process working set size fix |
The Data Analyzer has successfully decreased the working set size of the process on the node by performing an Adjust Working Set fix. |
This informational message indicates a successful fix. This fix disables the automatic working set adjustment for the process. |
|
FXDLPR |
Delete process fix |
The Data Analyzer has successfully performed a Delete Process fix on the process. |
This informational message indicates a successful fix. If the process is in RWAST state, this fix does not work. This fix also does not work on processes created with the no delete option. |
|
FXEXIT |
Exit image fix |
The Data Analyzer has successfully performed an Exit Image fix on the process. |
This informational message indicates a successful fix. Forcing a system process to exit its current image can corrupt the kernel. |
|
FXINPR |
Increment process priority fix |
The Data Analyzer has successfully performed an Increment Process Priority fix on the process. |
This informational message indicates a successful fix. Setting a process priority too high takes CPU time away from other processes. Set the priority above 15 only for "real-time" processing. |
|
FXINQU |
Increment process quota limits fix |
The Data Analyzer has successfully increased the quota limit of the process on the node by placing a new limit value in the limit field of the quota. |
This informational message indicates a successful fix. This fix is only for the life of the process. If the problem continues, change the limit for the account in the UAF file. |
|
FXINWS |
Increment process working set size fix |
The Data Analyzer has successfully increased the working set size of the process on the node by performing an Adjust Working Set fix. |
This informational message indicates a successful fix. This fix disables the automatic working set adjustment for the process. The adjusted working set value cannot exceed WSQUOTA for the process or WSMAX for the system. |
|
FXNOPR |
No-change process priority fix |
The Data Analyzer has successfully performed a Process Priority fix on the process that resulted in no change to the process priority. |
This informational message indicates a successful fix. The Fix Value slider was set to the current priority of the process. |
|
FXNOQU |
No-change process quota limits fix |
The Data Analyzer has successfully performed a quota limit fix for the process that resulted in no change to the quota limit. |
This informational message indicates a successful fix. The Fix Value slider was set to the current quota of the process. |
|
FXNOWS |
No-change process working set size fix |
The Data Analyzer has successfully performed Adjust Working Set fix on the process. |
This informational message indicates a successful fix. The Fix Value slider was set to the current working set size of the process. |
|
FXPGWS |
Purge working set fix |
The Data Analyzer has successfully performed a Purge Working Set fix on the process. |
This informational message indicates a successful fix. The purged process might page fault to retrieve memory it needs for current processing. |
|
FXPRIV |
No privilege to attempt fix |
The Data Analyzer cannot perform a fix on the node due either to no CMKRNL privilege or to unmatched security triplets. |
See Chapter 7, "Customizing the Availability Manager Data Analyzer" for details about setting up security. |
|
FXQUOR |
Adjust quorum fix |
The Data Analyzer has successfully performed an Adjust Quorum fix on the node. |
This informational message indicates a successful fix. Use this fix when you find many processes in RWCAP state on a cluster node. |
|
FXRESM |
Resume process fix |
The Data Analyzer has successfully performed a Resume Process fix on the process. |
This informational message indicates a successful fix. If the process goes back into suspend state, check the AUDIT_SERVER process for problems. |
|
FXSUSP |
Suspend process fix |
The Data Analyzer has successfully performed a Suspend Process fix on the process. |
This informational message indicates a successful fix. Do not suspend system processes. |
|
FXTIMO |
Fix timeout |
The Data Analyzer tried to perform a fix, but no acknowledgment for the fix was received from the node within the timeout period. |
This event can occur if there is network congestion, if some problem is causing the node not to respond, or if the fix request failed to reach the node. Confirm the connection to the node, and reapply the fix if necessary. |
|
FXUERR |
Unknown error code for fix |
The Data Analyzer tried to perform a fix, but the fix failed for an unexpected reason. |
Please contact your VSI customer support representative with the text of this event. The event text is also recorded in the event log. |
|
HIBIOR |
High buffered I/O rate |
The node's average buffered I/O rate exceeds the threshold. |
A high buffered I/O rate can cause high system overhead. If this is affecting overall system performance, use the I/O Summary to determine the high buffered I/O processes, and adjust their priorities or suspend them as needed. |
|
HICOMQ |
Many processes waiting in COM or COMO |
The average number of processes on the node in the COM or COMO queues exceeds the threshold. |
Use the CPU Mode Summary to determine which processes are competing for CPU resources. Possible adjustments include changing process priorities and suspending processes. |
|
HIDIOR |
High direct I/O rate |
The average direct I/O rate on the node exceeds the threshold. |
A high direct I/O rate can cause high system overhead. If this is affecting overall system performance, use the I/O Summary to determine the high direct I/O processes, and adjust their priorities or suspend them as needed. |
|
HIHRDP |
High hard page fault rate |
The average hard page fault rate on the node exceeds the threshold. |
A high hard page fault indicates that the free or modified page list is too small. Check Chapter 7, "Customizing the Availability Manager Data Analyzer" for possible actions. |
|
HIMWTQ |
Many processes waiting in MWAIT |
The average number of processes on the node in the Miscellaneous Resource Wait (MWAIT) queues exceeds the threshold. |
Use the CPU and Single Process pages to determine which resource is awaited. See Chapter 7, "Customizing the Availability Manager Data Analyzer" for more information about wait states. |
|
HINTER |
High interrupt mode time |
The average percentage of time the node spends in interrupt mode exceeds the threshold. |
Consistently high interrupt time prohibits processes from obtaining CPU time. Determine which device or devices are overusing this mode. |
|
HIPINT |
High interrupt mode time on Primary CPU |
The average percentage of time the node spends in interrupt mode exceeds the threshold. |
Consistently high interrupt time on the Primary CPU can slow down I/O and servicing various systems in OpenVMS. Enabling Fast Path helps distribute the servicing of interrupts from I/O among the CPUs on the node. Also, determine which device or devices are overusing this mode. |
|
HIPRCT |
High process count |
The proportion of actual processes to maximum processes is too high. If the number of processes reaches the maximum (MAXPROCESSCNT), no more processes can be created and the system might hang as a result. |
Decrease the number of actual processes. Increase SYSGEN parameter MAXPROCESSCNT. |
|
HIPWIO |
High paging write I/O rate |
The average paging write I/O rate on the node exceeds the threshold. |
Use the Process I/O and Memory Summary pages to determine which processes are writing to the page file excessively, and decide whether their working sets need adjustment. |
|
HIPWTQ |
Many processes waiting in COLPG, PFW, or FPG |
The average number of processes on the node that are waiting for page file space exceeds the threshold. |
Use the CPU Process States and Memory Summary to determine which processes are in the COLPG, PFW, or FPG state. COLPG and PFW processes might be constrained by too little physical memory, too restrictive working set quotas, or lack of available page file space. FPG processes indicate too little physical memory is available. |
|
HISYSP |
High system page fault rate |
The node's average page fault rate for pageable system areas exceeds the threshold. |
These are page faults from pageable sections in loadable executive images, page pool, and the global page table. The system parameter SYSMWCNT might be set too low. Use AUTOGEN to adjust this parameter. |
|
HITTLP |
High total page fault rate |
The average total page fault rate on the node exceeds the threshold. |
Use the Memory Summary to find the page faulting processes, and make sure that their working sets are set properly. |
|
HMPSYN |
High multiprocessor (MP) synchronization mode time |
The average percentage of time the node handles multiprocessor (MP) synchronization exceeds the threshold. |
High synchronization time prevents other devices and processes from obtaining CPU time. Determine which device is overusing this mode. |
|
HPMPSN |
High MP synchronization mode time on Primary CPU |
The average percentage of time the node handles multiprocessor (MP) synchronization exceeds the threshold. |
High synchronization time prevents other devices and processes from obtaining CPU time. This is especially critical for the Primary CPU, which is the only CPU that performs certain tasks on OpenVMS. Determine which spinlocks are overusing this mode. Executing SYS$EXAMPLES:SPL.COM shows which spinlocks are being used. |
|
KTHIMD |
Kernel thread waiting for inner-mode semaphore |
The average percentage of time that the kernel thread waits for the inner-mode semaphore exceeds the threshold. |
Use SDA to determine which kernel thread of the process has the semaphore. |
|
LCKBLK |
Lock blocking |
The process holds the highest priority lock in the resource's granted lock queue. This lock is blocking all other locks from gaining access to the resource. |
Use the Single Process Windows to determine what the process is doing. If the process is in an RW xxx state, try exiting the image or deleting the process. If this fails, crashing the blocking node might be the only other fix option. |
|
LCKCNT |
Lock contention |
The resource has a contention situation, with multiple locks competing for the same resource. The competing locks are the currently granted lock and those that are waiting in the conversion queue or in the waiting queue. |
Use Lock Contention to investigate a potential lock contention situation. Locks for the same resource might have the NODLCKWT wait flag enabled and be on every member of the cluster. Usually this is not a lock contention situation, and these locks can be filtered out. |
|
LCKWAT |
Lock waiting |
The process that has access to the resource is blocking the process that is waiting for it. Once the blocking process releases its access, the next highest lock request acquires the blocking lock. |
If the blocking process holds the resource too long, check to see whether the process is working correctly; if not, one of the fixes might solve the problem. |
|
LOASTQ |
Process has used most of ASTLM quota |
Either the remaining number of asynchronous system traps (ASTs) the process can request is below the threshold, or the percentage of ASTs used compared to the allowed quota is above the threshold. |
If the amount used reaches the quota, the process enters RWAST state. If the process requires a higher quota, you can increase the ASTLM quota for the process in the UAF file. ASTLM is only a count; system resources are not compromised by increasing this count. |
|
LOBIOQ |
Process has used most of BIOLM quota |
Either the remaining number of Buffered I/Os (BIO) the process can request is below the threshold, or the percentage of BIOs used is above the threshold. |
If the amount used reaches the quota, the process enters RWAST state. If the process requires a higher quota, you can increasing the BIOLM quota for the process in the UAF file. BIOLM is only a count; system resources are not compromised by increasing this count. |
|
LOBYTQ |
Process has used most of BYTLM quota |
Either the remaining number of bytes for the buffered I/O byte count (BYTCNT) that the process can request is below the threshold, or the percentage of bytes used is above the threshold. |
If the amount used reaches the quota, the process enters RWAST state. If the process requires a higher quota, you can raise the BYTLM quota for the process in the UAF file. BYTLM is the number of bytes in nonpaged pool used for buffered I/O. |
|
LODIOQ |
Process has used most of DIOLM quota |
Either the remaining number of Direct I/Os (DIOs) the process can request is below the threshold, or the percentage of DIOs used is above the threshold. |
If the amount used reaches the quota, the process enters RWAST state. If the process requires a higher quota, you can increase the DIOLM quota for the process in the UAF file. DIOLM is only a count; system resources are not compromised by increasing this count. |
|
LOENQU |
Process has used most of ENQLM quota |
Either the remaining number of lock enqueues (ENQ) the process can request is below the threshold, or the percentage of ENQs used is above the threshold. |
If the limit reaches the quota, the process is not able to make further lock queue requests. If the process requires a higher quota, you can increase the ENQLM quota for the process in the UAF file. |
|
LOFILQ |
Process has used most of FILLM quota |
Either the remaining number of files the process can open is below the threshold, or the percentage of files open is above the threshold. |
If the amount used reaches the quota, the process must first close some files before being allowed to open new ones. If the process requires a higher quota, you can increase the FILLM quota for the process in the UAF file. |
|
LOMEMY |
Free memory is low |
For the node, the percentage of free memory compared to total memory is below the threshold. |
Use the automatic Purge Working Set fix, or use the Memory and CPU Summary to select processes that are either not currently executing or not page faulting, and purge their working sets. |
|
LOPGFQ |
Process has used most of PGFLQUOTA quota |
Either the remaining number of pages the process can allocate from the system page file is below the threshold, or the percentage of pages allocated is above the threshold. |
If the process requires a higher quota, you can raise the PGFLQUOTA quota for the process in the UAF file. This value limits the number of pages in the system page file that the account's processes can use. |
|
LOPGSP |
Low page file space |
Either the remaining number of pages in the system page file is below the threshold, or the percentage of page files pace remaining is below the threshold. |
Either extend the size of this page file or create a new page file to allow new processes to use the new page file. |
|
LOPRCQ |
Process has used most of PRCLM quota |
Either the remaining number of subprocesses the current process is allowed to create is below the threshold, or the percentage of created subprocesses is above the threshold. |
If the amount used reaches the quota, the process is not allowed to create more subprocesses. If the process requires a higher quota, you can increase the PRCLM quota for the process in the UAF file. |
|
LOSTVC |
Lost virtual circuit to node |
The virtual circuit between the listed nodes has been lost. |
Check to see whether the second node listed has failed or whether the connection between the nodes is broken. The VC name listed in parentheses is the communication link between the nodes. |
|
LOSWSP |
Low swap file space |
Either the remaining number of pages in the system page file is below the threshold, or the percentage of page file space remaining is below the threshold. |
Either increase the size of this page file, or create a new page file to allow new processes to use the new page file. |
|
LOTQEQ |
Process has used most of TQELM quota |
Either the remaining number of Timer Queue Entries (TQEs) the process can request is below the threshold, or the percentage of TQEs used to the allowed quota is above the threshold. |
If the amount used reaches the quota, the process enters RWAST state. If the process requires a higher quota, you can raise the TQELM quota for the process in the UAF file. TQELM is only a count; system resources are not compromised by raising it. |
|
LOVLSP |
Low disk volume free space |
Either the remaining number of blocks on the volume is below the threshold, or the percentage of free blocks remaining on the volume is below the threshold. |
You must free up some disk volume space. If part of the purpose of the volume is to be filled, such as a page/swap device, then you can filter the volume from the display. |
|
LOVOTE |
Low cluster votes |
The difference between the number of VOTES and the QUORUM in the cluster is below the threshold. |
Check to see whether voting members have failed. To avoid the hang that results if VOTES goes below QUORUM, use the Adjust Quorum fix. |
|
LOWEXT |
Low process working set extent |
The process page fault rate exceeds the threshold, and the percentage of working set size compared to working set extent exceeds the threshold. |
This event indicates that the WSEXTENT value in the UAF file might be too low. The process needs more physical memory but cannot obtain it; therefore, the process page faults excessively. |
|
LOWSQU |
Low process working set quota |
The process page fault rate exceeds the threshold, and the percentage of working set size exceeds the threshold. |
This event indicates the process needs more memory but might not
be able to obtain it because one of the following is true:
|
|
LRGHSH |
Remote lock hash table too large to collect data on |
The Data Analyzer cannot investigate the node's resource hash table (RESHASHTBL). It is either too sparse or too dense to investigate efficiently. |
This event indicates that the Data Analyzer will take too many collection iterations to analyze lock contention situations efficiently. Make sure that the SYSGEN parameter RESHASHTBL is set properly for the node. |
|
NOPGFL |
No page file |
The Data Analyzer cannot find a page file on the node. |
Use SYSGEN to create and connect a page file on the node. |
|
NOPLIB |
No program library |
The program library for the combination of hardware architecture and OpenVMS version was not found. |
Check to see that all the program library files exist in the program library directory. |
|
NOPRIV |
Not allowed to monitor node |
The Data Analyzer cannot monitor the node due to unmatched security triplets. |
See Chapter 7, "Customizing the Availability Manager Data Analyzer" for details on setting up security. |
|
NOPROC |
Specific process not found |
The Data Analyzer cannot find the process name selected in the Process Name Search dialog box on the Node Summary page. |
This event can occur because the listed process no longer exists, or the process name is listed incorrectly in the dialog box. |
|
NOSWFL |
No swap file |
The Data Analyzer cannot find a swap file on the node. |
If you do not use swap files, you can ignore this event. Otherwise, use SYSGEN to create and connect a swap file for the node. |
|
OPCERR |
Event not sent to OPCOM |
Either the Data Analyzer was unable to send the event to OPCOM because of a setup problem, or an error was returned by OPCOM. |
A text message in the status field indicates that the Data Analyzer was not configured properly, including missing shareable images or incorrectly defined logical names. A hexadecimal condition value in the status field indicates the reason that OPCOM was not able to post the event. The $SNDOPR system service returns this value. For a list of condition values and additional information, see the VSI OpenVMS System Services Reference Manual. |
|
PKTCER |
Packet checksum error |
The data packet sent to the remote node was not received correctly and failed to pass checksum verification. |
The data packet was corrupted when it was received at the remote node. The most likely cause is a network hardware failure. |
|
PKTFER |
Packet format error |
The data packet sent to the remote node was not in the correct format for the remote node to process. |
Please contact your VSI customer support representative with the full text of the event, the version of the Availability Manager, the configuration of the node running the Data Analyzer, and the configuration of the nodes being monitored. |
|
PLIBNP |
No privilege to access program library |
Unable to access the program library. |
Check to see that the Availability Manager has the proper security access to the program library file. |
|
PLIBUR |
Unable to read program library |
Unable to read the program library for the combination of hardware architecture and OpenVMS version. |
The program library is either corrupt or from a different version of the Availability Manager. Restore the program library from the last installation. |
|
PRBIOR |
High process buffered I/O rate |
The average buffered I/O rate of the process exceeds the threshold. |
If the buffered I/O rate is affecting overall system performance, lowering the process priority or suspending the process would allow other processes to obtain access to the CPU. |
|
PRBIOW |
Process waiting for buffered I/O |
The average percentage of time the process is waiting for a buffered I/O to complete exceeds the threshold. |
Use SDA on the node to ensure that the device to which the process is performing buffered I/Os is still available and is not being overused. |
|
PRCCOM |
Process waiting in COM or COMO |
The average number of processes on the node in the COM or COMO queues exceeds the threshold. |
Use the CPU Summary to determine which processes should be given more CPU time, and adjust process priorities and states accordingly. |
|
PRCCUR |
Process has a high CPU rate |
The average percentage of time the process is currently executing in the CPU exceeds the threshold. |
Make sure that the listed process is not looping or preventing other processes from gaining access to the CPU. Adjust process priority or state as needed. |
|
PRCFND |
Process has recently been found |
The Data Analyzer has discovered the process name selected on the Watch Process page (see Figure 7.23, ''Process Watch''). |
No action required. |
|
PRCMUT |
Process waiting for a mutex |
The average percentage of time the process is waiting for a particular system mutex exceeds the threshold. |
Use SDA to help determine which mutex the process is waiting for and to help determine the owner of the mutex. |
|
PRCMWT |
Process waiting in MWAIT |
The average percentage of time the process is in a Miscellaneous Resource Wait (MWAIT) state exceeds the threshold. |
Various resource wait states are part of the collective wait state called MWAIT. See Appendix B, "CPU Process States" for a list of these states. The CPU Process page and the Single Process page display which state the process is in. Check the Single Process page to determine which resource the process is waiting for and whether the resource is still available for the process. |
|
PRCPSX |
Process waiting in PSXFR |
The average percentage of time the process waits during a POSIX fork operation exceeds the threshold. | |
|
PRCPUL |
Most of CPULIM process quota used |
The remaining CPU time available for the process is below the threshold. |
Make sure the CPU time allowed for the process is sufficient for its processing needs. If not, increase the CPU quota in the UAF file of the node. |
|
PRCPWT |
Process waiting in COLPG, PFW or FPG |
The average percentage of time the process is waiting to access the system page file database exceeds the threshold. |
Check to make sure the system page file is large enough for all the resource requests being made. |
|
PRCQUO |
Process waiting for a quota |
The average percentage of time the process is waiting for a particular quota exceeds the threshold. |
Use the Single Process pages to determine which quota is too low. Then adjust the quotas of the account in the UAF file. |
|
PRCRWA |
Process waiting in RWAST |
The average percentage of time the process is waiting in the RWAST state exceeds the threshold. RWAST indicates the process is waiting for an asynchronous system trap to complete. |
Use the Single Process pages to determine if RWAST is due to the process quota being set too low. If not, use SDA to determine if RWAST is due to a problem between the process and a physical device. |
|
PRCRWC |
Process waiting in RWCAP |
The average percentage of time the process is waiting in the RWCAP state exceeds the threshold. RWCAP indicates that the process is waiting for CPU capability. |
When many processes are in this state, the system might be hung because not enough nodes are running in the cluster to maintain the cluster quorum. Use the Adjust Quorum fix to correct the problem. |
|
PRCRWM |
Process waiting in RWMBX |
The average percentage of time the process is waiting in the RWMBX state exceeds the threshold. RWMBX indicates the process is waiting for a full mailbox to be empty. |
Use SDA to help determine which mailbox the process is waiting for. |
|
PRCRWP |
Process waiting in RWPAG, RWNPG, RWMPE, or RWMPB |
The average percentage of time the process is waiting in the RWPAG, RWNPG, RWMPE, or RWMPB state exceeds the threshold. RWPAG and RWNPG are for paged or nonpaged pool; RWMPE and RWMPB are for the modified page list. |
Processes in the RWPAG or RWNPG state can indicate you need to increase the size of paged or nonpaged pool, respectively. Processes in the RWMPB state indicate that the modified page writer cannot handle all the modified pages being generated. See Chapter 7, "Customizing the Availability Manager Data Analyzer" for suggestions. |
|
PRCRWS |
Process waiting in RWSCS, RWCLU, or RWCSV |
The average percentage of time the process is waiting in the RWSCS, RWCLU, or RWCSV state exceeds the threshold. RWCSV is for the cluster server; RWCLU is for the cluster transition; RWSCS is for cluster communications. The process is waiting for a cluster event to complete. |
Use the Show Cluster utility to help investigate. |
|
PRCUNK |
Process waiting for a system resource |
The average percentage of time the process is waiting for an undetermined system resource exceeds the threshold. |
The state in which the process is waiting is unknown to the Data Analyzer. |
|
PRDIOR |
High process direct I/O rate |
The average direct I/O rate of the process exceeds the threshold. |
If the I/O rate is affecting overall system performance, lowering the process priority might allow other processes to obtain access to the CPU. |
|
PRDIOW |
Process waiting for direct I/O |
The average percentage of time the process is waiting for a direct I/O to complete exceeds the threshold. |
Use SDA on the node to ensure that the device to which the process is performing direct I/Os is still available and is not being overused. |
|
PRLCKW |
Process waiting for a lock |
The average percentage of time the process is waiting in the control wait state exceeds the threshold. |
The control wait state indicates that a process is waiting for a lock. Although no locks might appear in Lock Contention, the awaited lock might be filtered out of the display. |
|
PRPGFL |
High process page fault rate |
The average page fault rate of the process exceeds the threshold. |
The process is memory constrained; it needs an increased number of pages to perform well. Make sure that the working set quotas and extents are set correctly. To increase the working set quota temporarily, use the Adjust Working Set fix. |
|
PRPIOR |
High process paging I/O rate |
The average page read I/O rate of the process exceeds the threshold. |
The process needs an increased number of pages to perform well. Make sure that the working set quotas and extents are set correctly. To increase the working set quota temporarily, use the Adjust Working Set fix. |
|
PTHLST |
Path lost |
The connection between the server and collection node has been lost. |
Check to see whether the node failed or whether the LAN segment to the node is having problems. This event occurs when the server no longer receives data from the node on which data is being collected. |
|
RESDNS |
Resource hash table dense |
The percentage of occupied entries in the hash table exceeds the threshold. |
A densely populated table can result in a performance degradation. Use the system parameter RESHASHTBL to adjust the total number of entries. |
|
RESPRS |
Resource hash table sparse |
The percentage of occupied entries in the hash table is less than the threshold. |
A sparsely populated table wastes memory resources. Use the system parameter RESHASHTBL to adjust the total number of entries. |
|
UEXPLB |
Using OpenVMS program export library |
The program library for the combination of hardware architecture and OpenVMS version was not found. |
Check to see that all the program library files exist in the program library directory. |
|
UNSUPP |
Unsupported node |
The Data Analyzer does not support this combination of hardware architecture and OpenVMS version. |
Check the product SPD for supported system configurations. |
|
VLSZCH |
Volume size changed |
Informational message to indicate that the volume has been resized. |
No further investigation is required. |
|
WINTRN |
High window turn rate |
This indicates that current open files are fragmented. Reading from fragmented files or extending a file size, or both, can cause a high window turn rate. |
Defragment heavily used volumes using BACKUP or a disk fragmentation program. For processes that extend the size of a file, make sure that the file extent value is large. (See the SET RMS/EXTEND_QUANTITY command documentation for more information.) |
|
Event |
Description |
Explanation |
Recommended Action |
|---|---|---|---|
|
CFGDON |
Configuration done |
The server application has made a connection to the node and will start collecting the data according to the Customize Data Collection options. |
An informational event to indicate that the node is recognized. No further investigation is required. |
|
NODATA |
Unable to collect performance data |
The Data Analyzer is unable to collect performance data from the node. |
The performance data is collected by the PerfServ service on the remote node. Check to see that the service is up and running properly. |
|
NOPRIV |
Not allowed to monitor node |
The Data Analyzer cannot monitor the node due to a password mismatch between the Data Collector and the Data Analyzer. |
See Chapter 7, "Customizing the Availability Manager Data Analyzer" for details on setting up security. |
|
PTHLST |
Path lost |
The connection between the Data Analyzer and the Data Collector has been lost. |
Check if the node crashed or if the LAN segment to the node is having problems. This event occurs when the server no longer receives data from the node on which data is being collected. |
|
PVRMIS |
Packet version mismatch |
This version of the Availability Manager is unable to collect performance data from the node because of a data packet version mismatch. |
The version of the Data Collector is more recent than the Data Analyzer. To process data from the node, upgrade the Data Analyzer to correspond to the Data Collector. |
Appendix D. OpenVMS Events by Types of Data Collections
Threshold events (Table D.1, ''OpenVMS Threshold Events'')
Nonthreshold events (Table D.2, ''OpenVMS Nonthreshold Events'')
Note
Enabling the data collections described in these tables is described in Chapter 7, "Customizing the Availability Manager Data Analyzer". The only exceptions are the events listed under "Process name scan" in Table D.1, ''OpenVMS Threshold Events'', which are enabled on the Watch Process Customization page (see Figure 7.23, ''Process Watch'').
|
Types of Data Collection |
Event |
Description |
|---|---|---|
|
Disk status |
DSKERR |
High disk error count |
|
DSKINV |
Disk is invalid | |
|
DSKMNV |
Disk in mount verify state | |
|
DSKMTO |
Disk mount verify timeout | |
|
DSKOFF |
Disk device is off line | |
|
DSKRWT |
High disk RWAIT count | |
|
DSKUNA |
Disk device is unavailable | |
|
DSKWRV |
Wrong volume mounted | |
|
WINTRN |
High window turn rate | |
|
Disk volume |
DSKQLN |
High disk queue length |
|
LOVLSP |
Low disk volume free space | |
|
VLSZCH |
Volume size changed | |
|
Node summary |
HIBIOR |
High buffered I/O rate |
|
HICOMQ |
Many processes waiting in COM or COMO | |
|
HIDIOR |
High direct I/O rate | |
|
HIHRDP |
High hard page fault rate | |
|
HIMWTQ |
Many processes waiting in MWAIT | |
|
HINTER |
High interrupt mode time | |
|
HIPINT |
High interrupt mode time on Primary CPU | |
|
HIPRCT |
High process count | |
|
HIPWIO |
High paging write I/O rate | |
|
HIPWTQ |
Many processes waiting in COLPG, PFW, or FPG | |
|
HISYSP |
High system page fault rate | |
|
HITTLP |
High total page fault rate | |
|
HMPSYN |
High multiprocessor (MP) synchronization mode time | |
|
HPMPSN |
High interrupt mode time on Primary CPU | |
|
LOMEMY |
Free memory is low | |
|
Lock contention |
LCKCNT |
Lock contention |
|
LRGHSH |
Remote lock hash table too large to collect data | |
|
RESDNS |
Resource hash table dense | |
|
RESPRS |
Resource hash table sparse | |
|
Single lock |
LCKBLK |
Lock blocking |
|
LCKWAT |
Lock waiting | |
|
Single process |
KTHIMD |
Kernel thread waiting for inner-mode semaphore |
|
LOASTQ |
Process has used most of ASTLM quota | |
|
LOBIOQ |
Process has used most of BIOLM quota | |
|
LOBYTQ |
Process has used most of BYTLM quota | |
|
LODIOQ |
Process has used most of DIOLM quota | |
|
LOENQU |
Process has used most of ENQLM quota | |
|
LOFILQ |
Process has used most of FILLM quota | |
|
LOPGFQ |
Process has used most of PGFLQUOTA quota | |
|
LOPRCQ |
Process has used most of PRCLM quota | |
|
LOTQEQ |
Process has used most of TQELM quota | |
|
LOWEXT |
Low process working set extent | |
|
LOWSQU |
Low process working set quota | |
|
PRBIOR |
High process buffered I/O rate | |
|
PRBIOW |
Process waiting for buffered I/O | |
|
PRCCOM |
Process waiting in COM or COMO | |
|
PRCCUR |
Process has a high CPU rate | |
|
PRCMUT |
Process waiting for a mutex | |
|
PRCPSX |
Process waiting in PSXFR wait state | |
|
PRCPUL |
Most of CPULIM process quota used | |
|
PRCPWT |
Process waiting in COLPG, PFW, or FPG | |
|
PRCQUO |
Process waiting for a quota | |
|
PRCRWA |
Process waiting in RWAST | |
|
PRCRWC |
Process waiting in RWCAP | |
|
PRCRWM |
Process waiting in RWMBX | |
|
PRCRWP |
Process waiting in RWPAG, RWNPG, RWMPE, or RWMPB | |
|
PRCRWS |
Process waiting in RWSCS, RWCLU, or RWCSV | |
|
PRCUNK |
Process waiting for a system resource | |
|
PRDIOR |
High process direct I/O rate | |
|
PRDIOW |
Process waiting for direct I/O | |
|
PRLCKW |
Process waiting for a lock | |
|
PRPGFL |
High process page fault rate | |
|
PRPIOR |
High process paging I/O rate | |
|
Process I/O |
LOBIOQ |
Process has used most of BIOLM quota |
|
LOBYTQ |
Process has used most of BYTLM quota | |
|
LODIOQ |
Process has used most of DIOLM quota | |
|
LOFILQ |
Process has used most of FILLM quota | |
|
PRBIOR |
High process buffered I/O rate | |
|
PRDIOR |
High process direct I/O rate | |
|
PRPIOR |
High process paging I/O rate | |
|
Page/swap file |
LOPGSP |
Low page file space |
|
LOSWSP |
Low swap file space | |
|
NOPGFL |
No page file | |
|
NOSWFL |
No swap file | |
|
Cluster summary |
LOVOTE |
Low cluster votes |
|
Memory |
LOWEXT |
Low process working set extent |
|
LOWSQU |
Low process working set quota | |
|
PRPGFL |
High process page fault rate | |
|
PRPIOR |
High process paging I/O rate | |
|
CPU process |
PRCCOM |
Process waiting in COM or COMO |
|
PRCCUR |
Process has a high CPU rate | |
|
PRCMWT |
Process waiting in MWAIT (See Appendix B, "CPU Process States" for a breakdown of MWAIT state.) | |
|
PRCPWT |
Process waiting in COLPG, PFW, or FPG | |
|
Process name scan |
NOPROC |
Specific process not found |
|
PRCFND |
Process has been discovered recently |
|
Type of Data Collected |
Event |
Description |
|---|---|---|
|
Application-level event |
OPCERR |
Failed to send event to OPCOM |
|
Node-level event |
CFGDON |
Configuration done |
|
DPGERR |
Error executing driver program | |
|
NOPRIV |
Not allowed to monitor node | |
|
PKTCER |
Packet checksum error | |
|
PKTFER |
Packet format error | |
|
PTHLST |
Path lost | |
|
Program library error |
ELIBCR |
Bad CRC for exportable program library |
|
ELIBNP |
No privilege to access exportable program library | |
|
ELIBUR |
Unable to read exportable program library | |
|
NOPLIB |
No program library | |
|
PLIBNP |
No privilege to access program library | |
|
PLIBUR |
Unable to read program library | |
|
UEXPLB |
Using exportable program library | |
|
UNSUPP |
Unsupported node | |
|
Events generated by fixes |
FXCPKT |
Received a corrupt fix response packet from node |
|
FXCRSH |
Crash node fix | |
|
FXDCPR |
Decrement process priority fix | |
|
FXDCWS |
Decrement process working set size fix | |
|
FXDLPR |
Delete process fix | |
|
FXEXIT |
Exit image fix | |
|
FXINPR |
Increment process priority fix | |
|
FXINQU |
Increment process quota limits fix | |
|
FXINWS |
Increment process working set size fix | |
|
FXNOPR |
No parameter change with fix to priority | |
|
FXNOQU |
No quota change with fix to priority | |
|
FXNOWS |
No working set change with fix to priority | |
|
FXPGWS |
Purge working set fix | |
|
FXPRIV |
No privilege to attempt fix | |
|
FXQUOR |
Adjust quorum fix | |
|
FXRESM |
Resume process fix | |
|
FXSUSP |
Suspend process fix | |
|
FXTIMO |
Fix timeout | |
|
FXUERR |
Unknown error code for fix |
By default, the CPU heading follows Node Name on a line of Node pane data. You can use the cursor to move a column heading to another location on the line, if you like.
Descriptions are from Goldenberg, Ruth, and Saravanan, Saro, OpenVMS AXP Internals and Data Structures, Version 1.5, Digital Press, 1994.
You can adjust the quorum value by using the Adjust Quorum fix described in Section 6.2.1, ''Adjust Quorum''.
Data is collected by default when you open a Single Disk Summary page.
Data is collected by default when you open a Single Process page.