VSI DECset for OpenVMS Guide to Performance and Coverage Analyzer
- Software Version:
- DECset Version 12.7
- Operating System and Version:
- VSI OpenVMS x86-64 Version 9.2-2 or higher
VSI OpenVMS IA-64 Version 8.4-1H1 or higher
VSI OpenVMS Alpha Version 8.4-2L1 or higher
Preface
The Collector, which gathers various kinds of performance and test coverage data on your program
The Analyzer, which processes and displays that data graphically
$DEFINE PCAC$DECW$DISPLAY " "$DEFINE PCAA$DECW$DISPLAY " "
$DEASSIGN PCAC$DECW$DISPLAY$DEASSIGN PCAA$DECW$DISPLAY
/INTERFACE (invokes the character-cell format)
/INTERFACE=CHARACTER_CELL
/INTERFACE=DECWINDOWS
/INTERFACE=MOTIF
1. About VSI
VMS Software, Inc., (VSI) is an independent software company licensed by Hewlett Packard Enterprise to develop and support the OpenVMS operating system.
VSI seeks to continue the legendary development prowess and customer-first priorities that are so closely associated with the OpenVMS operating system and its original author, Digital Equipment Corporation.
2. Intended Audience
Analyze the performance characteristics of your applications
Analyze the test coverage characteristics of the tests you run on your applications to determine what code paths the tests are executing.
3. Document Structure
Chapter 1, "PCA Overview" introduces PCA and describes a methodology for using PCA effectively.
Chapter 2, "Running the Collector" shows how to use the PCA Collector to gather performance and coverage information about your application.
Chapter 3, "Running the Analyzer" shows how to use the PCA Analyzer to analyze and interpret the performance and coverage information the Collector has gathered.
Chapter 4, "Determining an Application's Basic Run-Time Characteristics" shows how you can interpret the elapsed and process time information to locate general performance bottlenecks.
Chapter 5, "Finding an Application's Most Executed Parts" shows how you can interpret execution counts information to locate specific performance bottlenecks.
Chapter 6, "Determining Test Coverage" explains how to find which parts of your application are covered or not covered by tests.
Chapter 7, "Determining How Your Application Uses System Resources" shows how you can determine how your application uses system resources: system services and I/O services.
4. Related Documents
The following documents might be helpful when using PCA:
VSI DECset for OpenVMS Installation Guide gives instructions for installing PCA.
VSI Fortran Performance Guide details the performance features of the VSI Fortran-High Performance Option (HPO) and discusses ways to improve the run-time performance of VSI Fortran programs.
VSI DECset for OpenVMS Performance and Coverage Analyzer Reference Manual describes all the commands available in PCA.
VSI DECset Performance and Coverage Analyzer for OpenVMS Command-Line Interface Guide describes how to use the command-line interface to PCA.
5. References to Other Products
Some older products that VSI DECset components previously worked with might no longer be available or supported by VSI. Any reference in this manual to such products does not imply actual support, or that recent interoperability testing has been conducted with these products.
Note
These references serve only to provide examples to those who continue to use these products with VSI DECset.
Refer to the Software Product Description for a current list of the products that the VSI DECset components are warranted to interact with and support.
6. OpenVMS Documentation
The full VSI OpenVMS documentation set can be found on the VMS Software Documentation webpage at https://docs.vmssoftware.com.
7. VSI Encourages Your Comments
You may send comments or suggestions regarding this manual or any VSI document by sending electronic mail to the following Internet address: <docinfo@vmssoftware.com>. Users who have VSI OpenVMS support contracts through VSI can contact <support@vmssoftware.com> for help with this product.
8. Conventions
VMScluster systems are now referred to as OpenVMS Cluster systems. Unless otherwise specified, references to OpenVMS Cluster systems or clusters in this document are synonymous with VMScluster systems.
The contents of the display examples for some utility commands described in this manual may differ slightly from the actual output provided by these commands on your system. However, when the behavior of a command differs significantly between OpenVMS Alpha and Integrity servers, that behavior is described in text and rendered, as appropriate, in separate examples.
In this manual, every use of DECwindows and DECwindows Motif refers to DECwindows Motif for OpenVMS software.
| Convention | Meaning |
|---|---|
|
Ctrl/ x |
A sequence such as Ctrl/ x indicates that you must hold down the key labeled Ctrl while you press another key or a pointing device button. |
|
PF1 x |
A sequence such as PF1 x indicates that you must first press and release the key labeled PF1 and then press and release another key or a pointing device button. |
|
Return |
In examples, a key name enclosed in a box indicates that you press a key on the keyboard. (In text, a key name is not enclosed in a box.) |
|
… |
A horizontal ellipsis in examples indicates one of the
following possibilities:
|
|
. . . |
A vertical ellipsis indicates the omission of items from a code example or command format; the items are omitted because they are not important to the topic being discussed. |
|
( ) |
In command format descriptions, parentheses indicate that you must enclose the options in parentheses if you choose more than one. |
|
[ ] |
In command format descriptions, brackets indicate optional choices. You can choose one or more items or no items. Do not type the brackets on the command line. However, you must include the brackets in the syntax for OpenVMS directory specifications and for a substring specification in an assignment statement. |
|
[ |] |
In command format descriptions, vertical bars separate choices within brackets or braces. Within brackets, the choices are options; within braces, at least one choice is required. Do not type the vertical bars on the command line. |
|
{ } |
In command format descriptions, braces indicate required choices; you must choose at least one of the items listed. Do not type the braces on the command line. |
|
bold text |
This typeface represents the introduction of a new term. It also represents the name of an argument, an attribute, or a reason. |
|
italic text |
Italic text indicates important information, complete titles of manuals, or variables. Variables include information that varies in system output (Internal error number), in command lines (/PRODUCER= name), and in command parameters in text (where dd represents the predefined code for the device type). |
|
UPPERCASE TEXT |
Uppercase text indicates a command, the name of a routine, the name of a file, or the abbreviation for a system privilege. |
|
|
Monospace type indicates code examples and interactive screen displays. In the C programming language, monospace type in text identifies the following elements: keywords, the names of independently compiled external functions and files, syntax summaries, and references to variables or identifiers introduced in an example. |
|
- |
A hyphen at the end of a command format description, command line, or code line indicates that the command or statement continues on the following line. |
|
numbers |
All numbers in text are assumed to be decimal unless otherwise noted. Nondecimal radixes—binary, octal, or hexadecimal—are explicitly indicated. |
Chapter 1. PCA Overview
What PCA does
The two phases of using PCA: collecting and analyzing information
How to obtain online help while you are running PCA
How to adopt a general methodology for using PCA effectively to locate performance bottlenecks in your applications and determine their causes
1.1. What PCA Does
Where your application spends the most time
What parts of your application are executed the most
What areas of your application are executed (or not) by tests
What parts of your application are compute-bound or I/O-bound
What the dynamic call relationships are among the routines in your application
Where page faults occur
Where your application uses system services
Where your application executes vector instructions
This information helps you pinpoint important qualities of your application, such as the location and nature of performance bottlenecks, or how effective your test coverage is.
1.2. The Two Phases of Using PCA—Collecting and Analyzing Information
Collect performance or coverage information on your running application. This is referred to as the collection phase.
Analyze and interpret the collected information. This is referred to as the analysis phase.
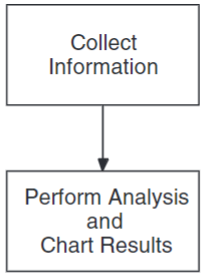
PCA provides two components that correspond to these tasks: the Collector, which collects performance and coverage information about your application while the application is running; and the Analyzer, which you run as a standalone utility to examine and interpret the information that the Collector has gathered.
Figure 1.1, ''PCA Run-Time Usage'' shows the basic cycle of PCA usage: collecting information on your application, then analyzing the results.
1.2.1. The Collector
The Collector gathers performance and coverage information about your running application and stores that information in a data file.
Use the Collector main window to choose the type of information you want to collect.
Start the collection, and continue the normal execution of your application.
Chapter 2, "Running the Collector" gives complete details on using the Collector.

1.2.2. The Analyzer
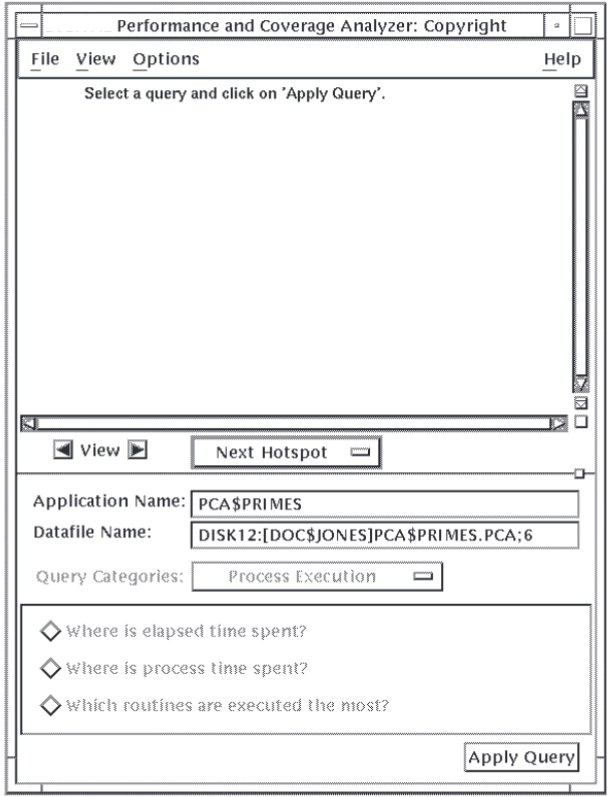
After your application completes its execution cycle, you can use the Analyzer to view and interpret the performance or coverage information that has been gathered. The Analyzer main window is shown in Figure 1.3, ''Analyzer Main Window''.
Histograms or tables
Annotated source listings
The Analyzer also provides several navigational functions so you can easily traverse your application's structure to locate hotspots, places in your application that have generated the most collection activity.
Chapter 3, "Running the Analyzer" explains how to invoke and use the Analyzer.
1.3. Using the Context-Sensitive Online Help
To get help with PCA commands, or any of the qualifiers or parameters used with these commands, type HELP, followed by the command or topic.
Position the pointer on the desired object.
Press and hold the Help key while you press MB1.
Release both keys.
Choose On Context in the Help menu.
Click on any object in the Analyzer window for which you want help.
When you invoke context-sensitive help, PCA displays the Help window shown in Figure 1.4, ''PCA Help Window''.
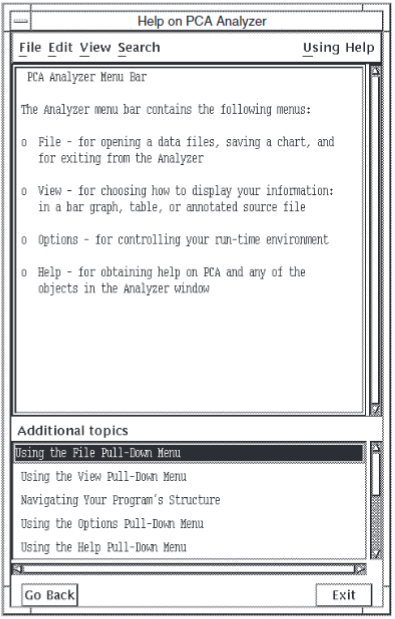
There are two panes in the Help window: a large pane on top, and a small pane below, labeled Additional topics. The large pane describes the screen object on which you clicked. The small pane gives additional topics that are related to the main help topic. You can see the help associated with an additional topic by double clicking on the topic.
1.4. Adopting a PCA Usage Methodology
Although operating PCA is easy, using PCA efficiently and in a way that lets you methodically identify and correct your performance problems involves planning. This guide does not intend to prescribe the best way to use PCA, but hopefully you will find some of the suggestions useful in developing your own usage methodology. You might also find it appropriate to modify some of the suggestions in this guide for your specific applications.
The examples in this guide are based on the general-usage methodology shown in Figure 1.5, ''PCA Usage Methodology''.
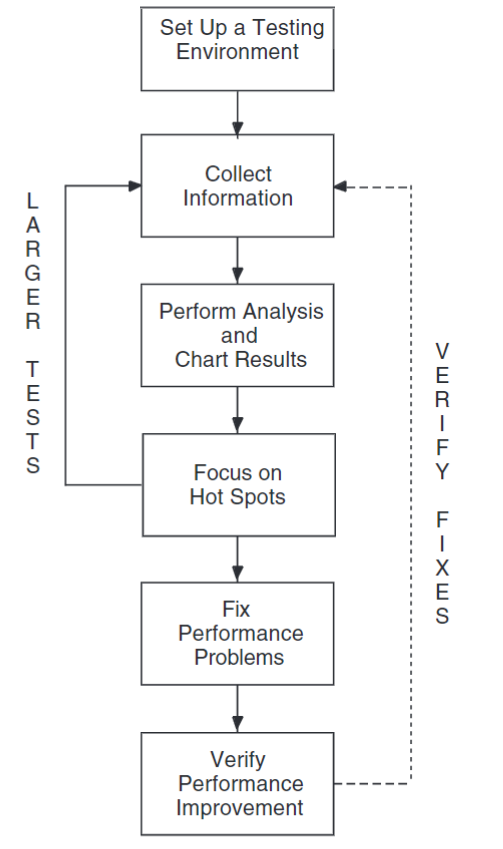
Set up a testing environment.
Your first task is to create separate directory areas for each of the following types of files:Test programs and PCA data files
Copies of source code files
Locally built executable files
Create tests.
Before you begin any performance or coverage testing, plan your tests. When your Collector-linked application starts its execution cycle, you should have tests for exercising all the major functions of your application. In addition, you should have tests that individually exercise different functions in your application, enabling you to focus on specific locations in your application. PCA provides the coverage query category for collecting and examining information that tells you how much of your application's code is exercised by tests.
Allow for a variation in the size of your tests. For example, if you are testing a database application, your initial test might perform 10 define record and 10 delete record operations. Your second test might perform 100 of the same operations, and a third, 1000 such operations. PCA lets you analyze the changes in the database application's behavior under the differing test conditions, giving further clues to the causes of performance bottlenecks.
VSI Test Manager for OpenVMS is useful for managing and executing PCA tests. See Using Using VSI DECset for OpenVMS Systems for information on using PCA with VSI Test Manager for OpenVMS.
Collect application execution information.
Your first collection runs should involve gathering process execution information, such as the following:Where elapsed time is spent
Where process time is spent
Which routines are called the most
This type of information typically provides a broad, high-level view of the general locations of performance bottlenecks. By comparing elapsed time with process time information, you can see where your application is spending idle time. By finding which routines are called the most, you can find which routines require the most performance testing.
Chart and analyze the results of your tests.
After each collection run, invoke the Analyzer and chart the result of the collected information. Take note of those locations that generated a lot of collection activity. You might want to go back to Step 2 and create tests that focus on those hotspots to gain more information.
Repeat the collection and analysis steps with more detailed tests.
After your initial performance and coverage results indicate the general locations of your performance bottlenecks, create new tests that focus specifically on those bottlenecks. For example, if you have a routine that appears to be consuming a lot of elapsed time but not much process time, you might find that the routine is I/O-bound and is frequently in a device wait loop. You can create tests that focus on the I/O activity in that routine that will show specifically which I/O instructions are creating problems.
Correct the performance problems.
After you have determined what the performance bottlenecks are, correct your code accordingly.
Verify performance improvements.
After you have fixed your code, verify that it works by repeating the collection and analysis cycle. Make sure your fixes do not introduce new problems.
1.5. Customizing Your Video Display
The PCA DECwindows interface enables you to change the default values for window sizes and font sizes, to provide more control of multiple PCA display windows.
PCAC.DAT – PCA Collector resource file
PCAA.DAT – PCA Analyzer resource file
Create a local copy of these files to the directory DECW$USER_DEFAULTS,then read the value descriptions in the resource files and modify the values to your preferences.
Chapter 2. Running the Collector
Invoke the Collector.
Specify the performance or coverage information you want on your application.
Start the data collection run.
Exit the Collector.
This chapter explains how to do these steps and lists all thetypes of information you can collect on your application.
2.1. Invoking the Collector
To invoke the Collector, do the following:
- You can invoke the Collector on an image linked for debugging by defining the LIB$DEBUG logical to be SYS$LIBRARY:PCA$COLLECTOR.EXE. This causes the OpenVMS image activator to invoke the Collector as a debugger. You can then enter Collector commands. First link the user program, as follows:
$LINK/DEBUG PCA$PRIMES.OBJ Define the LIB$DEBUG logical.
Type the following commands to define the LIB$DEBUG logical:$LINK/DEBUG PCA$PRIMES.OBJ$DEFINE LIB$DEBUG PCA$COLLECTOR.EXETo return to the OpenVMS Debugger, deassign the logical name LIB$DEBUG, as follows:$DEASSIGN LIB$DEBUGRun the program.
To initiate performance or coverage data collection, run the executable image of your application, as follows:$RUN PCA$PRIMES.EXEPCA Collector Version 4.6PCAC>When the Collector window is displayed on the screen, you have successfully invoked the Collector.
2.2. Specifying Performance or Coverage Information to Collect
Opening a data file to store the performance and coverage information gathered by the Collector
Specifying the performance or coverage information you want to collect by choosing a query
Customizing the collection run to suit your specific requirements
2.2.1. Opening a Data File
Using the DECwindows interface, after the Collector main window is displayed on
your screen, by default the Collector automatically opens a data file. If a data
file with the same name as your application already exists, the Collector opens that
data file and appends new collection information to it. If no such data file already
exists, the Collector creates one, and assigns it the name of the application with a
file type of .PCA.
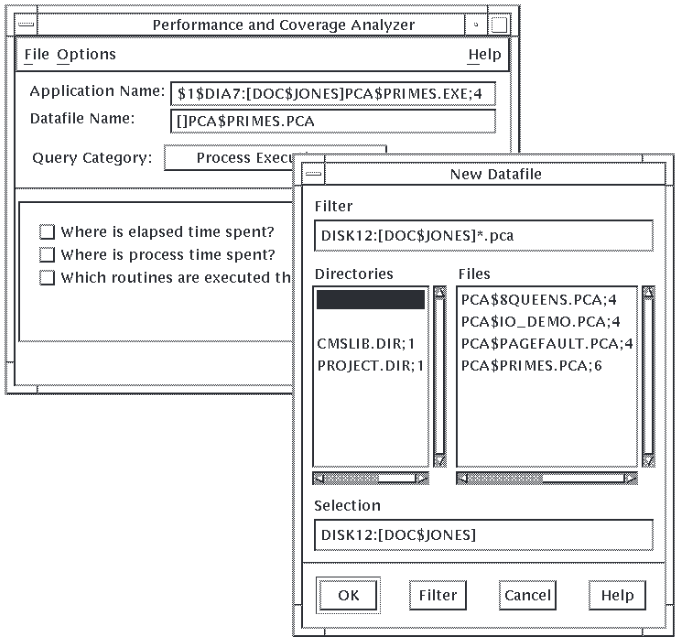
- You can choose New Datafile... from the File menu to open a new data file. You typically do this if:
You want to give the data file a name other than the default.
You want to overwrite an existing data file and not append new collection information to it.
You can choose Open Datafile... from the File menu to open an existing data file. You typically do this if this is not the first collection run on your collector-linked application, and you want to keep all the performance and coverage information for a particular application in one data file.
Although it is not required in most cases, you should keep all the performance and coverage information for an application in one data file.
Figure 2.1, ''Opening a Data File'' shows the File menu and the New Datafile dialog box.
2.2.2. Choosing a Query
This section describes how to choose a query using the DECwindows interface. A query is a specific question appearing in the Collector main window that corresponds to a specific type of information to collect. For example, the query that corresponds to elapsed time information is "Where is elapsed time spent?" A query category is a grouping of associated queries. For example, the Process Execution query category contains three queries that pertain to the basic run-time characteristics of your application: where the most elapsed and process time is spent, and what routines are executed the most.
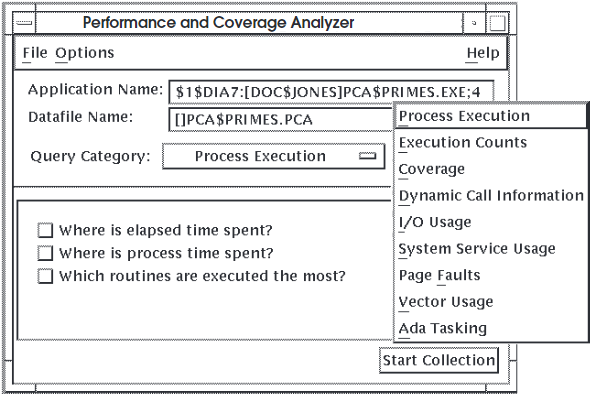
Choose a query category from the Query Category menu.
Click on the box to the right of the Query Category label. A menu of available query categories is displayed. When you choose a category, the Collector displays the associated queries in the query pane at the bottom of the window.
Figure 2.2, ''Collector Query Pane'' shows the Collector main window, Query Category menu, and query pane. By default, the Collector displays the Process Execution queries because this category is typically the best place to begin analyzing your application's performance.
Choose a specific query in the query pane.
2.2.3. Customizing the Collection Run
The sampling interval for elapsed time or process time
The collection elements for information such as execution counts and coverage information
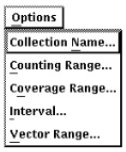
Use the Options menu to get access to the customization functions, as shown in Figure 2.3, ''Collector Options Menu''. This pull-down menu's Vector Range option is available only on OpenVMS VAX systems.
2.2.3.1. Customizing the Sampling Interval for Elapsed or Process Time
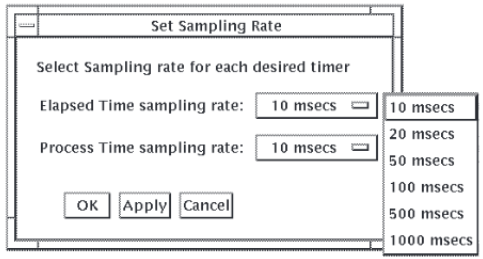
When the Collector gathers information on where your application is spending the most time, it uses an algorithm that involves noting the currently executing program address at regular intervals of time. By default, the interval is 10 milliseconds.
Choose the Interval... menu item from the Customize menu.
In the Set Sampling Rate dialog box, click on the menu next to either the Elapsed Time or Process Time sampling rate labels.
Choose a sampling rate in the displayed menu.
Figure 2.4, ''Set Sampling Rate Dialog Box'' shows the Set Sampling Rate dialog box.
2.2.3.2. Specifying Collection Elements
Counting information
Coverage information
Focusing collection activity on specific program elements in your application is useful once you have narrowed down the locations of your performance bottlenecks, or if you have a particularly large application.
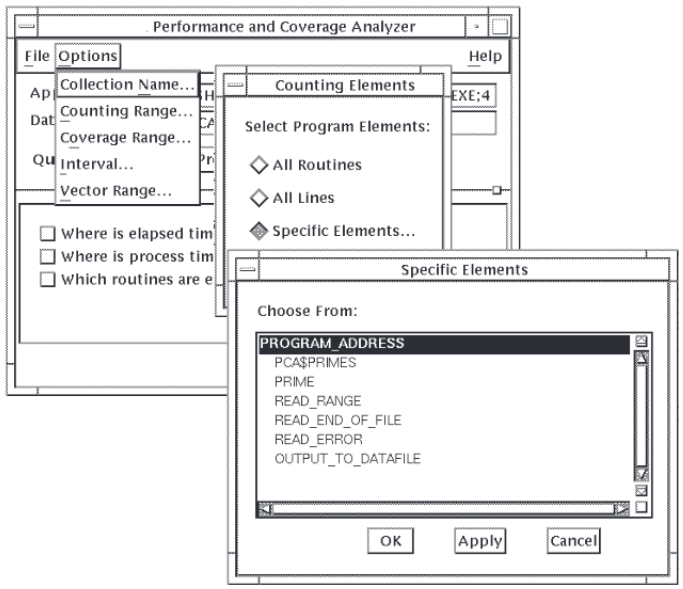
Figure 2.5, ''Specific Elements List Box'' shows the Specific Elements list box, which is displayed when you choose Specific Elements... in the Counting Range, Coverage Range, or Vector Range dialog boxes. To specify a module or routine in the Specific Elements list box, click on the module or routine name, then click on OK.
2.3. Starting the Collection Run
After you invoke the Collector and optionally set the data file and collection type, enter the GO command to start data collection. To run your program without collecting data, use the /NOCOLLECT qualifier with the GO command.
To start the collection using the DECwindows interface, click on Start Collection in the Collector main window.
The Collector main window disappears and the application begins execution. As the execution proceeds, the Collector gathers information. When the application completes its normal execution cycle, the collection is also completed.
2.4. Exiting the Collector
Caution
If you press Ctrl/Y, do not use the DCL STOP command immediately afterwards. If Ctrl/Y interrupts the Collector when the Collector is executing supervisor-mode code, a subsequent STOP command might cause a supervisor-mode exception that kills your entire process and logs you out. To avoid this, execute another program after pressing Ctrl/Y, or type EXIT. The Collector's exit handlers then successfully close out the data collection.
To stop Collector output to your terminal, such as SHOW command output, press Ctrl/C. The Collector aborts the command and returns to DCL level.
PCAC>SET DATAFILE/APPEND PCA$PRIMES.PCA
You can run your program without collecting data by issuing the GO command with the /NOCOLLECT qualifier.
The Collector allows you to collect different kinds of data in the same collection run, but you should be cautious in doing so. Values can be distorted if different kinds of data are collected in the same collection run. The Collector provides informational messages warning about potential conflicts.
2.5. Query Categories
Process Execution
Execution Counts
Coverage
The query category Vector Usage applies to OpenVMS VAX systems only. All other categories apply to both OpenVMS VAX and OpenVMS Alpha systems.
2.5.1. Process Execution Query Category
Where is elapsed time spent?
Where is process time spent?
Which routines are executed the most?
OpenVMS Alpha systems offer an additional "Where are unaligned data exceptions?" query. By comparing where your application spends the most elapsed and process time, you can determine where your application spends idle time.
2.5.2. Execution Counts Query Category
Which lines are executed the most?
Which routines are executed the most?
Which modules are executed the most?
Examining execution counts information helps you to identify inefficient algorithms, or excessive calls to other routines or system services in your application.
2.5.3. Coverage Query Category
What percentage of the application was covered?
Where is the application covered?
Which routines were completely NOT covered?
Where is the application acceptably not covered?
Designing tests that execute all the code paths of your application is important in determining how your application performs under the circumstances for which the application is intended.
Collecting coverage information is useful for determining if the tests you are using during your collection runs are adequately covering all your application's code paths. In addition, collecting coverage information can tell you how to change your tests to give acceptable code path coverage if the tests initially do not adequately exercise all code paths.
2.5.4. Dynamic Call Information Query Category
What is the call tree structure?
Which routines call which other routines?
Which routines make the most calls?
By determining the basic, run-time calling relationships among the routines in your application, especially determining which routines are executed most, you can determine if your application is calling routines efficiently.
2.5.5. I/O Usage Query Category
Where is I/O being done?
What I/O system services are being used?
Where are I/O reads being used?
What is the number of I/O read counts?
Where are I/O writes being used?
What is the number of I/O write counts?
Where are I/O reads and writes used?
What files is I/O done to?
What file virtual block numbers are used?
What file keys are used?
What are the record sizes being used?
By comparing I/O usage information with process execution and executions counts information, you can determine if your application is using I/O services excessively or inefficiently.
2.5.6. System Service Usage Query Category
Where are system services used?
What system services are used?
By comparing system service usage information with process execution and executions counts information, you can determine if your application is using system services excessively or inefficiently.
2.5.7. Page Faults Query Category
Where are the page faults occurring?
What are the addresses causing page faults?
Page fault information is useful in determining how your application is using system resources in general. For example, page fault information can tell you why your application is consuming a lot of time in system space.
2.5.8. Vector Usage Query Category
Where is vector processing time spent?
Where are vector instructions executed?
What vector instructions are used?
What are the vector lengths used?
What is the number of elements set in the vector masks?
What is the distribution of vector register usage?
What vector strides are used?
Where are the largest number of vector operations used?
If you have an application running on a computer with a vector processor, you can use the information from the Vector Usage category to determine how efficiently your application is using the vector processor. In addition, you can determine how you have split the processing of your application between the scalar and vector processors in your computer.
2.5.9. Ada Tasking Query Category
What tasks are performing context switching?
What are the Ada tasking names used?
What are the Ada tasking types used?
What are the Ada task priorities used?
Chapter 3. Running the Analyzer
After you collect information, you must analyze it; that is, choose the same queries as in the collection phase and interpret the results.
Invoke the Analyzer.
Open the performance data file (if you did not specify one in the command line to invoke the Analyzer)
Choose a query to specify the information to be displayed.
Navigate through the Analyzer display (change the view in the display, traverse a chart, or zoom in on the display for more detailed information).
Exit the Analyzer.
3.1. Invoking the Analyzer
To invoke the Analyzer, type the following command at the system prompt:
$PCA [DATAFILE]
In the command line, the optional argument datafile represents the name of the performance data file you want to analyze.
Note
$PCA /INTERFACE=DECWINDOWS [DATAFILE]$PCA /INTERFACE=CHARACTER_CELL [DATAFILE]
3.2. Opening the Performance Data File
Specify the name of the data file in the Analyzer invocation command, shown in Section 3.1, ''Invoking the Analyzer''
Choose Open Datafile... from the File menu in the Analyzer main window.
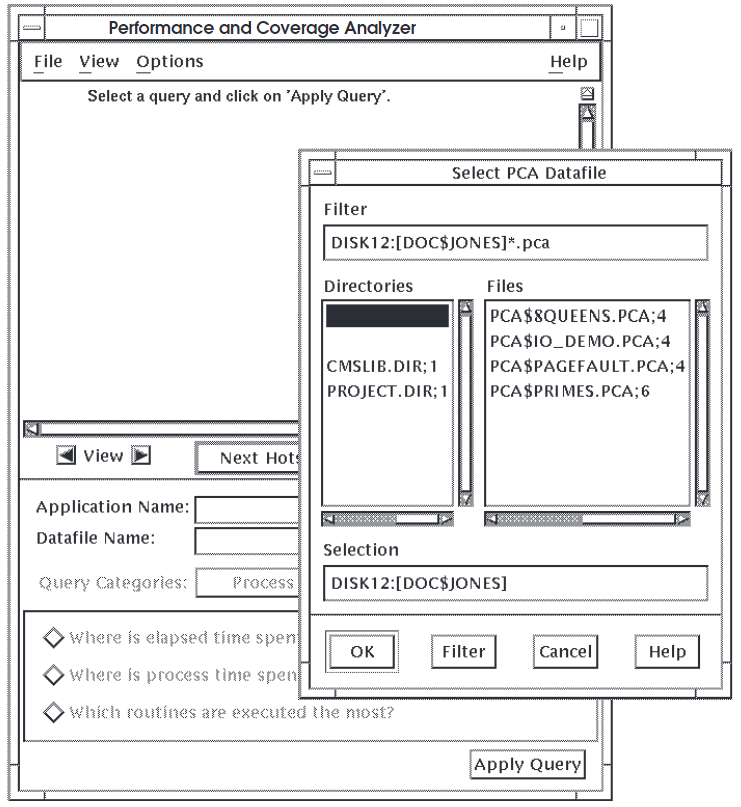
If you choose the latter option, PCA displays the Select PCA Datafile dialog box shown in Figure 3.1, ''Selecting a Data File''.
Click on the data file you want to open in the Files list box, or type the name of the data file directly into the Selection box.
Click on OK.
The Select Datafile dialog box is a standard DECwindows file selection box. To get help on using the file selection box, choose the On Context option under the Help menu. With your cursor in the form of a question mark, click on a button or field label to view the online help explanation for the selected item.
3.3. Specifying Information to Be Displayed
After you open a data file, you display the information contained in it by choosing a query. Figure 3.2, ''Analyzer Main Window Query Panel'' shows the Analyzer query panel using the DECwindows interface.
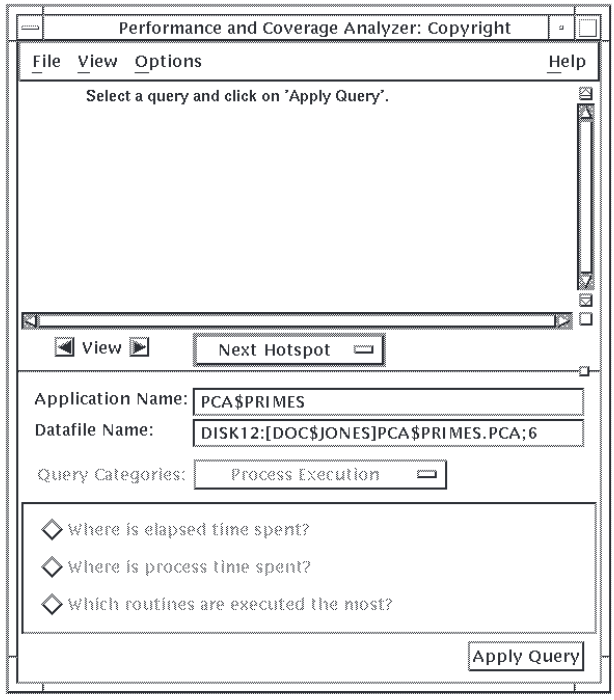
By default, the Analyzer checks the data file and sets the query category to what was collected in the data file. Queries for which no information was collected are grayed out. To change the query category, use the Query Category menu.
Once you have chosen the query for which you want to see information, click on the Apply Query button. The Analyzer displays a chart that graphically shows information in response to the query you have chosen.
A histogram of routines for elapsed or process time
An annotated source listing for execution counts of lines in your program
You can change charts with the View menu at the top of the Analyzer window, or with the View arrow buttons in the middle of the window.
3.4. Navigating Through the Analyzer Charts
The Analyzer facilitates navigating through the charts and locating areas of more detailed information. The basic object the Analyzer locates is called a performance hotspot, or "hotspot." A hotspot is a line or area of code that generated collection activity for the current query.
When you display a histogram or table in the Analyzer, by default the Analyzer sorts the entries in the display in descending order of collection activity. Next to each entry in the histogram or table, the Analyzer also displays the percentage of total collection activity generated by that entry.
3.4.1. Changing Charts
Histograms and tables
Call trees
Annotated source listings
Figure 3.3, ''Sample Histogram'', Figure 3.5, ''Sample Annotated Source Listing'', and Figure 3.5, ''Sample Annotated Source Listing'' show, respectively, a sample histogram, call tree, and annotated source listing.

3.4.2. Traversing Charts
Next—Positions the display at the next hotspot, in descending order.
First—Positions the display at the hotspot that generated the most collection activity.
Previous—Positions the display at the previous hotspot, in ascending order.
Current—Positions the display at the currently selected chart entry. This function is useful if you have scrolled ahead of the current hotspot and want to return to it.
3.4.3. Adjusting the Granularity of Information in the Displays
Left arrow view button—Redraws the current chart to display less granularity of information. For example, if the current chart is an annotated source listing of your application, clicking on the left arrow causes the display to show only the routines in your application.
If you select an entry in the current chart, the left arrow view button applies only to that entry.
Right arrow view button—Redraws the current chart to display more granularity of information. For example, if the current chart is a histogram of routines, clicking on the right arrow view button causes the display to show individual lines of code.
If you select an entry in the current chart, clicking on the right arrow view button applies only to that entry.
You can increase the granularity of information only from views of modules or routines; you can decrease the granularity of information only from views of lines or routines.
3.5. Stopping Terminal Output or Exiting the Analyzer Session
To stop the Analyzer's terminal output, such as long output from a SHOW or LIST command, press Ctrl/C. The Analyzer aborts the current output operation and prompts for a new command.
To end the Analyzer session, enter the EXIT command or press Ctrl/Z.
Chapter 4. Determining an Application's Basic Run-Time Characteristics
Which modules, routines, or lines consume the most elapsed time and process time
Which modules, routines, or lines consume the most idle time
Which routines are called the most
By examining these characteristics, you can determine where your performance bottlenecks are, what your I/O service wait times are, what your page faulting time is, and so on.
Where is elapsed time spent?
Where is process time spent?
Which routines are executed the most?
4.1. Collecting Process Execution Information
Compile your application for use with the OpenVMS Debugger.
Link your application for use with the Collector.
Invoke the Collector.
Open a performance data file.
Choose the Process Execution query category from the Query Category option menu.
Choose each of the queries in the Process Execution category, one at a time, in individual collection runs.
Click on Start Collection.
For more information on performing these steps, see Chapter 2, "Running the Collector".
Analyze and interpret elapsed time and process time information.
Compare elapsed time and process time information to make initial findings on where your application is spending idle time.
Locate the routines that are called the most in your application.
4.2. Analyzing Elapsed Time Information
Invoke the Analyzer and specify the name of the data file containing the information you want to see. (See Chapter 3, "Running the Analyzer" for details on completing this step.)
Choose the Process Execution query category.
Choose the query "Where is elapsed time being spent?"
Click on Apply Query.
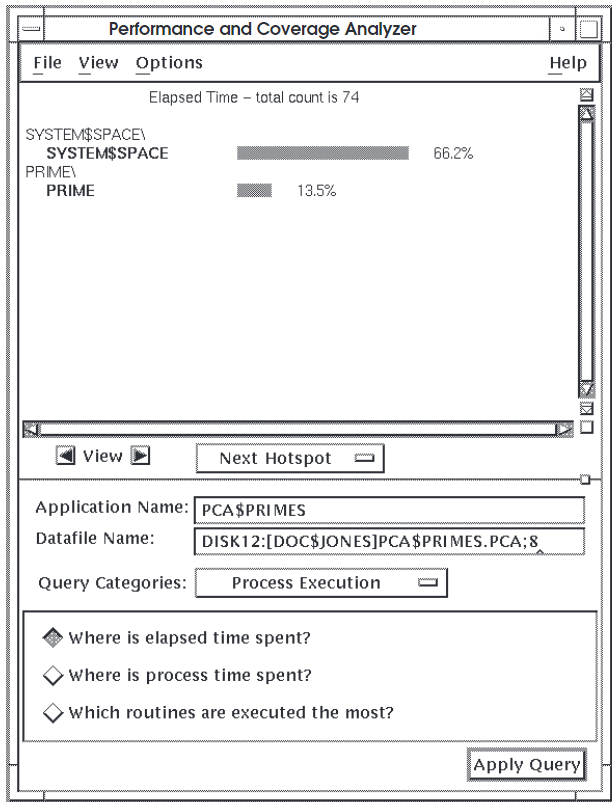
Figure 4.1, ''Sample 1 of Elapsed Time Histogram'' shows a histogram of elapsed time information for
the application PCA$PRIMES.
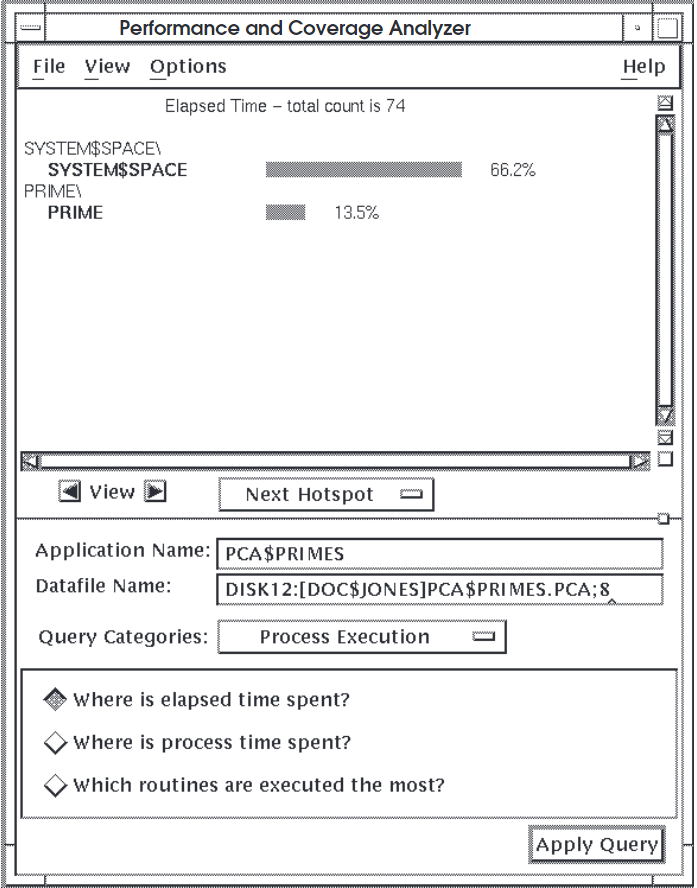
66.2 percent of all elapsed time is spent in
SYSTEM$SPACE.13.5 percent of all elapsed time is spent in the subroutine
PRIME.- No elapsed time information is recorded for any of the other modules or subroutines in
PCA$PRIMES, including the following:OUTPUT_TO_DATAFILE
READ_RANGE
PCA$PRIMES
SYSTEM$SERVICE
READ_END_OF_FILE
READ_ERROR
READ_RANGE
4.2.1. Elapsed Time Information
The routines are not called often enough.
The test run was inadequate to cover all the code paths in the application.
The elapsed time collection interval was inappropriate for the particular test run or the application.
The routines are never called due to a logic error in the application.
Redesign your tests.
You can use the Coverage query category to choose queries that give you specific information on routine and line test coverage of your application. Thus, you can see whether your tests are calling routines that report zero elapsed time.
Create tests that run longer.
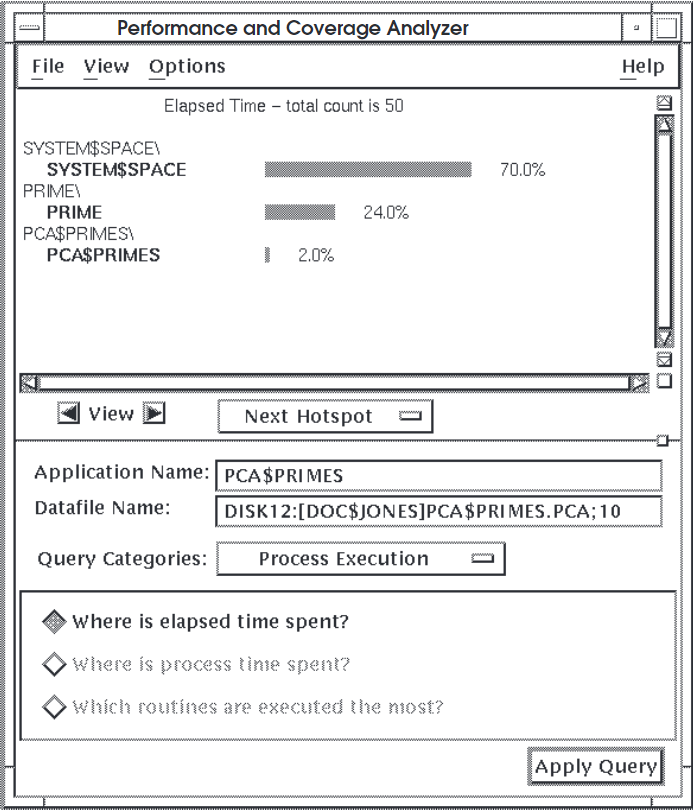
4.2.2. Elapsed Time in System Space
Some applications appear to spend a lot of time in system space, as the histogram in Figure 4.2, ''Sample 2 of Elapsed Time Histogram'' shows.
4.3. Analyzing Process Time Information
The next step is to collect process time information and compare it to the elapsed time information.
Choose the Process Execution query category.
Choose the query "Where is process time being spent?"
Click on Apply Query.
Figure 4.3, ''Process Time Histogram'' shows two histograms: the one on the left is for
elapsed time for PCA$PRIMES the other is for process time information on
the same program.
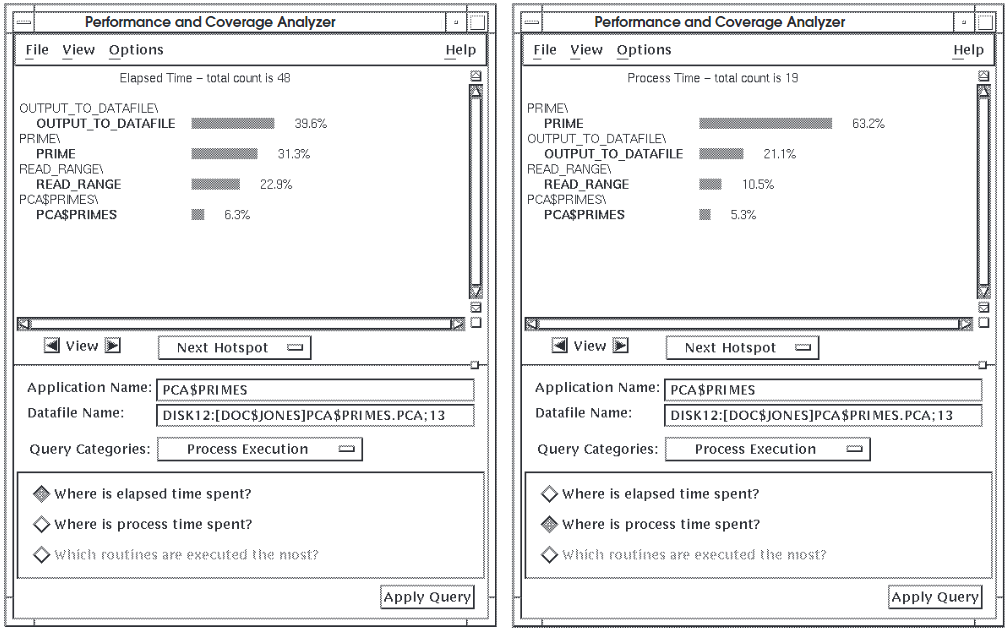
63.2 percent of all process time is spent in subroutine
PRIME.21.1 percent of all process time is spent in subroutine
OUTPUT_TO_DATAFILE.10.5 percent of all process time is spent in subroutine
READ_RANGE.5.3 percent of all process time is spent in module
PCA$PRIMES.
Finding Idle Time in an Application
PCA$PRIMES,you can make the following initial conclusions:A significant difference exists between the amount of elapsed time and process time spent in subroutines
PRIMEandOUTPUT_TO_DATAFILE.Routine
OUTPUT_TO_DATAFILEgenerates significantly more elapsed time than process time information. This indicates that there is a sizable amount of idle time in that routine due, perhaps, to an I/O wait loop.By comparison, routine
PRIMEconsumes the majority of process time, but considerably less elapsed time. This might indicate thatPRIMEis computation-bound due to an inefficient algorithm.Routine
READ_RANGEand module PCA$PRIMES are not generating a lot of process or elapsed time information. It is premature to assume there are no performance problems with these code locations, however; different test conditions might turn up significantly different results. As with routines that do not generate any collection activities, check your tests to see if they are exercising all the code paths, or taking into account all the different conditions under which the application is likely to be used.The other routines in
PCA$PRIMESare not generating any collection activity for process time information.
4.4. Analyzing Routine Calling Relationships
For more clues on the basic run-time characteristics of your application, analyze the routine calling relationships. This, in conjunction with elapsed and process time information, can help you determine if a performance bottleneck is caused by excessive calls to one or two particular routines.
To analyze routine calling relationships in an application using the DECwindows interface, do the following:
Choose the Dynamic Call Information query category.
Choose the queries ‘‘Which routines are called the most?’’ or ‘‘Which routines make the most calls?’’
Click on Apply.
To get complete information on the routine calling relationships in your application, get information from both queries mentioned in the previous list.
4.4.1. Analyzing Elapsed Time Information in an Annotated Source Listing
When you see elapsed time information displayed in a histogram, you can get abroad measure of what routines are consuming the most elapsed time. You can increase the granularity of the elapsed time information in the Analyzer by displaying an annotated source listing.
Although the current chart can be a histogram, you can view elapsed time information in an annotated source listing. Use the DECwindows interface by clicking on the right arrow view button.
Chapter 5. Finding an Application's Most Executed Parts
This chapter shows how to use PCA to collect and analyze execution count information. Collecting execution count information tells you how many times each line in a module or routine is executed. This information can help you find the exact location and possible causes of performance bottlenecks.
Collecting execution counts information
Analyzing and interpreting execution counts information
Which lines are executed the most?
Which routines are executed the most?
Which modules are executed the most?
5.1. Collecting Execution Counts Information
Compile your application for use with the OpenVMS Debugger.
Link your application for use with the Collector.
Define the Collector as your process debugger.
Invoke the Collector.
Open a performance data file.
Choose the Execution Counts query category from the Query Category option menu.
Choose Set Counting Range... from the Customize menu, as shown in Figure 5.1, ''Selecting Execution Counts for a Specific Routine''.
Figure 5.1. Selecting Execution Counts for a Specific Routine 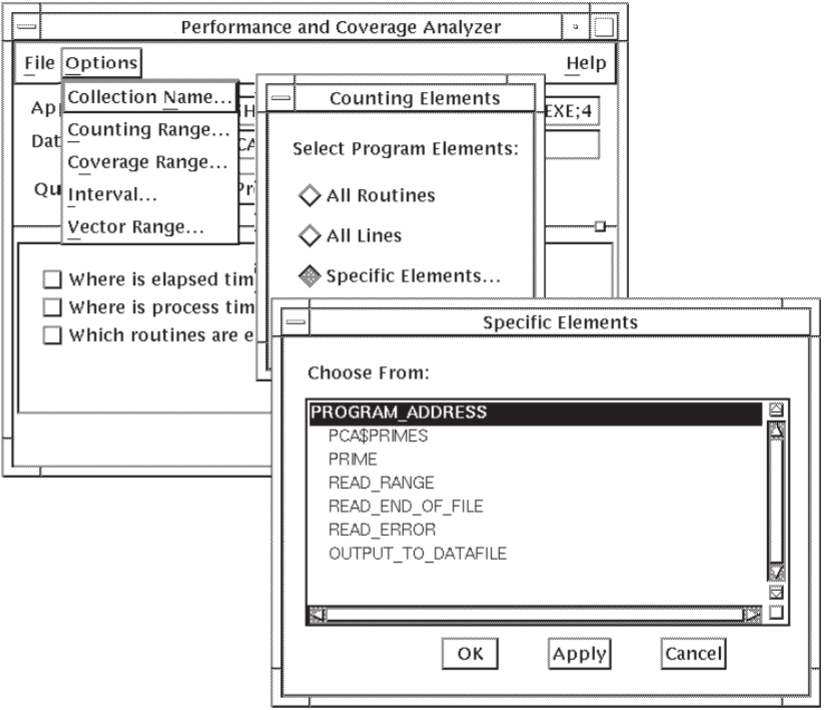
Click on Specific Elements... in the Counting Elements dialog box.
In the Specific Elements dialog box, select the routine for which you want to collect execution counts information. Double click on entries in this dialog box to expand them to individual routines.
Click on OK in the Specific Elements dialog box.
Click on OK in the Counting Elements dialog box.
Click on "Which lines are executed the most?" in the query panel.
Click on Start Collection.
5.2. Analyzing Execution Counts Information
Invoke the Analyzer and specify the name of the data file containing the information you want to look at. (Chapter 3, "Running the Analyzer" describes this step.)
Choose the Execution Counts query category.
Choose the query "Which routines are executed the most?" in the Execution Counts query panel.
Click on Apply Query.
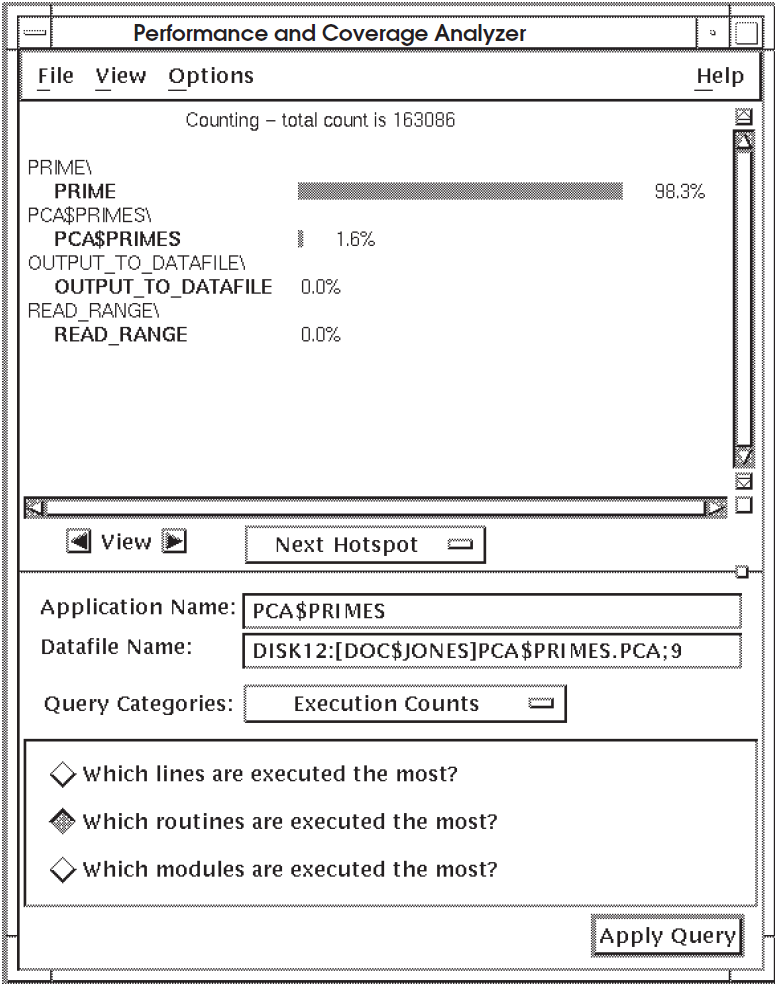
Figure 5.2, ''Execution Count Information By Routine'' shows a histogram of execution count information
for each routine in the application PCA$PRIMES.
To see counting information by line, click on the right arrow view button. The Analyzer displays an annotated source listing that gives detailed line counting information, as shown in Figure 5.3, ''Line Count Information''.
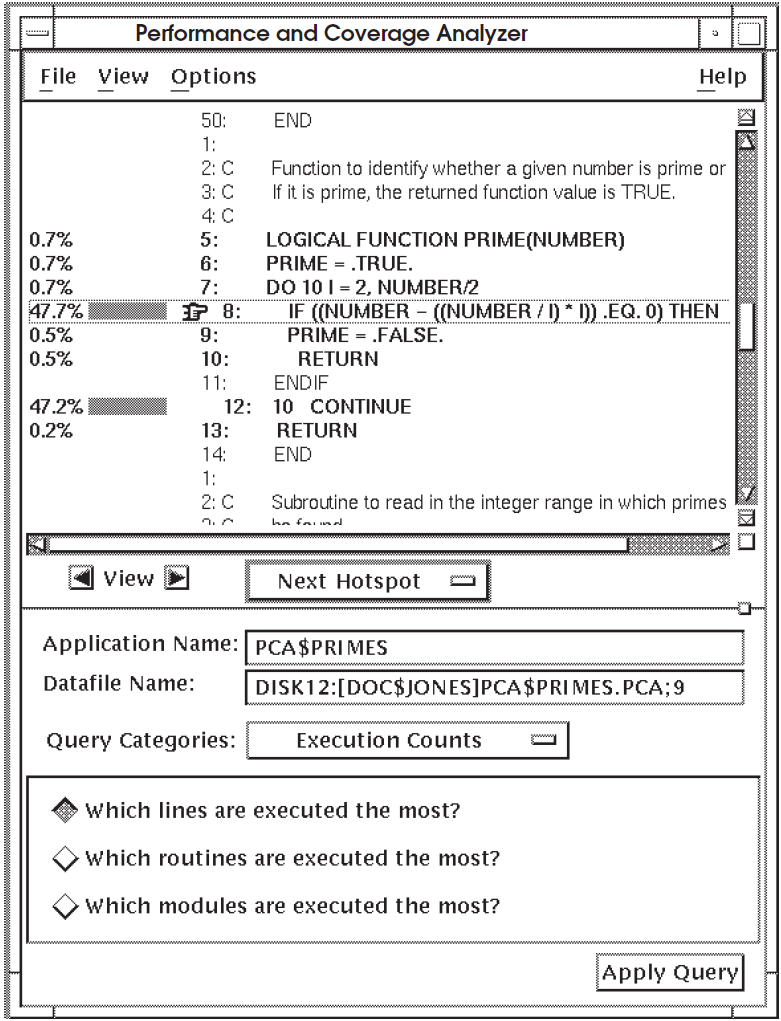
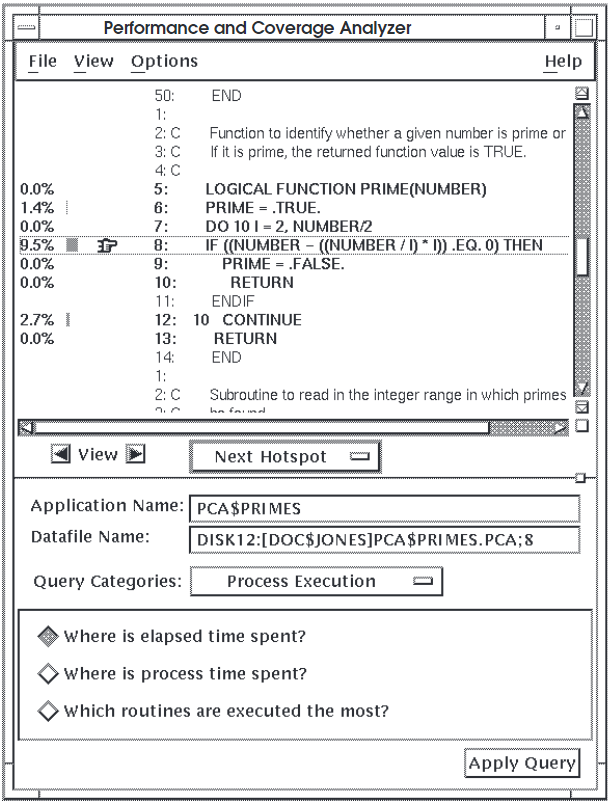
Figure 5.3, ''Line Count Information'' shows that lines 8 and 12 account for almost 95
percent of all the executed lines in routine PRIME. When a high percentage
of line count information is concentrated in one loop, you should evaluate whether you
can rewrite the loop to be more efficient.
Examine loops.
If a loop is generating a high amount of counts, examine the code structure of the loop carefully. For example, look for redundant variable assignments or inappropriate algorithms, such as inefficient sort or search routines.
Compare elapsed time information with counting information.
If a code location is consuming a lot of time but not generating a lot of line count activity, search for the reason. For example, your program could be spending a lot of time waiting for I/O services. For more information on finding where your application uses system services,see Chapter 7, "Determining How Your Application Uses System Resources".
Examine the relationship between the number of times the routine is called and the line count information for the lines in the routine.
For example, if a routine is called 2,000 times and each line in the routine is executed 2,000 times (that is, each line is executed once each time the routine is called), the performance characteristics of that routine are probably good. However, you should look at why the routine is called 2,000 times and see whether that number is appropriate.
By contrast, if a routine is called only once but each line in the routine is executed 2,000 times, you should investigate why. The routine itself might have inefficient algorithms in it, depending on what the routine's function is.
Finally, if you have a routine that is called 500 times and each line in the routine is called 2500 times, you should investigate the routine and where the routine is being called from.
Chapter 6. Determining Test Coverage
Where your application is covered by tests
Where your application is not covered by tests
Where your application is acceptably not covered by tests
With this information, you can determine whether all the code paths in your application are being executed satisfactorily.
What percentage of the application was covered?
Where is the application covered?
Which routines were completely NOT covered?
Where is the application acceptably not covered?
6.1. Collecting Test Coverage Information
Compile your application for use with the OpenVMS Debugger.
Link your application for use with the Collector.
Define the Collector as your process debugger.
Invoke the Collector.
Open a performance data file.
Choose the Coverage query category from the Query Category option menu.
Choose a query in the Coverage query panel.
If you have a particularly large application and you want test coverage information on a particular module or routine, use the Customize menu and choose the Set Coverage Range... menu item.
Click on Start Collection.
6.2. Analyzing Test Coverage Information
Invoke the Analyzer and specify the name of the data file containing the information you want to see. (Chapter 3, "Running the Analyzer" describes this step.)
Choose the Coverage query category.
Choose one of the queries in the coverage query panel, as described in the following sections.
6.2.1. Showing Where Your Application Is Covered By Tests
Choose the query "Where is the application covered?"
Click on Apply Query.
The Analyzer displays a histogram showing the total test coverage among all the
routines in your application. Figure 6.1, ''Test Coverage Histogram'' is an example test
coverage histogram of the application PCA$PRIMES.
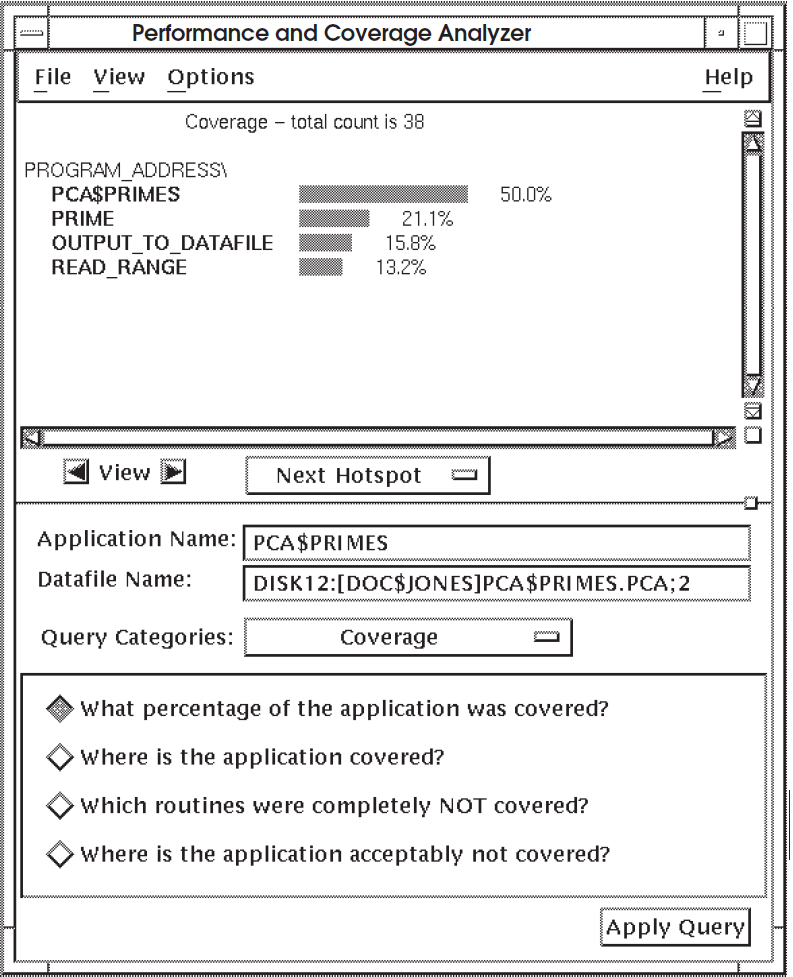
In Figure 6.1, ''Test Coverage Histogram'', the bars and percentage figures for each line represent the percentage of coverage points for that line, with respect to the total number of lines covered.
For a breakdown of test coverage by line, click on the right arrow view button. Figure 6.2, ''Test Coverage Information By Line'' is an example of an annotated source listing showing which lines were covered by tests.
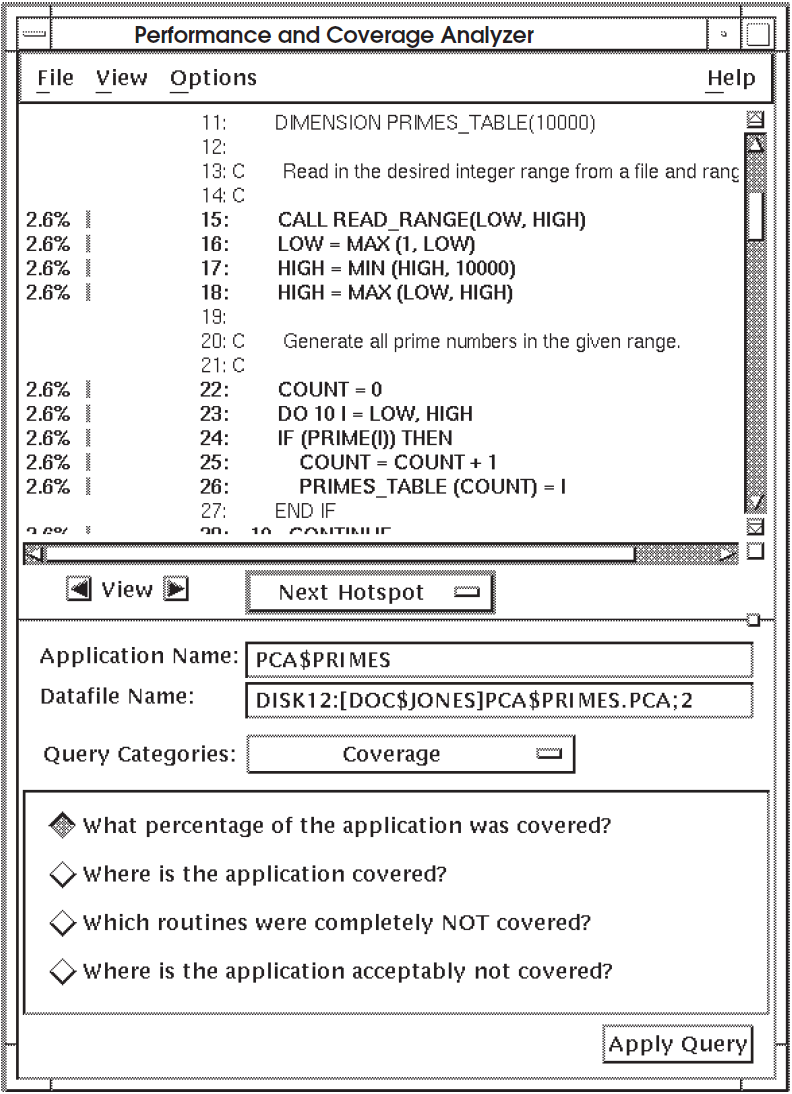
In Figure 6.2, ''Test Coverage Information By Line'', the Analyzer displays a nonzero percentage figure to the left of lines that were covered, and a zero percentage figure next to the lines that were not covered.
6.2.2. Showing Where an Application Is Not Covered By Tests
Choose the query "Which routines were completely NOT covered?"
Click on Apply Query.
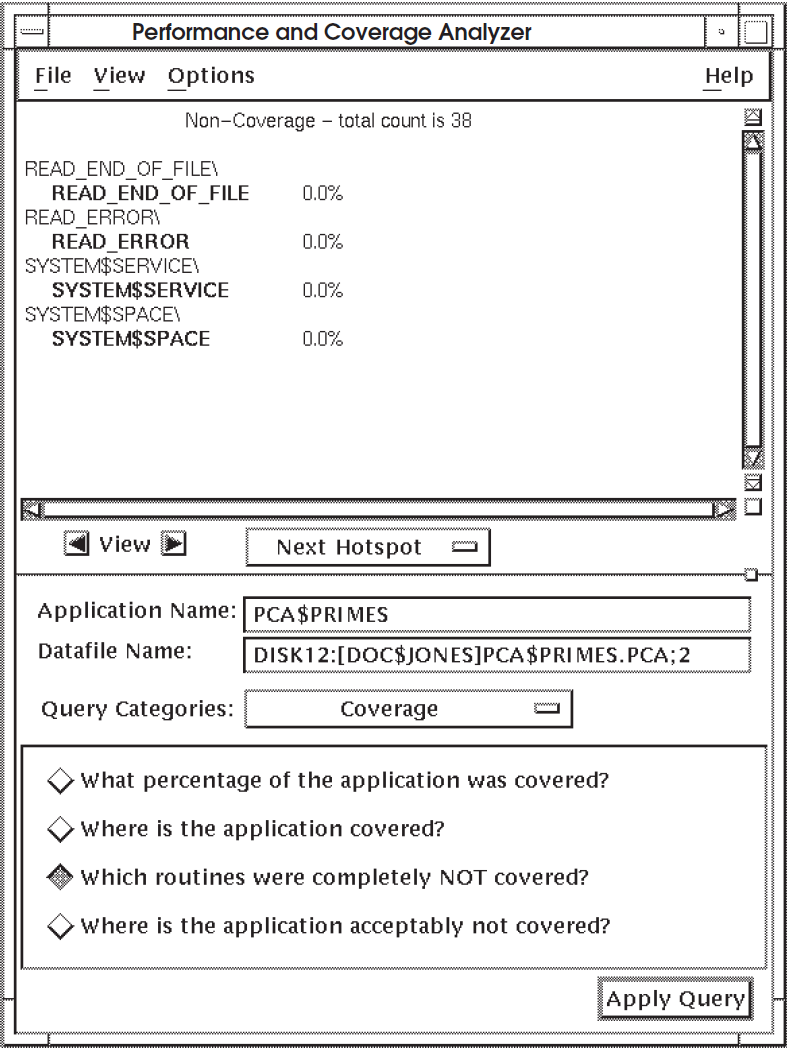
The Analyzer displays a histogram showing only those routines that received no
test coverage at all. Figure 6.3, ''Test Noncoverage'' is an example histogram
that shows routines that were completely not covered by tests in the application
PCA$PRIMES.
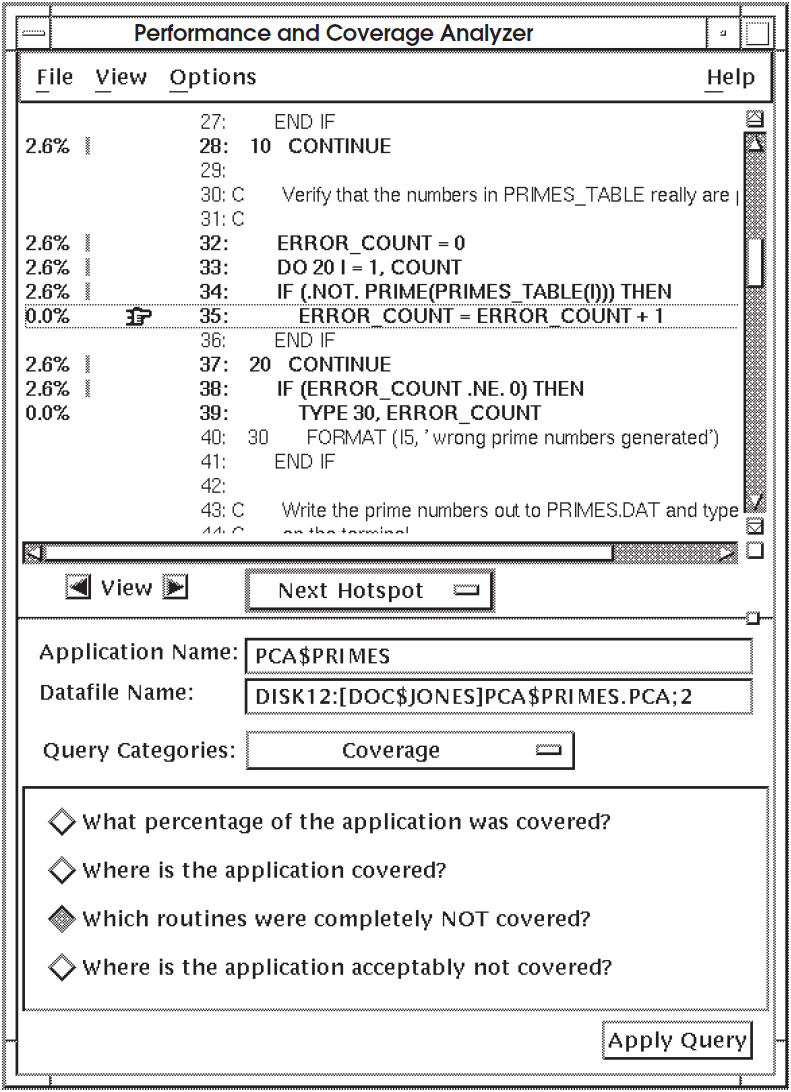
For a breakdown of test noncoverage by line in a particular routine, click onthat routine in the display pane and click on the right arrow View button. To see the first occurrence of a noncovered line, click on Next Hotspot in the Navigate menu. Figure 6.4, ''Test Noncoverage Information By Line'' is an example of an annotated source listing that shows which lines were not covered by tests. The display points to the first occurrence of a noncovered line.
Chapter 7. Determining How Your Application Uses System Resources
System services use
I/O services use
Page fault information
Ada tasking
Your application has locations where it is spending idle time—places where the elapsed time is higher than the process time.
Your application is spending a lot of time in system space.
By examining system resource usage information, you can get clues as to where and how you need to optimize your use of system services and I/O operations.
Where are system services used?
What system services are used?
Where is I/O being done?
What I/O system services are being used?
Where are I/O reads being used?
What is the number of I/O read counts?
Where are I/O writes being used?
What is the number of I/O write counts?
Where are I/O reads and writes used?
What files is I/O done to?
What file virtual block numbers are used?
What file keys are used?
What are the record sizes being used?
Where are the page faults occurring?
What are the addresses causing page faults?
What tasks are performing context switching?
What are the Ada tasking names used?
What are the Ada tasking types used?
What are the Ada task priorities used?
7.1. Collecting System Services, I/O Use, and Page Fault Information
Compile your application for use with the OpenVMS Debugger.
Link your application for use with the Collector.
Define the Collector as your process debugger.
Run your application.
Open a performance data file.
Choose the System Service Usage query category from the Query Category option menu.
Choose one of the queries in the System Service Usage query panel.
Click on Start Collection.
In subsequent collection runs, repeat Steps 1 through 4, then choose the I/O Usage and Page Faults query categories. Choose one of the queries, then click on Start Collection.
For more information on performing these steps, see Chapter 2, "Running the Collector".
The remaining sections in this chapter show how to use the Analyzer to understand the nature of your application's use of system services and I/O services.
7.2. Analyzing System Service Usage Information
Invoke the Analyzer and specify the name of the data file containing the information you want to see. (Chapter 3, "Running the Analyzer" describes this step.)
Choose the System Service Usage query category.
Choose the query "Where are system services used?"
Click on Apply.
Where system services are being used. Check whether your application is calling system services from several different locations. If so, you might want to centralize where your application uses system services.
What system services are being used. If a system service is I/O-oriented—for example,
SYS$GETorSYS$PUT—focus on your I/O usage activity.Whether you have system services that are consuming a lot of elapsed time. If so, you might improve performance by optimizing your use of those services.
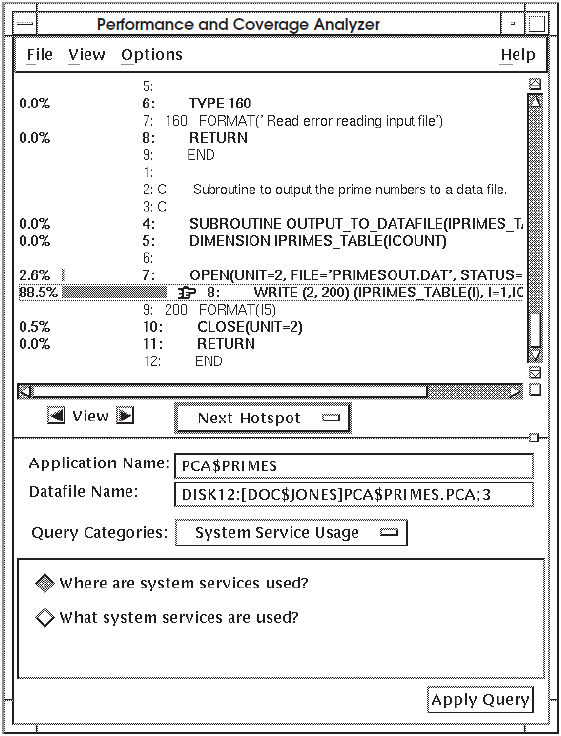
7.2.1. Finding Where System Services Are Being Used
Choosing the query "Where are system services used?" shows you where
system services are used in your application. You can see that information by
routine or by line in a histogram or table. Figure 7.1, ''Histogram Showing Where System Services Are Used'' is a
histogram showing by routine where system services were used in the application
PCA$PRIMES.
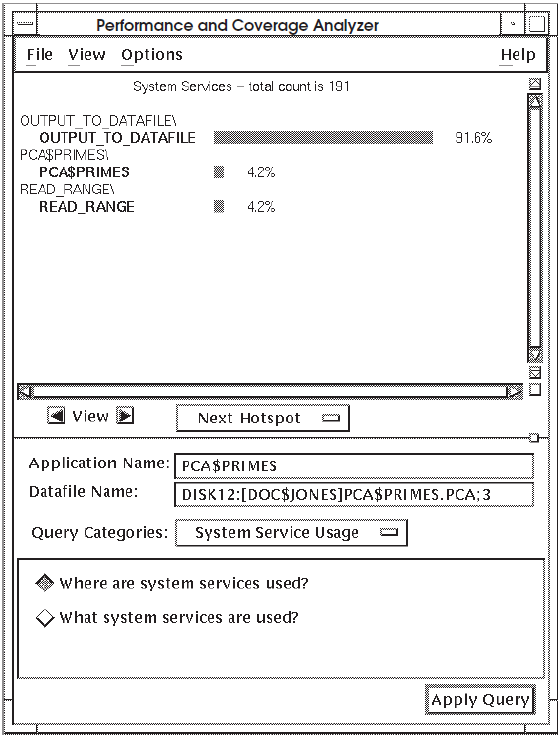
In Figure 7.1, ''Histogram Showing Where System Services Are Used'', nearly all the system services are used in the
routine OUTPUT_TO_DATAFILE.
To get more information on system services usage, click on the right arrow View
button. Figure 7.2, ''Annotated Source Showing Where System Services Are Used'' shows an annotated source listing of system
service usage for each line in the application PCA$PRIMES.
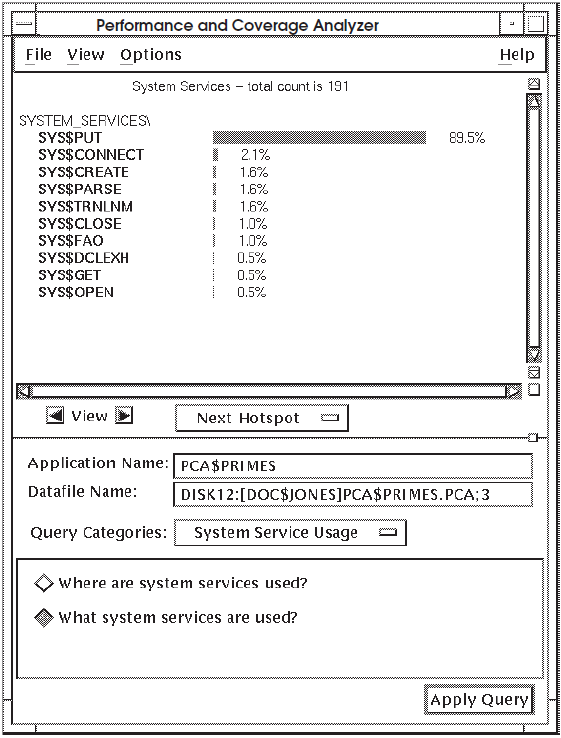
7.2.2. Finding What System Services Are Being Used
Choosing the query "What system services are used?" causes the Analyzer to display a histogram showing what system services are being used in your application, as shown in Figure 7.3, ''Histogram Showing What System Services Are Used''.
7.3. Analyzing I/O Usage Information
Invoke the Analyzer and specify the name of the data file containing the information you want to look at. (Chapter 3, "Running the Analyzer" describes this step.)
Choose the I/O Usage query category.
Choose the query "Where is I/O being done?"
Click on Apply.
Where I/O services are being used
What I/O services are being used
Whether you have I/O services that generate a lot of idle time
Whether you have I/O services that generate a lot of execution counts information
7.3.1. Finding Where I/O Operations Are Being Performed
When you choose the query "Where is I/O being done?" the Analyzer
displays a histogram showing the routines that are making the most use of I/O
operations. Figure 7.4, ''Histogram Showing Where I/O Operations Are Being Performed'' shows where I/O operations are being
performed in the application PCA$PRIMES.
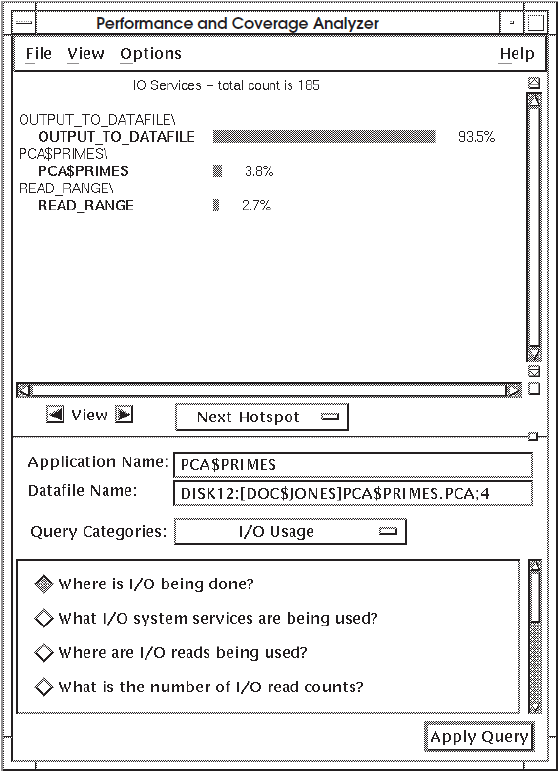
Figure 7.4, ''Histogram Showing Where I/O Operations Are Being Performed'' shows that the routine
OUTPUT_TO_DATAFILE is performing 93.5 percent of all the I/O
operations in PCA$PRIMES. If your application has a routine in which a
large percentage of I/O operations are being performed, get more information on that
routine.
If your application performs I/O operations throughout numerous locations and in several different routines, consider centralizing the location of the I/O operations. Compare elapsed time, process time, and execution count information with the I/O information for that routine. If a routine is consuming idle time in addition to using a lot of I/O services, find out what I/O services are being used.
7.3.2. Finding What I/O Operations Are Being Performed
When you choose the query "What I/O system services are being used?"
the Analyzer displays a histogram showing which I/O operations are being used most
in your application. Figure 7.5, ''Histogram Showing What I/O Operations Are Being Performed'' shows the I/O operations being
used the most in the application PCA$PRIMES.
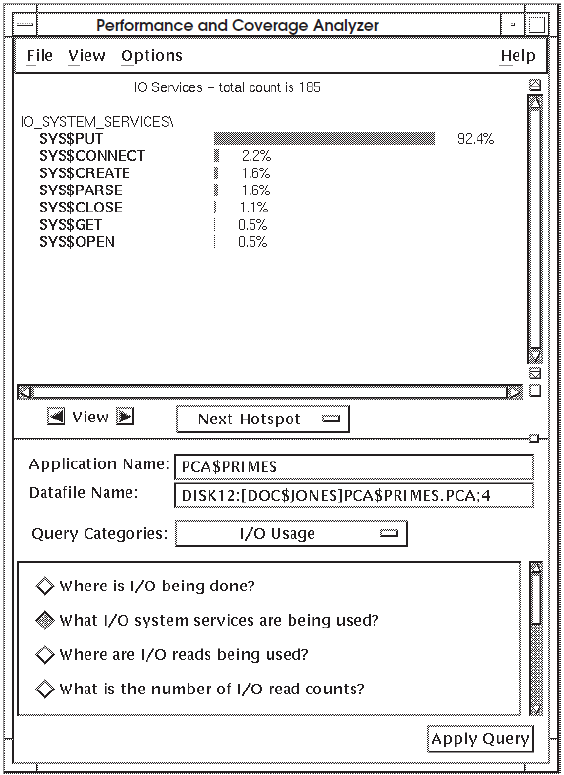
In Figure 7.5, ''Histogram Showing What I/O Operations Are Being Performed'', SYS$PUT represents 92.4percent of
all I/O services used in PCA$PRIMES. If your application has a high
usage of one I/O service, check to see how it is being used. In this example, check
to see where you are sending output to a file and see if that location is generating
a lot of idle time. If so, you might look at ways to make that algorithm more
efficient, or optimize use of the I/O output statement.
Where I/O writes are being performed
The number of I/O write counts
What files output is being sent to
Record size information
To get this information, click on the appropriate query in the Analyzer query panel.
7.4. Analyzing Page Fault Information
Invoke the Analyzer and specify the name of the data file containing the information you want to look at. (Chapter 3, "Running the Analyzer" describes this step.)
Choose the Page Faults query category.
Choose the query "Where are the page faults occurring?"
Click on Apply.
Where page faults are occurring
The address of the instruction that caused the page fault
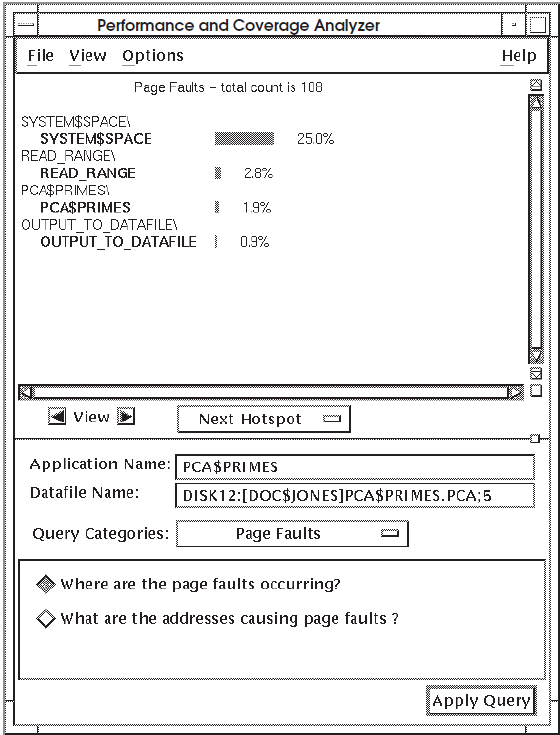
7.4.1. Finding Where Page Faults Are Occurring
When you choose the query "Where are the page faults occurring?"the Analyzer displays a histogram showing the routines that generates the most page faults. Figure 7.6, ''Histogram Showing Where Page Faults Are Occurring'' shows a sample histogram.
Figure 7.6, ''Histogram Showing Where Page Faults Are Occurring'' shows that more than 25 percent of the page faults are occurring in system space. This might indicate that the page faults are caused by system service or I/O calls. To get more information, choose the query "What are the addresses causing page faults?"
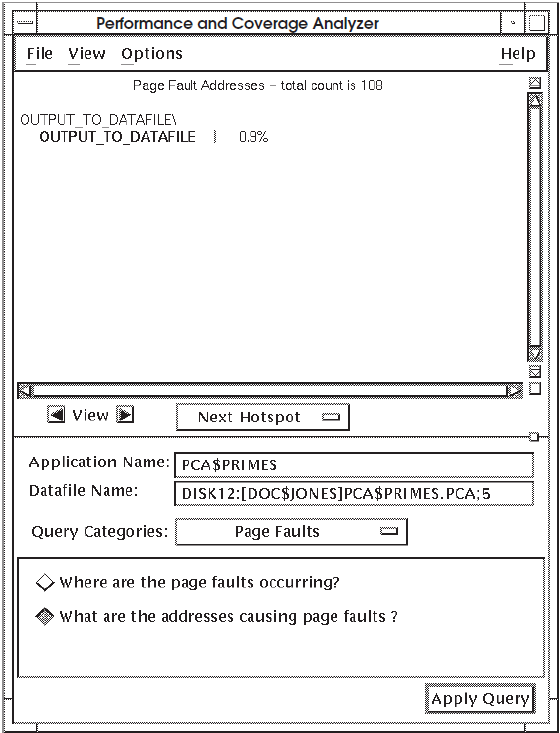
7.4.2. Finding What Instructions Are Causing Page Faults
When you query "What are the addresses causing page faults?", the Analyzer displays the addresses of the instructions that are causing the page faults.
Figure 7.7, ''Addresses of Instructions Causing Page Faults'' shows sample addresses of instructions that cause page faults.
7.5. Analyzing Ada Tasking Information
Invoke the Analyzer and specify the name of the data file containing the information you want to look at. (Chapter 3, "Running the Analyzer" describes this step.)
Choose the Ada Tasking query category.
Choose the query "What tasks are performing context switching?"
Click on Apply.
What tasks are performing context switching?
What Ada tasking names are used?
What Ada tasking types are used?
What Ada task priorities are used?
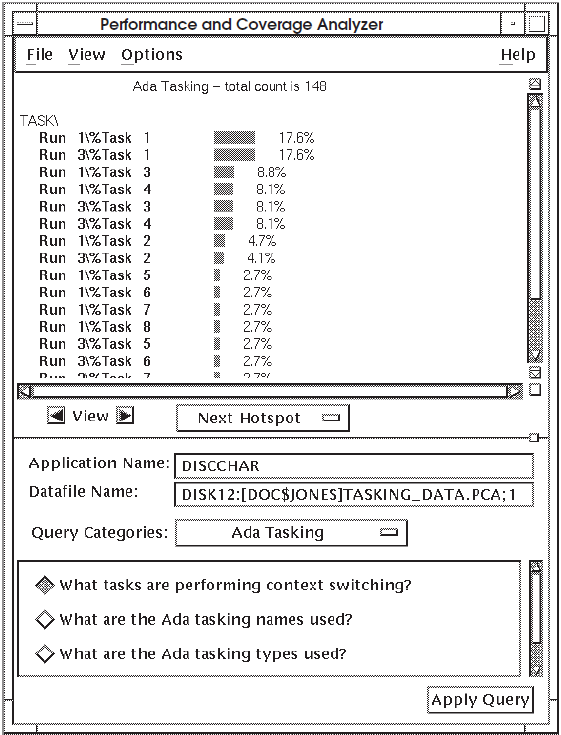
7.5.1. Finding What Tasks Are Performing Context Switching
When you choose the query "What tasks are performing context switching?",the Analyzer displays a histogram showing the percentage of each task that performs context switching.
Figure 7.8, ''Histogram Showing What Tasks Are Performing Context Switching'' shows that Run 1 and Run 3 represent context switching 17.6 percent of Task 1. Similarly, Run 3 represents the same percent of context switching of Task 3 and Task 4. To get more information, choose the query "What are the Ada tasking names used?"
7.5.2. Finding What Ada Tasking Names Are Used
When you query "What are the Ada tasking names used?", the Analyzer displays the percentage of each task name used, as shown in Figure 7.9, ''Histogram Showing What Ada Tasking Names Are Used''.

Figure 7.9, ''Histogram Showing What Ada Tasking Names Are Used'' shows that Run 1 and Run 3 represent 17.6 percent of Task 1. Similarly, Run 3 represents the same percent of Task 3 and Task 4. For more information, query "What are the Ada tasking types used?"
7.5.3. Finding What Ada Tasking Types Are Used
When you query "What are the Ada tasking types used?", the Analyzer displays the percentage of each task type used, as shown in Figure 7.10, ''Histogram Showing What Ada Tasking Types Are Used''.
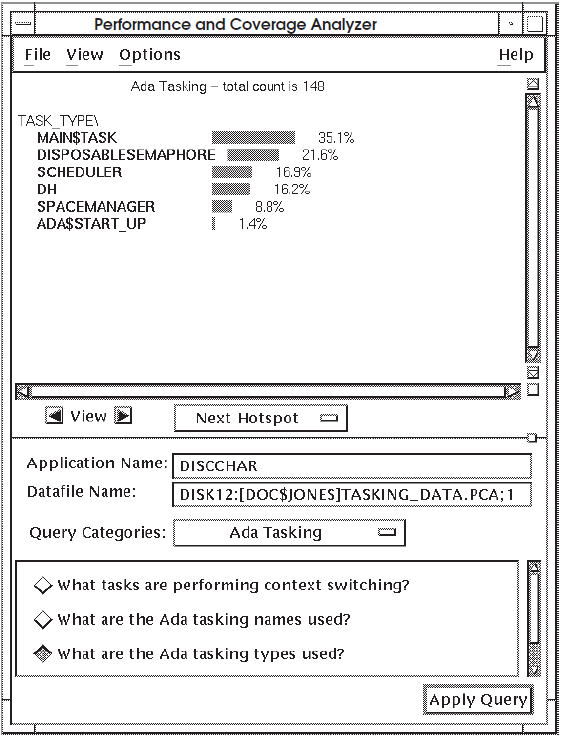
Figure 7.10, ''Histogram Showing What Ada Tasking Types Are Used'' shows that MAIN$TASK represents 35.1
percent and that ADA$START_UP represents only 1.4 percent of all Ada
tasking used in DISCCHAR. To get more information, choose the query "What are
the Ada task priorities used?"
7.5.4. Finding What Ada Task Priorities Are Used
When you query "What are the Ada task priorities used?", the Analyzer displays the percentage of task priorities used, as shown in Figure 7.11, ''Histogram Showing What Ada Task Priorities Are Used''.
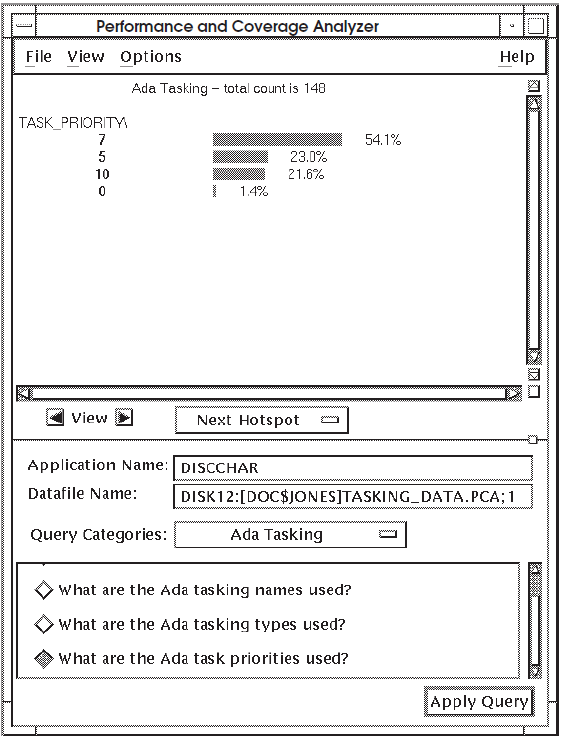
Figure 7.11, ''Histogram Showing What Ada Task Priorities Are Used'' shows that task priority 7 represents 54.1 percent, task
priority 5 represents 23.0 percent, task priority 10 represents 21.6 percent, and
task priority 0 represents only 1.4 percent of all Ada tasking used in
DISCCHAR.