VSI OpenVMS Debugger Manual
- Operating System and Version:
- VSI OpenVMS IA-64 Version 8.4-1H1 or higher
VSI OpenVMS Alpha Version 8.4-2L1 or higher
Preface
1. About VSI
VMS Software, Inc. (VSI) is an independent software company licensed by Hewlett Packard Enterprise to develop and support the OpenVMS operating system.
2. Intended Audience
This manual is for programmers at all levels of experience. It covers all user interfaces of the OpenVMS Debugger:
The command interface for terminals and workstations
The VSI DECwindows Motif for OpenVMS user interface for workstations
The Microsoft Windows PC client interface
The OpenVMS Debugger on OpenVMS Alpha systems can access all the extended memory made available by the 64-bit processing of the OpenVMS Alpha operating system. Hence, you can examine and manipulate data in the complete 64-bit address space.
The OpenVMS Debugger has been internationalized. For Asian users, the debugger's VSI DECwindows Motif for OpenVMS, command line, and screen mode user interfaces can be used with multi-byte characters.
You can use the debugger to debug code only in user mode. You cannot debug code in supervisor, executive, or kernel modes.
3. Document Structure
This manual is organized as follows:
- Part I introduces the OpenVMS Debugger. Part I contains one chapter:
Chapter 1, "Introduction to the Debugger " introduces the debugger.
- Part II describes the debugger's command interface. Part II includes the following chapters:
Chapter 2, "Getting Started with the Debugger " gets you started using the debugger.
Chapter 3, "Controlling and Monitoring Program Execution" explains how to control and monitor program execution.
Chapter 4, "Examining and Manipulating Program Data" explains how to examine and manipulate program data.
Chapter 5, "Controlling Access to Symbols in Your Program" explains how to control access to symbols in your program.
Chapter 6, "Controlling the Display of Source Code" explains how to control the display of source code.
Chapter 7, "Screen Mode" explains how to use screen mode.
- Part III describes the debugger's VSI DECwindows Motif for OpenVMS user interface. Part III includes the following chapters:
Chapter 8, "Introduction " gives an overview of its VSI DECwindows Motif for OpenVMS user interface features.
Chapter 9, "Starting and Ending a Debugging Session" explains how to prepare your program for debugging and then start and end a debugging session using the VSI DECwindows Motif for OpenVMS user interface.
Chapter 10, "Using the Debugger", which is organized by task, explains how to use the debugger via the VSI DECwindows Motif for OpenVMS user interface.
- Part IV describes the debugger's PC interface. Part IV contains one chapter:
Chapter 11, "Using the Debugger PC Client/Server Interface" gives an overview of the debugger's PC interface.
- Part V describes advanced debugging topics. Part V includes the following chapters:
Chapter 12, "Using the Heap Analyzer ", which is organized by task, explains how to use the debugger's Heap Analyzer.
Chapter 13, "Additional Convenience Features" explains additional convenience features, such as key definitions and other customizations.
Chapter 14, "Debugging Special Cases" explains some special cases, such as debugging optimized programs and multilanguage programs.
Chapter 15, "Debugging Multiprocess Programs" explains how to debug multiprocess programs.
Chapter 16, "Debugging Tasking Programs" explains how to debug tasking (multithread) programs.
- Part VI is the debugger command dictionary, followed by the appendixes:
Appendix A, " Predefined Key Functions" lists the keypad-key definitions that are predefined by the debugger.
Appendix C, "Built-In Symbols and Logical Names" identifies all of the debugger built-in symbols and logical names.
Appendix D, "Summary of Debugger Support for Languages" identifies the debugger support for languages.
Appendix E, "EIGHTQUEENS.C" contains the source code of the programs shown in the figures in Chapter 8, "Introduction ", Chapter 9, "Starting and Ending a Debugging Session", and Chapter 10, "Using the Debugger".
4. Related Documents
The following documents may also be helpful when using the debugger.
Programming Languages
This manual emphasizes debugger usage that is common to all or most supported languages. For more information specific to a particular language, see:
The debugger's online help system (see Section 2.1, ''Entering Debugger Commands and Accessing Online Help'')
The documentation supplied with that language, particularly regarding compiling and linking the program for debugging
The VAX MACRO and Instruction Set Reference Manual or the MACRO-64 Assembler for OpenVMS AXP Systems Reference Manual for information about assembly-language instructions and the MACRO assembler
Linker Utility
For information about the linking of programs or shareable images, see the VSI OpenVMS Linker Utility Manual.
Delta/XDelta Debugger
For information about debugging code in supervisor, executive, or kernel modes (that is, in other than user mode), see the VSI OpenVMS Delta/XDelta Debugger Manual in the OpenVMS documentation set. This manual contains information about debugging programs that run in privileged processor mode or at an elevated interrupt priority level.
OpenVMS Alpha System-Code Debugger
See the VSI OpenVMS System Analysis Tools Manual for information on debugging operating system code. This manual describes how to activate the OpenVMS System-Code Debugger through the OpenVMS Debugger, and debug within the OpenVMS System-Code Debugger environment.
For information on the OpenVMS System-Code Debugger-specific commands, see the CONNECT and REBOOT commands in Part VI.
DECwindows Motif for OpenVMS
For general information about the DECwindows Motif for OpenVMS user interface, see the Using VSI DECwindows Motif for OpenVMS.
5. VSI Encourages Your Comments
You may send comments or suggestions regarding this manual or any VSI document by sending electronic mail to the following Internet address: <docinfo@vmssoftware.com>. Users who have VSI OpenVMS support contracts through VSI can contact <support@vmssoftware.com> for help with this product.
6. OpenVMS Documentation
The full VSI OpenVMS documentation set can be found on the VMS Software Documentation webpage at https://docs.vmssoftware.com.
7. Typographical Conventions
The following conventions are used in this manual:
| Convention | Meaning |
|---|---|
Ctrl/X
| A sequence such as
Ctrl/x
indicates that you must hold down the key labeled Ctrl while you
press another key or a pointing device button. |
PF1
X | A sequence such as PF1
X indicates that you
must first press and release the key labeled PF1 and then press and
release another key (x)
or a pointing device button. |
| Enter | In examples, a key name in bold indicates that you press that key. |
... | A horizontal ellipsis in examples indicates one of the following possibilities:− Additional optional arguments in a statement have been omitted.− The preceding item or items can be repeated one or more times.− Additional parameters, values, or other information can be entered. |
. . . | A vertical ellipsis indicates the omission of items from a code example or command format; the items are omitted because they are not important to the topic being discussed. |
| ( ) | In command format descriptions, parentheses indicate that you must enclose choices in parentheses if you specify more than one. In installation or upgrade examples, parentheses indicate the possible answers to a prompt, such as: |
Is this correct? (Y/N)
[Y] | |
| [ ] | In command format descriptions, brackets indicate optional choices. You can choose one or more items or no items. Do not type the brackets on the command line. However, you must include the brackets in the syntax for directory specifications and for a substring specification in an assignment statement. In installation or upgrade examples, brackets indicate the default answer to a prompt if you press Enter without entering a value, as in: |
Is this correct? (Y/N) [Y] | |
| | | In command format descriptions, vertical bars separate choices within brackets or braces. Within brackets, the choices are optional; within braces, at least one choice is required. Do not type the vertical bars on the command line. |
| { } | In command format descriptions, braces indicate required choices; you must choose at least one of the items listed. Do not type the braces on the command line. |
| bold type | Bold type represents the name of an argument, an attribute, or a reason. In command and script examples, bold indicates user input. Bold type also represents the introduction of a new term. |
| italic type | Italic type indicates important information, complete titles of manuals, or variables. Variables include information that varies in system output (Internal error number), in command lines (/PRODUCER=name), and in command parameters in text (where dd represents the predefined code for the device type). |
| UPPERCASE TYPE | Uppercase type indicates a command, the name of a routine, the name of a file, or the abbreviation for a system privilege. |
Example |
This typeface indicates code examples, command examples, and interactive screen displays. In text, this type also identifies website addresses, UNIX command and pathnames, PC-based commands and folders, and certain elements of the C programming language. |
| – | A hyphen at the end of a command format description, command line, or code line indicates that the command or statement continues on the following line. |
| numbers | All numbers in text are assumed to be decimal unless otherwise noted. Nondecimal radixes—binary, octal, or hexadecimal—are explicitly indicated. |
Part I. Introduction to the Debugger
Chapter 1. Introduction to the Debugger
An overview of debugger features
Instructions to compile and link your program for debugging
Instructions to start and end a debugging session
A list of the debugger commands grouped by function
For a tutorial introduction to basic debugging tasks, see Chapter 2, "Getting Started with the Debugger ".
1.1. Overview of the Debugger
The OpenVMS Debugger is a tool to locate run-time programming or logic errors, also known as bugs, in a program that has been compiled and linked successfully but does not run correctly. For example, the program might give incorrect output, go into an infinite loop,or terminate prematurely.
Control and observe execution of the program
Display and browse through the source code of the program to identify instructions and variables worth scrutiny
Suspend program execution at specified points in order to monitor changes in variables and other program entities
Change the value of a variable and, in some cases, test the modification without having to edit the source code, recompile, and relink
Trace the execution path of the program
Monitor exception conditions and language-specific events
These are basic debugging techniques. After locating program errors,you can edit the source code and compile, link, execute, and test the corrected version.
As you use the debugger and its documentation, you will discover and develop variations on the basic techniques. You can also customize the debugger for your own needs. Section 1.1.1, ''Functional Features''summarizes the features of the OpenVMS Debugger.
1.1.1. Functional Features
Programming Language Support
Ada | BASIC | BLISS | C |
C++ | COBOL | Fortran | MACRO-32 Note that MACRO-32 must be compiled with the AMACRO compiler. |
MACRO-64 | Pascal | PL/I |
|
Assembler (IAS ) | BASIC | BLISS | C |
C++ | COBOL | Fortran | MACRO-32. Note that MACRO-32 must be compiled with the AMACRO compiler. |
IMACRO | PASCAL |
The debugger recognizes the syntax, data types, operators, expressions,scoping rules, and other constructs of a supported language. You can change the debugging context from one language to another (with the SET LANGUAGE command) during a debugging session.
Symbolic Debugging
The debugger is a symbolic debugger. You can refer to program locations by the symbols used in your program — the names of variables, routines, labels, and so on. You can also specify explicit memory addresses or machine registers if you choose.
Support for All Data Types
The debugger recognizes the data types generated by the compilers of all supported languages, such as integer, floating-point, enumeration, record,array, and so on, and displays the values of each program variable according to its declared type.
Flexible Data Format
With the debugger, you can enter and display a variety of data forms and data types. The source language of the program determines the default format for the entry and display of data. However, you can select other formats as needed.
Starting or Resuming Program Execution
Once the program is under control of the debugger, you can start or resume program execution with the GO or STEP command. The GO command causes the program to execute until specified events occur (the PC points to a designated line of code, a variable is modified, an exception is signaled, or the program terminates). You can use the STEP command to execute a specified number instructions or lines of source code, or until the program reaches the next instruction of a specified class.
Breakpoints
You can set a breakpoint with the SET BREAK command, to suspend program execution at a specified location in order to check the current status of the program. You can also direct the debugger to suspend execution when the program is about to execute an instruction of a specific class. You can also suspend execution when certain events occur, such as exceptions and tasking (multithread) events.
Tracepoints
You can set a tracepoint with the SET TRACE command, to cause the debugger to report each time that program execution reaches a specified location (that is, each time the program counter (PC) references that location). As with the SET BREAK command, you can also trace the occurrence of classes of instructions and monitor the occurrence of certain events, such as exceptions and tasking (multithread) events.
Watchpoints
You can set a watchpoint with the SET WATCH command to cause the debugger to suspend program execution whenever a particular variable (or other specified memory location) has been modified, at which point the debugger reports the old and new values of the variable.
Manipulation of Variables and Program Locations
You can use the EXAMINE command to determine the value of a variable or memory location. You can use the DEPOSIT command to change that value. You can then continue execution of the program to determine the effect of the change without having to recompile, relink, and rerun the program.
Evaluation of Expressions
You can use the EVALUATE command to compute the value of a source-language expression or an address expression in the syntax of the language to which the debugger is currently set.
Control Structures
You can use logical control structures (FOR, IF, REPEAT, WHILE) in commands to control the execution of other commands.
Shareable Image Debugging
You can debug shareable images (images that are not directly executable). The SET IMAGE command enables you to access the symbols declared in as shareable image (that was compiled and linked with the /DEBUG qualifiers).
Multiprocess Debugging
You can debug multiprocess programs (programs that run in more than one process). The SHOW PROCESS and SET PROCESS commands enable you to display process information and to control the execution of images in individual processes.
Task Debugging
You can debug tasking programs (also known as multithread programs). These programs use POSIX Threads Library or POSIX 1003.1b services, or use language-specific tasking services (for example, Ada tasking programs). The SHOW TASK and SET TASK commands enable you to display task information and to control the execution of individual tasks.
Terminal and Workstation Support
The debugger supports all VT-series terminals and VAX workstations.
1.1.2. Convenience Features
Online Help
Online help is always available during a debugging session. Online help contains information about all debugger commands and additional selected topics.
Source Code Display
During a debugging session, you can display the source code for program modules written in any of the languages supported by the OpenVMS Debugger.
Screen Mode
In screen mode, you can capture and display various kinds of information in scrollable display units. You can move these display units around the screen and resize them as needed. Automatically updated source, instruction, and register displays units are available. You can selectively direct debugger input, output, and diagnostic messages to specific display units. You can also create display units to capture the output of specific command sequences.
Kept Debugger
The kept debugger enables you to run different program images or rerun the same image from the current debugging session without having to first exit and restart the debugger. When you rerun a program, you can choose to retain or cancel any previously set breakpoints, as well as most trace points and watch points.
DECwindows Motif User Interface
The OpenVMS Debugger has an optional HP DECwindows Motif graphical user interface (GUI) that provides access to common debugger commands by means of push buttons, pull down menus, and pop up menus. The GUI is an optional enhancement to the debugger command line interface that is available on workstations running DECwindows Motif. When using the GUI, you have full command-line access to all debugger commands that are relevant within a DECwindows Motif environment.
Microsoft Windows Interface
The OpenVMS Debugger has an optional client/server configuration that allows you to access the debugger and its functions from a PC running on your supplied Microsoft operating system. This debugger implementation has a debug server that runs on OpenVMS on an Alpha or Integrity server CPU, and a debug client interface that runs on Microsoft operating systems on an Intel or Alpha CPU.
Client/Server Configuration
The client/server configuration allows you to debug programs that run on an OpenVMS node remotely from another OpenVMS node using the DECwindows Motif user interface, or from a PC using the Microsoft Windows interface. Up to 31 debug clients can simultaneously access the same debug server,which allows many debugging options.
Keypad Mode
When you start the debugger, several predefined debugger command sequences are assigned to the keys of the numeric keypad of the VT52, VT100, and LK201 keyboards. You can also create your own key definitions.
Source Editing
As you find errors during a debugging session, you can use the EDIT command to use any editor available on your system. You can specify the editor with the SET EDITOR command. If you use the Language-Sensitive Editor (LSE), the editing cursor is automatically positioned within the source file corresponding to the source code that appears in the screen-mode source display.
Command Procedures
You can direct the debugger to execute a command procedure (a file of debugger commands) to re-create a debugging session, to continue a previous session, or to avoid typing the same debugger commands many times during a debugging session. In addition, you can pass parameters to command procedures.
Initialization Files
You can create an initialization file that contains debugger commands to set default debugging modes, screen display definitions, keypad key definitions, symbol definitions, and so on. Upon start up, the OpenVMS Debugger automatically executes the initialization file to create the predefined debugging environment.
Log Files
You can create a log file to contain a record of command input and debugger output. You can then use the log file to analyze the debugging session, or edit the file for use as a command procedure in subsequent debugging sessions.
Symbol Definitions
You can define your own symbols to represent lengthy commands, address expressions, or values in abbreviated form.
1.2. Preparing an Executable Image for Debugging
To take full advantage of symbolic debugging, you must first compile and link the program's modules (compilation units) using the compiler and linker /DEBUG qualifiers as explained in Section 1.2.1, ''Compiling a Program for Debugging'' and Section 1.2.2, ''Linking a Program for Debugging''.
1.2.1. Compiling a Program for Debugging
FORMS.EXE, that consists of two source modules:
FORMS.C and INVENTORY.C.
FORMS.C is the main program module. $ CC/DEBUG/NOOPTIMIZE INVENTORY,FORMS
Note that the /DEBUG and /NOOPTIMIZE qualifiers are compiler command defaults for some languages. These qualifiers are used in the example for emphasis. (For information about compiling programs in a specific language, see the documentation for that language.)
The /DEBUG qualifier in the compiler command in Example 1.1, ''Compiling a Program with the /DEBUG Qualifier'' directs the compiler to include the symbol
information associated with FORMS.C and
INVENTORY.C in object modules
FORMS.OBJ and INVENTORY.OBJ,
respectively. This enables you to refer to the symbolic names of variables,
routines,and other declared symbols while debugging the program. Only object files
created with the /DEBUG qualifier contain symbol information. You
can control whether to include all symbol information or only that required to trace
program flow (see Section 5.1.1, ''Compiling'').
Some compilers optimize the object code to reduce the size of the program or to make it run faster. In such cases the object code does not always match the source code, which can make debugging more difficult. To avoid this, compile the program with the /NOOPTIMIZE command qualifier (or equivalent). After the non-optimized program has been debugged, you can recompile and test it again without the /NOOPTIMIZE qualifier to take advantage of optimization. Section 14.1, ''Debugging Optimized Code'' describes some of the effects of optimization.
1.2.2. Linking a Program for Debugging
FORMS.EXE that consists of two source modules:
FORMS.C and INVENTORY.C.
FORMS.C is the main program module. Both source modules
were compiled with the /DEBUG qualifier (see Example 1.1, ''Compiling a Program with the /DEBUG Qualifier'').
$ LINK/DEBUG FORMS,INVENTORY
In Example 1.2, the /DEBUG qualifier in the LINK command directs the linker to include in the executable image all symbol information that is contained in the object modules being linked. Most languages require that you specify all included object modules in the LINK command. See Section 5.1.3, ''Linking'' for more details on how to control symbol information with the LINK command.
The name of the
.DSFfile must match the name of the.EXEfile being debugged.You must define DBG$IMAGE_DSF_PATH to point to the directory that contains the
.DSFfile.
$ CC/DEBUG/NOOPTIMIZE TESTPROGRAM
$ LINK/DSF=TESTDISK:[TESTDIR]TESTPROGRAM.DSF TESTPROGRAM
$ DEFINE DBG$IMAGE_DSF_PATH TESTDISK:[TESTDIR]
$ DEBUG/KEEP TESTPROGRAM
See Section 5.1.5, ''Creating Separate Symbol Files (Alpha Only)'' for more information about debugging programs that have separate symbol files. See the VSI OpenVMS Linker Utility Manual for more information about using the /DSF qualifier.
1.2.3. Controlling Debugger Activation with the LINK and RUN Commands
In addition to passing symbol information to the executable image, the LINK /DEBUG command causes the image activator to start the debugger if you execute the resulting image with the DCL command RUN. (See Section 1.6, ''Starting the Debugger by Running a Program''.)
$ RUN/NODEBUG FORMS
This is convenient for checking your program once you think it is error free. Note that the data required by the debugger occupies space within the executable image. When your program is correct, you can link your program again without the /DEBUG qualifier. This creates an image with only trace back data in the debug symbol table, which creates a smaller executable file.
| LINK Command Qualifier | To Run Program without Debugger | To Run Program with Debugger |
Maximum Symbol Information Available? |
|---|---|---|---|
|
/DEBUG? |
RUN /NODEBUG |
RUN |
Full |
|
None or /TRACEBACK or /NODEBUG? |
RUN |
RUN /DEBUG |
Only traceback? |
|
/NOTRACEBACK |
RUN |
RUN /DEBUG? |
None |
|
/DSF? |
RUN |
DEBUG /KEEP? |
Full |
|
/DSF? |
RUN |
DEBUG /SERVER? |
Full |
1.3. Debugging a Program with the Kept Debugger
Start the kept debugger and then bring a program under debugger control
Rerun the same program from the current debugging session
Run another program from the current debugging session
Interrupt program execution and abort debugger commands
Interrupt a debugging session and then return to the debugging session
1.3.1. Starting the Kept Debugger
This section explains how to start the kept debugger from DCL level ($) and bring your program under debugger control. Section 1.6, ''Starting the Debugger by Running a Program'' and Section 1.7, ''Starting the Debugger After Interrupting a Running Program'' describe other ways to invoke the debugger.
Note
- If a previous debugger process has not completely stopped, you may see the following error at debugger startup:
%DEBUG-E-INTERR, internal debugger error in
    DBGMRPC\DBG$WAIT_FOR_EVENT got an ACK
To fix this problem, exit the debugger. Then use the DCL command SHOW PROCESS /SUBPROCESS to check whether any debugger subprocesses exist. If so, stop them by using the DCL command STOP and then restart the debugger.
Running a sequence of many large programs can cause the debugger to fail because it has run out of memory, global sections, or some other resource.
To fix this problem, exit the debugger and restart the debugging session.
Verify that you have compiled and linked the program as explained in Section 1.2, ''Preparing an Executable Image for Debugging''.
- Enter the following command line:
$ DEBUG/KEEP
Upon startup, the debugger displays its banner, executes any user-defined initialization file (see Section 13.2, ''Using a Debugger Initialization File''), and displays its
DBG>prompt to indicate that you can now enter debugger commands, as explained in Section 2.1, ''Entering Debugger Commands and Accessing Online Help''. - Bring your program under debugger control with the debugger RUN command, specifying the executable image of your program as the parameter. For example:
DBG> RUN FORMS
%DEBUG-I-INITIAL,Language: C, Module: FORMS
DBG>
The message displayed indicates that this debugging session is initialized fora C program and that the name of the main program unit (the module containing the image transfer address) is FORMS. The initialization sets up language-dependent debugger parameters. These parameters control the way the debugger parses names and expressions, formats debugger output, and so on. See Section 4.1.9, ''Language Dependencies and the Current Language'' for more information about language-dependent parameters.
%DEBUG-I-NOTATMAIN, Type GO to reach main program
With some of these programs (for example, Ada programs), the temporary breakpoint enables you to debug the initialization code using full symbolic information. See Section 14.3, ''Debugging Multilanguage Programs'' for more information.
At this point, you can debug your program as explained in Chapter 2, "Getting Started with the Debugger ".
RUN and RERUN Command Options for Programs That Require Arguments
Some programs require arguments. This section explains how to use the RUN and RERUN commands with the /ARGUMENTS and /COMMAND qualifiers when debugging a program with the kept debugger.
After starting the kept debugger, you can specify the image to be debugged by entering the RUN command with an image name, or the RUN /COMMAND command with a DCL foreign command. Note that you can specify a DCL foreign command only with the /COMMAND qualifier to the RUN command.
You can specify a list of arguments with the /ARGUMENTS qualifier to the RUN and RERUN commands.
echoargs.c,a program that echoes
the input arguments to the terminal:
#include <stdio.h>

main(int argc, char *argv[])
{
  int i;

  for (i = 0; i < argc; i++)
    printf("%s\n", argv[i]);
}$ cc/debug/noopt echoargs.c $ link/debug echoargs
RUN with /COMMAND and /ARGUMENTS
RERUN with /ARGUMENTS
RUN with /ARGUMENTS and image name
RUN with /COMMAND and /ARGUMENTS
echo.The /ARGUMENTS qualifier specifies arguments fa
sol la mi. The first GO command executes the initialization code of
echoargs.exe after which the debugger suspends program
execution at the temporary breakpoint at the start of the program. The second GO
command executes echoargs.exe, which correctly echoes the
arguments to the
screen.$ DEBUG/KEEP
Debugger Banner and Version Number
DBG> RUN/COMMAND="echo"/ARGUMENTS="fa sol la mi"
%DEBUG-I-NOTATMAIN,Language: C, Module: ECHOARGS
%DEBUG-I-NOTATMAIN,Type GO to reach main program
DBG> GO
break at routine ECHOARGS\main
1602: for (i = 0; i < argc; i++)
DBG> GO
_dsa1:[jones.test]echoargs.exe;2
fa
                    sol la mi
%DEBUG-I-EXITSTATUS,is '%SYSTEM-S-NORMAL, Normal successful completion'This section of the debugger session shows the use of the RERUN command with the
/ARGUMENTS qualifier to run the same image again, with new arguments fee
fii foo fum. (If you omit the /ARGUMENTS qualifier, the
debugger reruns the program with the arguments used previously.)
echoargs.exe after which the debugger suspends program
execution at the temporary breakpoint at the start of the program. The second GO
command executes echoargs.exe, which correctly echoes the
arguments to the
screen.DBG> RERUN/ARGUMENTS="fee fii foo fum" %DEBUG-I-NOTATMAIN,Language: C, Module: ECHOARGS %DEBUG-I-NOTATMAIN,Type GO to reach main program DBG> GO break at routine ECHOARGS\main 1602: for (i = 0; i < argc; i++) DBG> GO _dsa1:[jones.test]echoargs.exe;2 fee fii foo fum %DEBUG-I-EXITSTATUS,is '%SYSTEM-S-NORMAL, Normal successful completion'
This section of the debugging session uses the RUN command to invoke a fresh image
of echoargs, with the /ARGUMENTS qualifier to specify a new set
of arguments a b c.
echoargs.exe after which the debugger suspends program
execution at the temporary breakpoint at the start of the program. The second GO
command executes echoargs.exe,which correctly echoes the
arguments to the
screen.DBG> RUN/ARGUMENTS="a b c" echoargs %DEBUG-I-NOTATMAIN,Language: C, Module: ECHOARGS %DEBUG-I-NOTATMAIN,Type GO to reach main program DBG> GO break at routine ECHOARGS\main 1602: for (i = 0; i < argc; i++) DBG> GO _dsa1:[jones.test]echoargs.exe;2 a b c %DEBUG-I-EXITSTATUS,is '%SYSTEM-S-NORMAL, Normal successful completion' DBG> quit
RUN Command Restrictions
You can use the RUN command only if you started the debugger with the DCL command DEBUG /KEEP.
You cannot use the RUN command to connect the debugger to a running program (see Section 1.7, ''Starting the Debugger After Interrupting a Running Program'').
Unless you are using the debugger client/server interface, you cannot run a program under debugger control over a network link. See Section 9.9, ''Starting the Motif Debug Client'' and Chapter 11, "Using the Debugger PC Client/Server Interface" for more information about using the debugger client/server interface.
1.3.2. When Your Program Completes Execution
%DEBUG-I-EXITSTATUS,is '%SYSTEM-S-NORMAL, Normal successful completion')
You can rerun your program from the same debugging session (see Section 1.3.3, ''Rerunning the Same Program from the Kept Debugger'').
You can run another program from the same debugging session (see Section 1.3.4, ''Running Another Program from the Kept Debugger'').
You can end the debugging session (see Section 1.8, ''Ending a Debugging Session'').
1.3.3. Rerunning the Same Program from the Kept Debugger
DBG> RERUN
%DEBUG-I-NOTATMAIN, Language: C, Module: ECHOARGS
%DEBUG-I-NOTATMAIN, Type GO to reach main program

DBG>
The RERUN command terminates the image you were debugging and brings a fresh copy of that image under debugger control, pausing at the start of the main source module as if you had used the RUN command (see Section 1.3.1, ''Starting the Kept Debugger'').
When you use the RERUN command you can save the current state (activated or deactivated) of any breakpoints, trace points, and static watch points. Note that the state of a particular nonstatic watchpoint might not be saved, depending on the scope of the variable being watched relative to the main program unit (where execution restarts). RERUN /SAVE is the default. To clear all breakpoints tracepoints, and watchpoints, enter RERUN /NOSAVE.
The RERUN command invokes the same version of the image that is currently under debugger control. To debug a different version of that program (or a different program) from the same debugging session, use the RUN command. To rerun a program with new arguments, use the /ARGUMENTS qualifier (see the section called “RUN and RERUN Command Options for Programs That Require Arguments”).
1.3.4. Running Another Program from the Kept Debugger
DBG> RUN TOTALS
%DEBUG-I-NOTATMAIN, Language: FORTRAN, Module: TOTALS
DBG>
The debugger loads the program and pauses execution at the start of the main source module.
For more information about startup conditions and restrictions, see Section 1.3.1, ''Starting the Kept Debugger''.
For information about all RUN command options, see the debugger RUN command description.
1.4. Interrupting Program Execution and Aborting Debugger Commands
DBG> GO
   .
   .
   .
Ctrl/C
DBG>
You can also press Ctrl/C to abort the execution of a debugger command. This is useful if, for example, the debugger is displaying along stream of data.
Pressing Ctrl/C when the program is not running or when the debugger is not performing an operation has no effect.
If your program has a Ctrl/C AST (asynchronous system trap) service routine enabled, use the SET ABORT_KEY command to assign the debugger's abort function to another Ctrl/key sequence. To identify the abort key that is currently defined, enter the SHOW ABORT_KEY command.
Pressing Ctrl/Y from within a debugging session has the same effect as pressing Ctrl/Y during the execution of a program. Control is returned to the DCL command interpreter ($ prompt).
1.5. Pausing and Resuming a Debugging Session
Use the debugger SPAWN command to create a subprocess.
Use the debugger ATTACH command to attach to an existing process or subprocess.
DBG> SPAWN DIR [JONES.PROJECT2]*.FOR
   .
   .
   .
Control returned to process JONES_1
DBG>
DBG> SPAWN MAIL
MAIL> READ/NEW
   .
   .
   .
MAIL> EXIT
Control returned to process JONES_1
DBG>
DBG> SPAWN
$ RUN PROG2
   .
   .
   .
$ ATTACH JONES_1
Control returned to process JONES_1
DBG>
If you plan to go back and forth several times between your debugging session and a spawned subprocess (which might be another debugging session), use the debugger ATTACH command to attach to that subprocess. Use the DCL command ATTACH to return to the parent process. Because you do not create a new subprocess every time you leave the debugger, you use system resources more efficiently.
If you are running two debugging sessions simultaneously, you can define anew debugger prompt for one of the sessions with the SET PROMPT command. This helps you differentiate the sessions.
1.6. Starting the Debugger by Running a Program
You can bring your program under control of the non-kept debugger in one step by entering the
DCL command RUN filespec.
Note that when running the non-kept debugger, you cannot use the debugger RERUN or RUN features explained in Section 1.3.3, ''Rerunning the Same Program from the Kept Debugger'' and Section 1.3.4, ''Running Another Program from the Kept Debugger'', respectively. To rerun the same program or run another program under debugger control, you must first exit the debugger and start it again.
$ RUN FORMS
           Debugger Banner and Version Number
%DEBUG-I-NOTATMAIN, Language: C, Module: FORMS
DBG>
Upon startup, the debugger displays its banner, executes any user-defined initialization file, sets the language-dependent parameters to the source language of the main program, suspends execution at the start of the main program,and prompts for commands.
For more information about startup conditions, see Section 1.2.3, ''Controlling Debugger Activation with the LINK and RUN Commands'' and Section 1.3.1, ''Starting the Kept Debugger''.
1.7. Starting the Debugger After Interrupting a Running Program
You can bring a program that is executing freely under debugger control. This is useful either if you suspect that the program might be in an infinite loop or if you see erroneous output.
Verify that you have compiled and linked the program as explained in Section 1.2, ''Preparing an Executable Image for Debugging''.
Enter the DCL command RUN/NODEBUG
filespecto execute the program without invoking the debugger.Press Ctrl/Y to interrupt the executing program. Control passes to the DCL command interpreter.
Enter the DCL command DEBUG. This invokes the non-kept debugger.
$ RUN/NODEBUG FORMS
   .
   .
   .
Ctrl/Y
Interrupt
$ DEBUG
           Debugger Banner and Version Number
%DEBUG-I-NOTATMAIN, Language: C, Module: FORMS
DBG>
Upon startup, the debugger displays its banner, executes any user-defined initialization file, sets the language-dependent parameters to the source language of the module where execution is interrupted, and prompts for commands.
To know where the execution is interrupted, enter the SHOW CALLS command to determine where execution is paused and to display the sequence of routine calls on the call stack (the SHOW CALLS command is described in Section 2.3.3, ''Determining Where Execution Is Paused'').
Note that when running the non-kept debugger, you cannot use the debugger RERUN or RUN features explained in Section 1.3.3, ''Rerunning the Same Program from the Kept Debugger'' and Section 1.3.4, ''Running Another Program from the Kept Debugger'', respectively. To rerun the same program or run another program under debugger control, you must first exit the debugger and start it again.
For more information about startup conditions, see Section 1.2.3, ''Controlling Debugger Activation with the LINK and RUN Commands'' and Section 1.3.1, ''Starting the Kept Debugger''.
1.8. Ending a Debugging Session
DBG> EXIT
$
The QUIT command starts the debugger exit handlers to close log files, restores the screen and keypad states, and so on.
The EXIT command and Ctrl/Z function identically. They perform the same functions as the QUIT command,and additionally execute any exit handlers that are declared in your program.
1.9. Debugging a Program on a Workstation Running DECwindows Motif
If you are at a workstation running HP DECwindows Motif, by default the debugger starts up in the HP DECwindows Motif user interface, which is displayed on the workstation specified by the HP DECwindows Motif application wide logical name DECW$DISPLAY.
The logical name DBG$DECW$DISPLAY enables you to override the default to display the debugger's command interface in a DECterm window, along with any program input/output (I/O).
- Enter the following definition in the DECterm window from which you plan to start the debugger:
$ DEFINE/JOB DBG$DECW$DISPLAY " "You can specify one or more space characters between the quotation marks. You should use a job definition for the logical name. If you use a process definition, it must not have the CONFINE attribute.
Start the debugger in the usual way from that DECterm window (see Section 1.3.1, ''Starting the Kept Debugger'').The debugger's command interface is displayed in the same window.
$ DEFINE/JOB DBG$DECW$DISPLAY " "
$ DEBUG/KEEP
           Debugger Banner and Version Number
DBG>
You can now bring your program under debugger control as explained in Section 1.3.1, ''Starting the Kept Debugger''.For more information about the logical names DBG$DECW$DISPLAY and DECW$DISPLAY, see Section 9.8.3, ''Overriding the Debugger's Default Interface''.
On a workstation running HP DECwindows Motif, you can also run the client/server configuration of the OpenVMS debugger. See Section 9.9, ''Starting the Motif Debug Client'' for details.
1.10. Debugging a Program from a PC Running the Debug Client
Microsoft Windows (Intel)
Microsoft Windows NT Version 3.51 or greater (Intel or Alpha)
Note
The client/server interface for OpenVMS Integrity server systems is planned for a future release.
Remote access to OpenVMS Debug servers from other OpenVMS systems or from PCs running Windows 95 or Windows NT Version 3.51 or later
Client access to multiple servers, each running on the same or different OpenVMS nodes
Multiple clients on different nodes to simultaneously connect to the same server for teaching or team debugging
Debugging of multitier client/server applications that are distributed among several mixed-platform systems
TCP/IP
UDP
DECnet
$ DEBUG/SERVER
The server displays its network binding strings. You must specify one of these strings when you connect a HP DECwindows Motif or Microsoft Windows client to this server. For example:
$ DEBUG/SERVER
%DEBUG-I-SPEAK: TCP/IP: YES, DECnet: YES, UDP: YES
%DEBUG-I-WATCH: Network Binding: ncacn_ip_tcp:16.32.16.138[1034]
%DEBUG-I-WATCH: Network Binding: ncacn_dnet_nsp:19.10[RPC224002690001]
%DEBUG-I-WATCH: Network Binding: ncadg_ip_udp:16.32.16.138[1045]
%DEBUG-I-AWAIT: Ready for client connection...
Note
Messages and program output appear by default in the window in which you start the server. You can redirect program output to another window as required.
For more information about using the debug client interface, see Chapter 11, "Using the Debugger PC Client/Server Interface".
1.11. Debugging Detached Processes That Run with No CLI
The design and implementation of the debugger's HP DECwindows Motif user interface requires that the process being debugged have a command line interpreter (CLI). To debug a detached process (such as a print symbiont) that does not have a CLI, you must use the character-cell (screen mode) interface to the debugger.
To do so, direct DBG$INPUT, DBG$OUTPUT and DBG$ERROR to a terminal port that is not logged in. This allows the image to be debugged with the standard character-cell interface on that terminal.
$ DEFINE/TABLE=GROUP DBG$INPUT  TTA3:
$ DEFINE/TABLE=GROUP DBG$OUTPUT TTA3:
$ DEFINE/TABLE=GROUP DBG$ERROR  TTA3:
$ START/QUEUE SYS$PRINT /PROCESSOR=dev:[dir]test_program
[Debugger starts up on logged-out terminal TTA3:]
1.12. Configuring Process Quotas for the Debugger
Each user needs a PRCLM quota sufficient to create an additional subprocess for the debugger, beyond the number of processes needed by the program.
You should increase each user's ENQLM quota by at least the number of processes being debugged.
You might need to increase each user's PGFLQUOTA. If a user has an insufficient PGFLQUOTA, the debugger may fail to activate or may cause "virtual memory exceeded" errors during execution.
You might need to increase each user's BYTLM and FILLM quotas. The debugger requires sufficient BYTLM and FILLM quotas to open each image file being debugged, the corresponding source files, and the debugger input, output, and log files. To increase these quotas, you can run SYS$SYSTEM:AUTHORIZE.EXE to adjust parameters in
SYSUAF.DAT.
1.13. Debugger Command Summary
The following sections list all the debugger commands and any related DCL commands in functional groupings, along with brief descriptions. During a debugging session, you can get online help on all debugger commands and their qualifiers by typing HELP at the debugger prompt (see Section 2.1, ''Entering Debugger Commands and Accessing Online Help'').
1.13.1. Starting and Ending a Debugging Session
$ DEBUG/KEEP |
(DCL) Starts the kept debugger. |
$ RUN SYS$SHARE:DEBUGSHR.EXE
|
(DCL) Starts the kept debugger. |
$ DEBUG/SERVER |
(DCL) Starts the debug server. |
$ DEBUG/CLIENT |
(DCL) Starts the debug client. |
$ RUN SYS$SHARE:DEBUGUISHR.EXE
|
(DCL) Starts the debug client. |
RUN
|
Brings a program under debugger control. |
RERUN |
Reruns the program currently under debugger control. |
$ RUN
|
(DCL) If the specified image was linked using LINK /DEBUG, starts the debugger and also brings the image under debugger control. When you start the debugger in this manner, you cannot then use the debugger RUN or RERUN commands. You can use the /[NO]DEBUG qualifiers with the RUN command to control whether the debugger is started when the program is executed. |
|
Ends a debugging session, executing all exit handlers. |
QUIT |
Ends a debugging session without executing any exit handlers declared in the program. |
|
Ctrl/C |
Aborts program execution or a debugger command without interrupting the debugging session. |
(SET, SHOW) ABORT_KEY |
(Assigns, identifies) the default Ctrl/C abort function to another Ctrl/key sequence, identifies the Ctrl/key sequence currently defined for the abort function. |
|
Ctrl/Y $ DEBUG |
(DCL) Interrupts a program that is running without debugger control and starts the debugger. |
ATTACH |
Passes control of your terminal from the current process to another process. |
SPAWN |
Creates a subprocess, which enables you to execute DCL commands without ending a debugging session or losing your debugging context. |
1.13.2. Controlling and Monitoring Program Execution
GO |
Starts or resumes program execution |
STEP |
Executes the program up to the next line, instruction, or specified instruction |
(SET,SHOW) STEP |
(Establishes, displays) the default qualifiers for the STEP command |
(SET,SHOW,CANCEL) BREAK |
(Sets, displays, cancels) breakpoints |
(ACTIVATE,DEACTIVATE) BREAK |
(Activates, deactivates) previously set breakpoints |
(SET,SHOW,CANCEL) TRACE |
(Sets, displays, cancels) tracepoints |
(ACTIVATE,DEACTIVATE) TRACE |
(Activates, deactivates) previously set tracepoints |
(SET,SHOW,CANCEL) WATCH |
(Sets, displays, cancels) watchpoints |
(ACTIVATE,DEACTIVATE) WATCH |
(Activates, deactivates) previously set watchpoints |
SHOW CALLS |
Identifies the currently active routine calls |
SHOW STACK |
Gives additional information about the currently active routine calls |
CALL |
Calls a routine |
1.13.3. Examining and Manipulating Data
EXAMINE |
Displays the value of a variable or the contents of a program location |
SET MODE [NO]OPERANDS |
Controls whether the address and contents of the instruction operands are displayed when you examine an instruction |
DEPOSIT |
Changes the value of a variable or the contents of a program location |
DUMP |
Displays the contents of memory in a manner similar to the DCL command DUMP |
EVALUATE |
Evaluates a language or address expression |
MONITOR |
(Applies only to the debugger's HP DECwindows Motif user interface) Displays the current value of a variable or language expression in the monitor view of the HP DECwindows Motif user interface |
1.13.4. Controlling Type Selection and Radix
(SET,SHOW,CANCEL) RADIX |
(Establishes, displays, restores) the radix for data entry and display |
(SET,SHOW,CANCEL) TYPE |
(Establishes, displays, restores) the type for program locations that are not associated with a compiler-generated type |
SET MODE [NO]G_FLOAT |
Controls whether double-precision floating-point constants are interpreted as G_FLOAT or D_FLOAT |
1.13.5. Controlling Symbol Searches and Symbolization
SHOW SYMBOL |
Displays symbols in your program |
(SET,SHOW,CANCEL) MODULE |
Sets a module by loading its symbol information into the debugger's symbol table, identifies, cancels a set module |
(SET,SHOW,CANCEL) IMAGE |
Sets a shareable image by loading data structures into the debugger's symbol table, identifies, cancels a set image |
SET MODE [NO]DYNAMIC |
Controls whether or not modules and shareable images are set automatically when the debugger interrupts execution |
(SET,SHOW,CANCEL) SCOPE |
(Establishes, displays, restores) the scope for symbol searches |
SYMBOLIZE |
Converts a memory address to a symbolic address expression |
SET MODE [NO]LINE |
Controls whether or not program locations are displayed
in terms of line numbers or |
SET MODE [NO]SYMBOLIC |
Controls whether or not program locations are displayed symbolically or in terms of numeric addresses |
1.13.6. Displaying Source Code
TYPE |
Displays lines of source code |
EXAMINE/SOURCE |
Displays the source code at the location specified by the address expression |
SEARCH |
Searches the source code for the specified string |
(SET,SHOW) SEARCH |
(Establishes, displays) the default qualifiers for the SEARCH command |
SET STEP [NO]SOURCE |
Enables/disables the display of source code after a STEP command has been executed or at a breakpoint, tracepoint, or watchpoint |
(SET,SHOW) MARGINS |
(Establishes, displays) the left and right margin settings for displaying source code |
(SET,SHOW,CANCEL) SOURCE |
(Creates, displays, cancels) a source directory search list |
1.13.7. Using Screen Mode
SET MODE [NO]SCREEN |
Enables/disables screen mode |
DISPLAY |
Creates or modifies a display |
SCROLL |
Scrolls a display |
EXPAND |
Expands or contracts a display |
MOVE |
Moves a display across the screen |
(SHOW,CANCEL) DISPLAY |
(Identifies, deletes) a display |
(SET,SHOW,CANCEL) WINDOW |
(Creates, identifies, deletes) a window definition |
SELECT |
Selects a display for a display attribute |
SHOW SELECT |
Identifies the displays selected for each of the display attributes |
SAVE |
Saves the current contents of a display into another display |
EXTRACT |
Saves a display or the current screen state into a file |
(SET,SHOW) TERMINAL |
(Establishes, displays) the terminal screen height and width that the debugger uses when it formats displays and other output |
SET MODE [NO]SCROLL |
Controls whether an output display is updated line by line or once per command |
|
Refreshes the screen |
1.13.8. Editing Source Code
EDIT |
Starts an editor during a debugging session |
(SET,SHOW) EDITOR |
(Establishes, identifies) the editor started by the EDIT command |
1.13.9. Defining Symbols
DEFINE |
Defines a symbol as an address, command, or value |
DELETE |
Deletes symbol definitions |
(SET,SHOW) DEFINE |
(Establishes, displays) the default qualifier for the DEFINE command |
SHOW SYMBOL/DEFINED |
Identifies symbols that have been defined with the DEFINE command |
1.13.10. Using Keypad Mode
SET MODE [NO]KEYPAD |
Enables/disables keypad mode |
DEFINE/KEY |
Creates key definitions |
DELETE/KEY |
Deletes key definitions |
SET KEY |
Establishes the key definition state |
SHOW KEY |
Displays key definitions |
1.13.11. Using Command Procedures, Log Files, and Initialization Files
@(execute procedure) |
Executes a command procedure |
(SET,SHOW) ATSIGN |
(Establishes, displays) the default file specification that the debugger uses to search for command procedures |
DECLARE |
Defines parameters to be passed to command procedures |
(SET,SHOW) LOG |
(Specifies, identifies) the debugger log file |
SET OUTPUT [NO]LOG |
Controls whether or not a debugging session is logged |
SET OUTPUT [NO]SCREEN_LOG |
Controls whether or not, in screen mode, the screen contents are logged as the screen is updated |
SET OUTPUT [NO]VERIFY |
Controls whether or not debugger commands are displayed as a command procedure is executed |
SHOW OUTPUT |
Identifies the current output options established by the SET OUTPUT command |
1.13.12. Using Control Structures
FOR |
Executes a list of commands while incrementing a variable |
IF |
Executes a list of commands conditionally |
REPEAT |
Executes a list of commands a specified number of times |
WHILE |
Executes a list of commands while a condition is true |
EXITLOOP |
Exits an enclosing WHILE, REPEAT, or FOR loop |
1.13.13. Debugging Multiprocess Programs
process-spec, DISPLAY
/PROCESS=).
CONNECT |
Brings a process under debugger control |
DEFINE/PROCESS_SET |
Assigns a symbolic name to a list of process specifications |
SET MODE [NO]INTERRUPT |
Controls whether execution is interrupted in other processes when it is paused in some process |
(SET,SHOW) PROCESS |
Modifies the multiprocess debugging environment, displays process information |
WAIT |
When debugging a multiprocess program, controls whether the debugger waits until all processes have stopped before prompting for another command |
1.13.14. Additional Commands
HELP |
Displays online help on debugger commands and selected topics |
ANALYZE/CRASH_DUMP |
Opens a process dump for analysis with the System Dump Debugger (SDD) |
ANALYZE/PROCESS_DUMP |
Opens a process dump for analysis with the System Code Debugger (SCD) |
(DISABLE,ENABLE,SHOW) AST |
(Disables, enables) the delivery of ASTs in the program, identifies whether delivery is enabled or disabled |
PTHREAD |
Passes a command to the POSIX Threads Debugger |
(SET,SHOW) EVENT_FACILITY |
(Establishes, identifies) the current run-time facility for Ada, POSIX Threads, and SCAN events |
(SET,SHOW) LANGUAGE |
(Establishes, identifies) the current language |
SET OUTPUT [NO]TERMINAL |
Controls whether debugger output, except for diagnostic messages, is displayed or suppressed |
SET PROMPT |
Specifies the debugger prompt |
(SET,SHOW) TASK|THREAD |
Modifies the tasking environment, displays task information |
SHOW EXIT_HANDLERS |
Identifies the exit handlers declared in the program |
SHOW MODE |
Identifies the current debugger modes established by the SET MODE command (for example, screen mode, step mode) |
SHOW OUTPUT |
Identifies the current output options established by the SET OUTPUT command |
Part II. Command Interface
Chapter 2. Getting Started with the Debugger
This chapter gives a tutorial introduction to the debugger's command interface.
Entering debugger commands and getting online help
Viewing your source code with the TYPE command and in screen mode
Controlling program execution with the GO, STEP, and SET BREAK commands, and monitoring execution with the SHOW CALLS, SET TRACE, and SET WATCH commands
Examining and manipulating data with the EXAMINE, DEPOSIT, and EVALUATE commands
Controlling symbol references with path names and the SET MODULE and SET SCOPE commands
Several examples are language specific. However, the general concepts are readily adaptable to all supported languages.
The sample debugging session in Section 2.6, ''Sample Debugging Session'' shows how to use some of this information to locate an error and correct it.
For information about starting and ending a debugging session, see Section 1.3, ''Debugging a Program with the Kept Debugger''.
2.1. Entering Debugger Commands and Accessing Online Help
DBG>) is displayed.
To enter a command, type it at the keyboard and press Return. For
example, the following command sets a watchpoint on the variable
COUNT:
DBG> SET WATCH COUNT
To list the help topics, type HELP at the prompt.
For an explanation of the help system, type HELP.
For complete rules on entering commands, type HELP
Command_Format.To display help on a particular command, type HELP
command. For example, to display HELP on the SET WATCH command, type HELP SET WATCH.To list commands grouped by function, type HELP
Command_Format.
- New_Features
- Release_Notes
- Address_Expressions
- Built_in_Symbols
- DECwindows_Interface
- Keypad_Definitions
- Language_Support
- Logical_Names
- Messages (diagnostic messages)
- Path_Names (to qualify symbolic names)
- Screen_Mode
- SS$_DEBUG condition (to start debugger from program)
- System_Management
To display help about any of these topics, type HELP
topic. For example, to display information
about diagnostic messages, type HELP Messages.
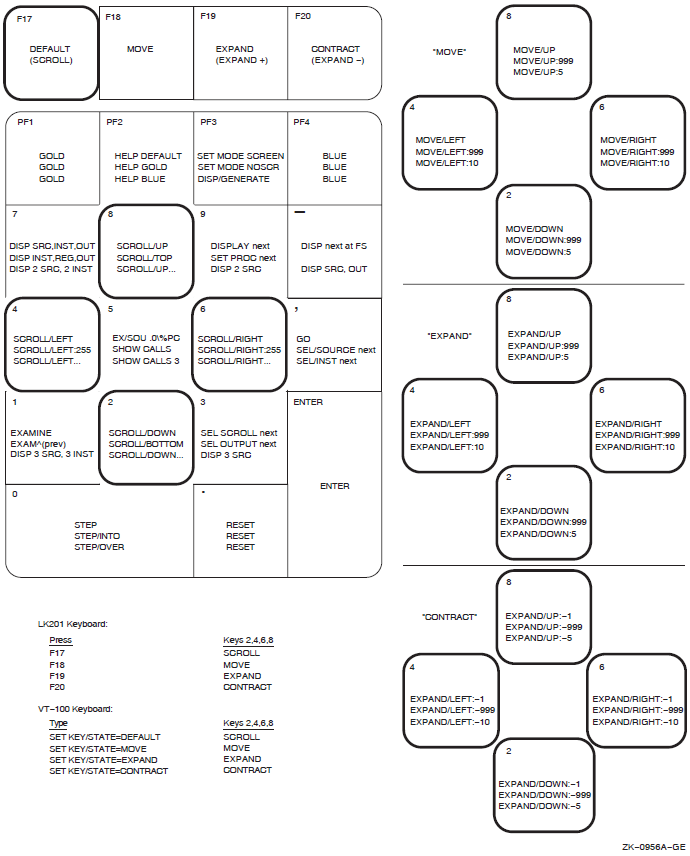
When you start the debugger, a few commonly used command sequences are automatically assigned to the keys on the numeric keypad (to the right of the main keyboard). Thus, you can perform certain functions either by entering a command or by pressing a keypad key.
The predefined key functions are identified in Figure 2.1, ''Keypad Key Functions Predefined by the Debugger—Command Interface''.
To enter a key's DEFAULT function, press the key.
To enter its GOLD function, first press and release the PF1 (GOLD) key, and then press the key.
To enter its BLUE function, first press and release the PF4 (BLUE) key, and then press the key.
Pressing KP0 (keypad key 0) enters the STEP command.
Pressing PF1 KP0 enters the STEP /INTO command.
Pressing PF4 KP0 enters the STEP /OVER command.
Normally, keys KP2, KP4, KP6, and KP8 scroll screen displays down, left, right, or up,
respectively. By putting the keypad in the MOVE, EXPAND, or CONTRACT state, indicated in
Figure 2.1, ''Keypad Key Functions Predefined by the Debugger—Command Interface'', you can also use these keys to move, expand, or contract
displays in four directions. Enter the command HELP
Keypad_Definitions to display the keypad
key definitions.
2.2. Displaying Source Code
The debugger provides two modes for displaying information: noscreen mode and screen mode. By default, when you start the debugger, you are in noscreen mode, but you might find that it is easier to view source code in screen mode. The following sections briefly describe both modes.
2.2.1. Noscreen Mode
Noscreen mode is the default, line-oriented mode of displaying input and output. The interactive examples throughout this chapter, excluding Section 2.2.2, ''Screen Mode'', show noscreen mode.
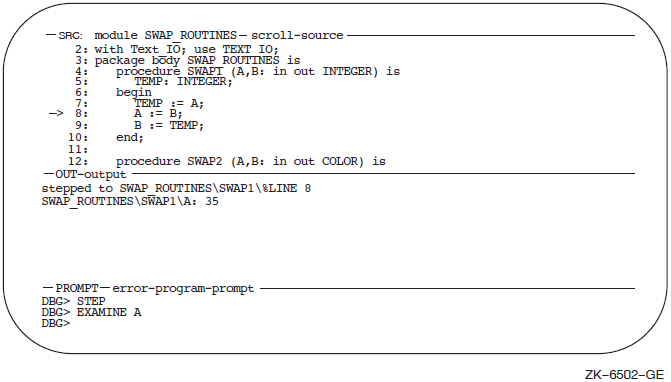
DBG> TYPE 7
module SWAP_ROUTINES
     7:        TEMP := A;
DBG>DBG> TYPE TEST\16:21
Path names are discussed in more detail in Section 2.3.2, ''Executing the Program by Step Unit'', with the STEP command.
You can also use the EXAMINE /SOURCE command to display the source line for a routine or any other program location that is associated with an instruction.
The debugger also displays source lines automatically when it suspends execution at a breakpoint or watch point, after a STEP command, or when a trace point is triggered (see Section 2.3, ''Controlling and Monitoring Program Execution'').
After displaying source lines at various locations in your program, you can redisplay the location at which execution is currently paused by pressing KP5.
Execution is paused within a module that was compiled or linked without the /DEBUG qualifier.
Execution is paused within a system or shareable image routine for which no source code is available.
The source file was moved to a different directory after it was compiled (the location of source files is embedded in the object modules).In this case, use the SET SOURCE command to specify the new location.
The module might need to be set with the SET MODULE command. Module setting is explained in Section 2.5.1, ''Setting and Canceling Modules''.
To switch to noscreen mode from screen mode, press PF1 PF3 (or type SET MODE NOSCREEN). You can use the TYPE and EXAMINE /SOURCE commands in screen mode as well as noscreen mode.
2.2.2. Screen Mode
Screen mode provides the easiest way to view your source code. To switch to screen mode, press PF3 (or type SET MODE SCREEN). In screen mode, by default the debugger splits the screen into three displays named SRC, OUT, and PROMPT, as shown in Figure 2.2, ''Default Screen Mode Display Configuration''.
 |
The SRC display shows the source code of the module in which execution is currently paused. An arrow in the left column points to the source line corresponding to the current value of the program counter (PC). The PC is a register that contains the memory address of the instruction to be executed next. The line numbers, which are assigned by the compiler, match those in a listing file. As you execute the program, the arrow moves down and the source code is scrolled vertically to center the arrow in the display.
The OUT display captures the debugger's output in response to the commands that you enter. The PROMPT display shows the debugger prompt, your input (the commands that you enter), debugger diagnostic messages, and program output.
You can scroll both SRC and OUT to see whatever information might scroll beyond the display window's edge. Press KP3 repeatedly as needed to select the display to be scrolled (by default, SRC is scrolled). Press KP8 to scroll up and KP2 to scroll down. Scrolling a display does not affect program execution.
%DEBUG-I-SOURCESCOPE, Source lines not available for .0
\%PC.Displaying source in a caller of the current routine.
DBG>
In such cases, the arrow in the SRC display identifies the line that contains code following the call statement in the calling routine.
2.3. Controlling and Monitoring Program Execution
Start and resume program execution
Execute the program to the next source line, instruction, or other step unit
Determine where execution is currently paused
Use breakpoints to suspend program execution at points of interest
Use trace points to trace the execution path of your program through specified locations
Use watchpoints to monitor changes in the values of variables
With this information you can pick program locations where you can then test and manipulate the contents of variables as described in Section 2.4, ''Examining and Manipulating Program Data''.
2.3.1. Starting or Resuming Program Execution
Use the GO command to start or resume program execution.
The program completes execution
A breakpoint is reached
A watchpoint is triggered
An exception is signaled
You press Ctrl/C
With most programming languages, when you bring a program under debugger control, execution is initially paused directly at the beginning of the main program. Entering a GO command at this point quickly enables you to test for an infinite loop or an exception.
If an infinite loop occurs during execution, the program does not terminate, so the debugger prompt does not reappear. To obtain the prompt, interrupt execution by pressing Ctrl/C (see Section 1.4, ''Interrupting Program Execution and Aborting Debugger Commands''). If you are using screen mode, the pointer in the source display indicates where execution stopped. You can also use the SHOW CALLS command to identify the currently active routine calls on the call stack (see Section 2.3.3, ''Determining Where Execution Is Paused'').
If an exception that is not handled by your program is signaled, the debugger interrupts execution at that point so that you can enter commands. You can then look at the source display and a SHOW CALLS display to find where execution is paused.
The most common use of the GO command is in conjunction with breakpoints, tracepoints, and watchpoints, as described in Section 2.3.4, ''Suspending Program Execution with Breakpoints'', Section 2.3.5, ''Tracing Program Execution with Tracepoints'', and Section 2.3.6, ''Monitoring Changes in Variables with Watchpoints'', respectively. If you set a breakpoint in the path of execution and then enter the GO command, execution is paused at that breakpoint. Similarly, if you set a tracepoint, execution is monitored through that tracepoint. If you set a watchpoint, execution is paused when the value of the watched variable changes.
2.3.2. Executing the Program by Step Unit
Use the STEP command to execute the program one or more step units at a time.
DBG> STEP
stepped to TEST\COUNT\%LINE 27
     27:   X := X + 1;
DBG>
Execution is now paused at the first machine-code instruction for line 27 within routine COUNT of module TEST.
When displaying a program symbol (for example, a line number, routine name, or variable name),
the debugger always uses a path name. A path name consists of
the symbol plus a prefix that identifies the symbol's location. In the previous
example, the path name is TEST \COUNT \%LINE27. The leftmost
element of a path name is the module name. Moving toward the right, the path name
lists any successively nested routines and blocks that enclose the symbol. A
backslash character (\) is used to separate elements (except when
the language is Ada, where a period is used to parallel Ada syntax).
A path name uniquely identifies a symbol of your program to the debugger. In general, you need to use path names in commands only if the debugger cannot resolve a symbol ambiguity in your program (see Section 2.5, ''Controlling Access to Symbols in Your Program''). Usually the debugger can determine the symbol you mean from its context.
When using the STEP command, note that only those source lines for which code instructions were generated by the compiler are recognized as executable lines by the debugger. The debugger skips over any other lines - for example, comment lines.
You can specify different stepping modes, such as stepping by instruction rather than by line (SET STEP INSTRUCTION). Also, by default, the debugger steps over called routines-execution is not paused within a called routine, although the routine is executed. By entering the SET STEP INTO command, you direct the debugger to suspend execution within called routines as well as within the routine in which execution is currently paused (SET STEP OVER is the default mode).
2.3.3. Determining Where Execution Is Paused
Use the SHOW CALLS command when you are unsure where execution is paused during a debugging session (for example, after a Ctrl/C interruption).
The name of the module that contains the routine
The name of the routine
The line number at which the call was made (or at which execution is paused, in the case of the current routine)
The corresponding PC value
On Alpha and Integrity server processors, the PC is shown as a memory address relative to the first code address in the module and also as an absolute address.
Note that on Integrity server processors, there is no hardware PC register. The PC is a software constructed value, built by adding the hardware Instruction Pointer (IP) register and the slot offset of the instruction within the bundle (0, 1, or 2).
DBG> SHOW CALLS
module name   routine name   line   rel PC     abs PC
*TEST         PRODUCT        18     00000009   0000063C
*TEST         COUNT          47     00000009   00000647
*MY_PROG      MY_PROG        21     0000000D   00000653
DBG>
This example indicates that execution is paused at line 18 of routine PRODUCT (in module TEST), which was called from line 47 of routine COUNT (in module TEST), which was called from line 21 of routine MY_PROG (in module MY_PROG).
2.3.4. Suspending Program Execution with Breakpoints
The SET BREAK command enables you to select locations at which to suspend program execution (breakpoints).You can then enter commands to check the call stack, examine the current values of variables, and so on. You resume execution from a breakpoint with the GO or STEP commands.
DBG> SET BREAK COUNT
DBG> GO
   .
   .
   .
break at routine PROG2\COUNT
     54:  procedure COUNT(X, Y:INTEGER);
DBG>Execution is paused.
The debugger announces that the breakpoint at COUNT has been reached ("break at …").
The debugger displays the source line (54) at which execution is paused.
The debugger prompts for another command.
At this breakpoint, you can use the STEP command to step through routine COUNT and then use the EXAMINE command (discussed in Section 2.4.1, ''Displaying the Value of a Variable'') to check on the values of X and Y.
When using the SET BREAK command, you can specify program locations using various kinds of address expressions (for example, line numbers, routine names, memory addresses, byte offsets). With high-level languages, you typically use routine names, labels, or line numbers, possibly with path names to ensure uniqueness.
DBG> SET BREAK %LINE 41
DBG> SET BREAK SCREEN_IO\%LINE 58
DBG> SET BREAK/LINE
DBG> SET BREAK/CALL
You can set breakpoints on events, such as exceptions, or state transitions in tasking programs.
You can conditionalize a breakpoint (with a WHEN clause)or specify that a list of commands be executed at the breakpoint (with a DO clause).
To display the current breakpoints, enter the SHOW BREAK command.
To deactivate a breakpoint, enter the DEACTIVATE BREAK command, and specify the program location exactly as you did when setting the breakpoint. This causes the debugger to ignore the breakpoint during program execution. However, you can activate it at a later time, for example, when you rerun the program (see Section 1.3.3, ''Rerunning the Same Program from the Kept Debugger''). A deactivated breakpoint is listed as such in a SHOW BREAK display.
To activate a breakpoint, use the ACTIVATE BREAK command. Activating a breakpoint causes it to take effect during program execution.
The commands DEACTIVATE BREAK/ALL and ACTIVATE BREAK/ALL operate on all breakpoints and are particularly useful when rerunning a program.
To cancel a breakpoint, use the CANCEL BREAK command. A canceled breakpoint is no longer listed in a SHOW BREAK display.
2.3.5. Tracing Program Execution with Tracepoints
The SET TRACE command enables you to select locations for tracing the execution of your program (tracepoints), without stopping its execution. After setting a tracepoint, you can start execution with the GO command and then monitor the path of execution, checking for unexpected behavior. By setting a tracepoint on a routine, you can also monitor the number of time sit is called.
DBG> SET TRACE COUNT
DBG> GO
trace at routine PROG2\COUNT
     54:  procedure COUNT(X, Y:INTEGER);
   .
   .
   .
This is the only difference between a breakpoint and a tracepoint. When using the SET TRACE command, you specify address expressions, qualifiers, and optional clauses exactly as with the SET BREAK command. The commands SHOW TRACE, ACTIVATE TRACE, DEACTIVATE TRACE, and CANCEL TRACE operate on tracepoints in a manner similar to the corresponding commands for breakpoints (see Section 2.3.4, ''Suspending Program Execution with Breakpoints'').
2.3.6. Monitoring Changes in Variables with Watchpoints
The SET WATCH command enables you to specify program variables that the debugger monitors as your program executes. This process is called setting watchpoints. If the program modifies the value of a watched variable, the debugger suspends execution and displays information. The debugger monitors watchpoints continuously during program execution. (Note that you can also use the SET WATCH command to monitor arbitrary program locations, not just variables.)
TOTAL:DBG> SET WATCH TOTAL
Note
The technique you use to set watchpoints depends on your system (Alpha or Integrity servers) and the type of variable, static or nonstatic. On Alpha systems, for example, a static variable is associated with the same memory address throughout program execution.
DBG> SET WATCH TOTAL
DBG> GO
   .
   .
   .
watch of SCREEN_IO\TOTAL at SCREEN_IO\%LINE 13
     13:   TOTAL = TOTAL + 1;
    old value: 16
    new value: 17
break at SCREEN_IO\%LINE 14
     14:   POP(TOTAL);
DBG>
In this example, a watchpoint is set on the variable TOTAL and execution is started. When the value of TOTAL changes, execution is paused. The debugger announces the event ("watch of …"), identifying where TOTAL changed (the beginning of line 13) and the associated source line. The debugger then displays the old and new values and announces that execution has been paused at the beginning of the next line (14). Finally, the debugger prompts for another command. When a change in a variable occurs at a point other than the beginning of a source line, the debugger gives the line number plus the byte offset from the beginning of the line.
On Alpha systems, you can set a watchpoint on a nonstatic variable by setting a tracepoint on the defining routine and specifying a DO clause to set the watchpoint whenever execution reaches the tracepoint. Since a nonstatic variable is allocated on the stack or in a register and exists only when its defining routine is active (on the call stack), the variable name is not always meaningful in the way that a static variable name is.
DBG> SET TRACE/NOSOURCE ROUT3 DO (SET WATCH Y)
DBG> GO
   .
   .
   .
trace at routine MOD4\ROUT3
%DEBUG-I-WPTTRACE, nonstatic watchpoint, tracing every
                   instruction
   .
   .
   .
watch of MOD4\ROUT3\Y at MOD4\ROUT3\%LINE 16
   16:      Y := 4
   old value:    3
   new value:    4
break at MOD4\ROUT3\%LINE 17
   17:     SWAP(X, Y);
DBG>
When execution returns to the calling routine, the nonstatic variable is no longer active, so the debugger automatically cancels the watchpoint and issues a message to that effect.
On Alpha and Integrity servers, the debugger treats all watchpoints as nonstatic watchpoints.
The commands SHOW WATCH, ACTIVATE WATCH, DEACTIVATE WATCH, and CANCEL WATCH operate on watchpoints in a manner similar to the corresponding commands for breakpoints (see Section 2.3.4, ''Suspending Program Execution with Breakpoints''). However, a nonstatic watchpoint exists only as long as execution remains within the scope of the variable being watched.
2.4. Examining and Manipulating Program Data
This section explains how to use the EXAMINE, DEPOSIT, and EVALUATE commands to display and modify the contents of variables and evaluate expressions. Before you can examine or deposit into a nonstatic variable, as defined in Section 2.3.6, ''Monitoring Changes in Variables with Watchpoints'', its defining routine must be active.
2.4.1. Displaying the Value of a Variable
EXAMINE address-expressionThe debugger recognizes the compiler-generated data type of the variable you specify and retrieves and formats the data accordingly. The following examples show some uses of the EXAMINE command.
DBG> EXAMINE EMPLOYEE_NAME
PAYROLL\EMPLOYEE_NAME:
    "Peter C. Lombardi"
DBG>DBG> EXAMINE WIDTH, LENGTH, AREA SIZE\WIDTH: 4 SIZE\LENGTH: 7 SIZE\AREA: 28 DBG>
DBG> EXAMINE REAL_ARRAY
PROG2\REAL_ARRAY
   (1, 1):       27.01000
   (1, 2):       31.00000
   (1, 3):       12.48000
   (2, 1):       15.08000
   (2, 2):       22.30000
   (2, 3):       18.73000
DBG>
DBG> EXAMINE CHAR_ARRAY(4)
PROG2\CHAR_ARRAY(4): 'm'
DBG>
DBG> EXAMINE PART
INVENTORY\PART:
    ITEM:      "WF-1247"
    PRICE:     49.95
    IN_STOCK:  24
DBG>DBG> EXAMINE IN_STOCK OF PART
INVENTORY\IN-STOCK of PART:
IN_STOCK: 24
DBG>You can use the EXAMINE command with any kind of address expression (not just a variable name) to display the contents of a program location. The debugger associates certain default data types with untyped locations. If you want the data interpreted and displayed in some other data format you can override the defaults for typed and untyped locations.
2.4.2. Assigning a Value to a Variable
DEPOSITaddress-expression=language-expression
The DEPOSIT command is like an assignment statement in most programming languages.
In the following examples, the DEPOSIT command assigns new values to different variables. The debugger checks that the value assigned, which can be a language expression, is consistent with the data type and dimensional constraints of the variable.
DBG> DEPOSIT PART_NUMBER = "WG-7619.3-84"
DBG> DEPOSIT WIDTH = CURRENT_WIDTH + 10
DBG> DEPOSIT C_ARRAY(12) := 'K'
DBG> DEPOSIT EMPLOYEE.ZIPCODE = 02172
DBG> DEPOSIT X = -14
%DEBUG-I-IVALOUTBNDS, value assigned is out of bounds
        at or near DEPOSIT
As with the EXAMINE command, you can specify any kind of address expression (not just a variable name) with the DEPOSIT command. You can override the defaults for typed and untyped locations if you want the data interpreted in some other data format.
2.4.3. Evaluating Language Expressions
EVALUATE language-expressionWIDTH; the EVALUATE command then obtains
the sum of the current value of WIDTH and 7:
DBG> DEPOSIT WIDTH := 45
DBG> EVALUATE WIDTH + 7
52
DBG>
DBG> DEPOSIT WILLING := TRUE
DBG> DEPOSIT ABLE := FALSE
DBG> EVALUATE WILLING AND ABLE
False
DBG>
2.5. Controlling Access to Symbols in Your Program
To have full access to the symbols that are associated with your program (variable names, routine names, source code, line numbers, and so on), you must compile and link the program using the /DEBUG qualifier, as explained in Section 1.2, ''Preparing an Executable Image for Debugging''.
Setting and canceling modules
Resolving symbol ambiguities
2.5.1. Setting and Canceling Modules
To facilitate symbol searches, the debugger loads symbol information from the executable image into a run-time symbol table (RST), where that information can be accessed efficiently. Unless symbol information is in the RST, the debugger does not recognize or properly interpret the associated symbols.
Because the RST takes up memory, the debugger loads it dynamically, anticipating what symbols you might want to reference in the course of program execution. The loading process is called module setting, because all symbol information for a given module is loaded into the RST atone time.
Initially, only the module containing the image transfer address is set. Subsequently, whenever execution of the program is interrupted, the debugger sets the module that contains the routine in which execution is paused. This enables you to reference the symbols that should be visible at that location.
DBG> EXAMINE K
%DEBUG-W-NOSYMBOL, symbol 'K' is not in symbol table
DBG>
DBG> SET MODULE MOD3
DBG> EXAMINE K
MOD3\ROUT2\K: 26
DBG>
The SHOW MODULE command lists the modules of your program and identifies which modules are set.
Dynamic module setting can slow the debugger down as more and more modules are set. If performance becomes a problem, you can use the CANCEL MODULE command to reduce the number of set modules, or you can disable dynamic module setting by entering the SET MODE NODYNAMIC command (SET MODE DYNAMIC enables dynamic module setting).
2.5.2. Resolving Symbol Ambiguities
Symbol ambiguities can occur when a symbol (for example, a variable name X)is defined in more than one routine or other program unit.
In most cases, the debugger resolves symbol ambiguities automatically. First, it uses the scope and visibility rules of the currently set language. In addition, because the debugger permits you to specify symbols in arbitrary modules (to set breakpoints and so on), the debugger uses the ordering of routine calls on the call stack to resolve symbol ambiguities.
DBG> EXAMINE Y
%DEBUG-W-NOUNIQUE, symbol 'Y' is not unique
DBG>
DBG> SHOW SYMBOL Y
data MOD7\ROUT3\BLOCK1\Y
data MOD4\ROUT2\Y
DBG> EXAMINE MOD4\ROUT2\Y
MOD4\ROUT2\Y: 12
DBG>
DBG> SET SCOPE MOD4\ROUT2
DBG> EXAMINE Y
MOD4\ROUT2\Y: 12
DBG>
To display the current scope for symbol lookup, use the SHOW SCOPE command. To restore the default scope, use the CANCEL SCOPE command.
2.6. Sample Debugging Session
This section walks you through a debugging session with a simple Fortran program that contains a logic error (see Example 2.1, ''Sample Program SQUARES''). Compiler-assigned line numbers have been added in the example so that you can identify the source lines referenced in the discussion.
Reads a sequence of integer numbers from a data file and saves these numbers in the array INARR (lines 4 and 5).
Enters a loop in which it copies the square of each nonzero integer into another array OUTARR (lines 8 through 13).
Prints the number of nonzero elements in the original sequence and the square of each such element (lines 16 through 21).
 1:       INTEGER INARR(20), OUTARR(20)
 2: C
 3: C     ---Read the input array from the data file.
 4:       OPEN(UNIT=8, FILE='DATAFILE.DAT', STATUS='OLD')
 5:       READ(8,*) N, (INARR(I), I=1,N)
 6: C
 7: C     ---Square all nonzero elements and store in OUTARR.
 8:       K = 0
 9:       DO 10 I = 1, N
10:       IF(INARR(I) .NE. 0) THEN
11:           OUTARR(K) = INARR(I)**2
12:       ENDIF
13:    10 CONTINUE
14: C
15: C     ---Print the squared output values.  Then stop.
16:       PRINT 20, K
17:    20 FORMAT(' Number of nonzero elements is',I4)
18:       DO 40 I = 1, K
19:       PRINT 30, I, OUTARR(I)
20:    30 FORMAT(' Element',I4,' has value',I6)
21:    40 CONTINUE
22: END$ RUN SQUARES Number of nonzero elements is 0
The error in the program is that variable K, which keeps track of the current index into OUTARR, is not incremented in the loop on lines 9 through 13. The statement K = K + 1 should be inserted just before line 11.
$ FORTRAN/DEBUG/NOOPTIMIZE SQUARES$ LINK/DEBUG SQUARES
$ DEBUG/KEEP
Debugger Banner and Version Number DBG> RUN SQUARES
Language: FORTRAN, Module: SQUARES$MAIN DBG> STEP 4
stepped to SQUARES$MAIN\%LINE 9 9: DO 10 I = 1, N DBG> EXAMINE N, K
SQUARES$MAIN\N: 9 SQUARES$MAIN\K: 0 DBG> STEP 2
stepped to SQUARES$MAIN\%LINE 11 11: OUTARR(K) = INARR(I)**2 DBG> EXAMINE I, K
SQUARES$MAIN\I: 1 SQUARES$MAIN\K: 0 DBG> DEPOSIT K = 1
DBG> SET TRACE/SILENT %LINE 11 DO (DEPOSIT K = K + 1)
DBG> GO
Number of nonzero elements is 4 Element 1 has value 16 Element 2 has value 36 Element 3 has value 9 Element 4 has value 49 'Normal successful completion' DBG> SPAWN
$ EDIT SQUARES.FOR
. . . 10: IF(INARR(I) .NE. 0) THEN 11: K = K + 1 12: OUTARR(K) = INARR(I)**2 13: ENDIF . . . $ FORTRAN/DEBUG/NOOPTIMIZE SQUARES
$ LINK/DEBUG SQUARES $ LOGOUT
DBG> RUN SQUARES
Language: FORTRAN, Module: SQUARES$MAIN DBG> SET BREAK %LINE 12 DO (EXAMINE I, K)
DBG> GO
SQUARES$MAIN\I: 1 SQUARES$MAIN\K: 1 DBG> GO SQUARES$MAIN\I: 2 SQUARES$MAIN\K: 2 DBG> GO SQUARES$MAIN\I: 4 SQUARES$MAIN\K: 3 DBG> EXIT
$
| The /DEBUG qualifier on the DCL FORTRAN command
directs the compiler to write the symbol information associated with
SQUARES into the object module,
The /NOOPTIMIZE qualifier disables optimization by the Fortran compiler, which ensures that the executable code matches the source code of the program. Debugging optimized code can be confusing because the contents of some program locations might be inconsistent with what you would expect from viewing the source code. |
| The /DEBUG qualifier on the DCL command LINK causes the linker to include all symbol
information that is contained in |
| The DCL command DEBUG /KEEP starts the debugger, which displays its
banner and the debugger prompt, |
| The debugger command RUN SQUARES brings the program SQUARES under debugger control. The informational message identifies the source language of the program and the name of the main program unit (FORTRAN and SQUARES, respectively, in this example). Execution is initially paused at the start of the main program unit (line 1 of SQUARES, in this example). |
| You decide to test the values of variables N and K after the READ statement has been executed and the value 0 has been assigned to K. The command STEP 4 executes 4 source lines of the program. Execution is now paused at line 9. Note that the STEP command ignores source lines that do not result in executable code; also, by default, the debugger identifies the source line at which execution is paused. |
| The command EXAMINE N, K displays the current values of N and K. Their values are correct at this point in the execution of the program. |
| The command STEP 2 executes the program into the loop that copies and squares all nonzero elements of INARR into OUTARR. |
| The command EXAMINE I, K displays the current values of I and K. I has the expected value 1, but K has the value 0 instead of 1, which is the expected value. Now you can see the error in the program: K should be incremented in the loop just before it is used in line 11. |
| The DEPOSIT command assigns K the value it should have now: 1. |
| The SET TRACE command is now used to patch the program so that the
value of K is incremented automatically in the loop. The command sets a trace point that
triggers every time execution reaches line 11:
|
| To test the patch, the GO command starts execution from the current location. The program output shows that the patched program works properly. The EXIT STATUS message shows that the program executed to completion. |
| The SPAWN command spawns a subprocess to return control temporarily to DCL level (without ending the debugging session) so that you can correct the source file and recompile and relink the program. |
| The EDIT command invokes an editor and the source file is edited to add K = K + 1 after line 10, as shown. (Compiler-assigned line numbers have been added to clarify the example.) |
| The revised program is compiled and linked. |
| The LOGOUT command terminates the spawned subprocess and returns control to the debugger. |
| The (debugger) command RUN SQUARES brings the revised program under debugger control so that its correct execution can be verified. |
| The SET BREAK command sets a breakpoint that triggers every time line 12 is executed. The DO clause displays the values of I and K automatically when the breakpoint triggers. |
| The GO command starts execution. At the first breakpoint, the value of K is 1, indicating that the program is running correctly so far. Each additional GO command shows the current values of I and K. After two more GO commands, K is now 3, as expected, but note that I is 4. The reason is that one of the INARR elements was 0 so that lines 11 and 12 were not executed (and K was not incremented) for that iteration of the DO loop. This confirms that the program is running correctly. |
| The EXIT command ends the debugging session and returns control to DCL level. |
Chapter 3. Controlling and Monitoring Program Execution
Executing the program by step unit
Suspending and tracing execution with breakpoints and tracepoints
Monitoring changes in variables and other program locations with watchpoints
Starting or resuming program execution with the GO command (Section 2.3.1, ''Starting or Resuming Program Execution'')
Monitoring where execution is currently paused with the SHOW CALLS command (Section 2.3.3, ''Determining Where Execution Is Paused'')
See Chapter 15, "Debugging Multiprocess Programs" for additional information specific to multiprocess programs.
See Chapter 16, "Debugging Tasking Programs" for additional information specific to tasking (multithread) programs.
For information about rerunning your program or running another program from the current debugging session, see Section 1.3.3, ''Rerunning the Same Program from the Kept Debugger''and Section 1.3.4, ''Running Another Program from the Kept Debugger''.
3.1. Commands Used to Execute the Program
- GO
- STEP
- CALL
- EXIT (if your program has exit handlers)
As explained in Section 2.3.1, ''Starting or Resuming Program Execution'' and Section 2.3.2, ''Executing the Program by Step Unit'', GO and STEP are the basic commands for starting and resuming program execution. The STEP command is discussed further in Section 3.2, ''Executing the Program by Step Unit''.
During a debugging session, routines are executed as they are called during the execution of a program. The CALL command enables you to arbitrarily call and execute a routine that was linked with your program. This command is discussed in Section 13.7, ''Calling Routines Independently of Program Execution''.
The EXIT command was discussed in Section 1.8, ''Ending a Debugging Session'', in conjunction with ending a debugging session. Because it executes any exit handlers in your program, it is also useful for debugging exit handlers (see Section 14.6, ''Debugging Exit Handlers'').
The program terminates
A breakpoint is reached
A watchpoint is triggered
An exception is signaled
You press Ctrl/C
3.2. Executing the Program by Step Unit
The STEP command (probably the most frequently used debugger command) enables you to execute your program in small increments called step units.
DBG> STEP
stepped to TEST\COUNT\%LINE 27
     27:   X := X + 1;
DBG>
Execution is now paused at the first machine-code instruction for line 27 of module TEST. Line 27 is in COUNT, a routine within module TEST.
DBG> STEP 3
stepped to TEST\COUNT\%LINE 34
     34:   SWAP (X, Y);
DBG>
Note that only those source lines for which code instructions were generated by the compiler are recognized as executable lines by the debugger. The debugger skips over any other lines - for example, comment lines. Also, if a line has more than one statement on it, the debugger executes all the statements on that line as part of the single step.
Source lines are displayed by default after stepping if they are available for the module being debugged. Source lines are not available if you are stepping in code that has not been compiled or linked with the /DEBUG qualifier (for example, a shareable image routine). If source lines are available, you can control their display with the SET STEP [NO]SOURCE command and the /[NO]SOURCE qualifier of the STEP command. For information about how to control the display of source code in general and in particular after stepping, see Chapter 6, "Controlling the Display of Source Code".
3.2.1. Changing the STEP Command Behavior
By specifying a STEP command qualifier - for example, STEP /INTO
By establishing a new default qualifier with the SET STEP command - for example, SET STEP INTO
DBG> STEP/INTO
stepped to routine TEST\PRODUCT
     6:    function PRODUCT (X, Y : INTEGER) return INTEGER is
DBG>
After the STEP /INTO command executes, subsequent STEP commands revert to the default behavior.
In contrast, the SET STEP command enables you to establish new defaults for the STEP command. These defaults remain in effect until another SET STEP command is entered. For example, the SET STEP INTO command causes subsequent STEP commands to behave like STEP /INTO (SET STEP LINE causes subsequent STEP commands to behave like STEP /LINE).
There is a SET STEP command parameter for each STEP command qualifier.
You can override the current STEP command defaults for the duration of a single STEP command by specifying other qualifiers. Use the SHOW STEP command to identify the current STEP command defaults.
3.2.2. Stepping Into and Over Routines
By default, when the PC is at a call statement and you enter the STEP command, the debugger steps over the called routine. Although the routine is executed, execution is not paused within the routine but, rather, on the beginning of the line that follows the call statement. When stepping by instruction, execution is paused on the instruction that follows a called routine's return instruction.
DBG> STEP
stepped to TEST\COUNT\%LINE 18
    18:       AREA := PRODUCT (LENGTH, WIDTH);
DBG> STEP/INTO
stepped to routine TEST\PRODUCT
     6:    function PRODUCT (X, Y : INTEGER) return INTEGER is
DBG>DBG> STEP/RETURN
stepped on return from TEST\PRODUCT\%LINE 11 to TEST\PRODUCT\%LINE 15+4
15: end PRODUCT;
DBG> STEP
stepped to TEST\COUNT\%LINE 19
19: LENGTH := LENGTH + 1;
DBG>DBG> SET STEP INTO
As a result of this command, when the PC is at a call statement, a STEP command suspends execution within the called routine. If you later want to step over routine calls, enter the SET STEP OVER command.
[NO]SHARE - Controls whether to step into called routines in shareable images.
[NO]SYSTEM - Controls whether to step into called system routines.
DBG> SET STEP INTO, NOSYSTEM, NOSHARE
3.3. Suspending and Tracing Execution with Breakpoints and Tracepoints
This section discusses using the SET BREAK and SET TRACE commands to, respectively, suspend and trace program execution. The commands are discussed together because of their similarities.
SET BREAK Command Overview
The SET
BREAK command lets you specify program locations or events at which to suspend program
execution (breakpoints). After setting a breakpoint, you can start or resume program execution
with the GO command, letting the program run until the specified location or
condition is reached. When the breakpoint is triggered, the debugger suspends execution,
identifies the breakpoint, and displays the DBG> prompt. You can then enter
debugger commands - for example, to determine where you are (with the SHOW
CALLS command), step into a routine, examine or modify variables, and so on.
SET BREAK[/qualifier[...]] [address-expression[, ...]]
    [WHEN (conditional-expression)]
    [DO (command[; ...])]
The following example shows a typical use of the SET BREAK command and shows the general default behavior of the debugger at a breakpoint.
DBG> SET BREAK COUNT
DBG> GO
⋮
break at routine PROG2\COUNT
     54:  procedure COUNT (X, Y:INTEGER);
DBG>
SET TRACE Command Overview
The SET TRACE command lets you select program locations or events for tracing the execution of your program without stopping its execution (tracepoints). After setting a tracepoint, you can start execution with the GO command and then monitor that location, checking for unexpected behavior. By setting a tracepoint on a routine, you can also monitor the number of times it is called.
The debugger's default behavior at a tracepoint is identical to that at a breakpoint, except
that program execution continues past a tracepoint. Thus, the DBG> prompt is
not displayed when a tracepoint is reached and announced by the debugger.
SET TRACE[/qualifier[...]] [address-expression[, ...]]
[WHEN (conditional-expression)]
[DO (command[; ...])]
The SET TRACE and SET BREAK commands have similar syntax. When using the SET TRACE command, specify address expressions, qualifiers, and the optional WHEN and DO clauses exactly as with the SET BREAK command.
Deactivate or cancel them (see Section 3.3.7, ''Deactivating, Activating, and Canceling Breakpoints or Tracepoints'')
Rerun the program with the RERUN/NOSAVE command (see Section 1.3.3, ''Rerunning the Same Program from the Kept Debugger'')
Run a new program (see Section 1.3.4, ''Running Another Program from the Kept Debugger'') or end the debugging session (Section 1.8, ''Ending a Debugging Session'')
To identify all of the breakpoints or tracepoints that are currently set, use the SHOW BREAK or SHOW TRACE command.
- DEACTIVATE BREAK, DEACTIVATE TRACE
- ACTIVATE BREAK, ACTIVATE TRACE
- CANCEL BREAK, CANCEL TRACE
The following sections describe how to specify program locations and events with the SET BREAK and SET TRACE commands.
3.3.1. Setting Breakpoints or Tracepoints on Individual Program Locations
To set a breakpoint or a tracepoint on a particular program location, specify an address expression with the SET BREAK or SET TRACE command.
Fundamentally, an address expression specifies a memory address or a register. Because the debugger understands the symbols associated with your program, the address expressions you typically use with the SET BREAK or SET TRACE command are routine names, labels, or source line numbers rather than memory addresses - the debugger converts these symbols to addresses.
3.3.1.1. Specifying Symbolic Addresses
Note
In some cases, when using the SET BREAK or SET TRACE command with a symbolic address expression, you might need to set a module or specify a scope or a path name. Those concepts are described in detail in Chapter 5, "Controlling Access to Symbols in Your Program". The examples in this section assume that all modules are set and that all symbols referenced are uniquely defined, unless otherwise indicated.
DBG> SET BREAK SWAP
DBG> SET TRACE LOOP1
DBG> SET BREAK/RETURN SWAP
DBG> SET TRACE %LABEL 20
DBG> SET BREAK %LINE 14
DBG> SET BREAK %LINE 6
%DEBUG-I-LINEINFO, no line 6, previous line is 5, next line is 8
%DEBUG-E-NOSYMBOL, symbol '%LINE 6' is not in the symbol table
DBG>
The previous messages indicate that the compiler did not generate instructions for lines 6 or 7 in this case.
%LINE line-number.statement-numberDBG> SET TRACE %LINE 38.2
DBG> SET TRACE MOD4\%LINE 27
Remember the symbol lookup conventions when specifying a line number in debugger commands. If that line number is not defined in the module where execution is paused (because it is not associated with an instruction), the debugger uses the symbol lookup conventions to locate another module where the line number is defined.
DBG> SET BREAK %LINE 23+5
3.3.1.2. Specifying Locations in Memory
To set a breakpoint or a tracepoint on a location in memory, specify its numerical address in the currently set radix. The default radix for both data entry and display is decimal for most languages.
On Alpha systems, the exceptions are BLISS, MACRO--32, and MACRO--64, which have a default radix of hexadecimal.
On Integrity server, the exceptions are BLISS, MACRO--32, and Intel Assembler.
DBG> SET BREAK 2753
DBG> SET BREAK %HEX 2753
Note that when specifying a hexadecimal number that starts with a letter rather than a number, you must add a leading 0. Otherwise, the debugger tries to interpret the entity specified as a symbol declared in your program.
For additional information about specifying radixes and about the built-in symbols %BIN, %DEC, %HEX, and %OCT, see Section 4.1.10, ''Specifying a Radix for Entering or Displaying Integer Data'' and Appendix C, "Built-In Symbols and Logical Names".
If a breakpoint or a tracepoint was set on a numerical address that corresponds to a symbol in your program, the SHOW BREAK or SHOW TRACE command identifies the breakpoint symbolically.
3.3.1.3. Obtaining and Symbolizing Memory Addresses
DBG> EVALUATE/ADDRESS SWAP
1536
DBG> EVALUATE/ADDRESS %LINE 26
1629
DBG>
DBG> EVALUATE/ADDRESS/HEX %LINE 26
0000065D
DBG>
The SYMBOLIZE command does the reverse of EVALUATE /ADDRESS. It converts a memory address into its symbolic representation (including its path name)if such a representation is possible. Chapter 5, "Controlling Access to Symbols in Your Program" explains how to control symbolization. See Section 4.1.11, ''Obtaining and Symbolizing Memory Addresses'' for more information about obtaining and symbolizing addresses.
3.3.2. Setting Breakpoints or Tracepoints on Lines or Instructions
- /LINE
- /BRANCH
- /CALL
- /INSTRUCTION
When using these qualifiers, do not specify an address expression.
DBG> SET BREAK/LINE
DBG> SET TRACE/BRANCH
Note that opcode tracing slows program execution.
DBG> SET BREAK/LINE/NOSHARE/NOSYSTEM
3.3.3. Setting Breakpoints on Emulated Instructions (Alpha Only)
On Alpha systems, to cause the debugger to suspend program execution when an instruction is emulated, use the command SET BREAK /SYSEMULATE. The syntax of the SET BREAK command when using the /SYSEMULATE qualifier is:
SET BREAK/SYSEMULATE =mask The optional argument mask is a quad word with bits set to specify
which instruction groups shall trigger breakpoints. The only emulated instruction group
currently defined consists of the BYTE and WORD instructions. Specify this instruction group by
setting bit 0 of mask to 1.
If you do not specify mask, or if
mask=FFFFFFFFFFFFFFFF, the debugger stops program execution whenever the
operating system emulates any instruction.
3.3.4. Controlling Debugger Action at Breakpoints or Tracepoints
The SET BREAK and SET TRACE commands provide several options for controlling the behavior of the debugger at breakpoints and tracepoints - the /AFTER, /[NO]SILENT, /[NO]SOURCE, and /TEMPORARY command qualifiers, and the optional WHEN and DO clauses. The following examples show several of these options.
DBG> SET BREAK/AFTER:5 %LINE 14
DBG> SET TRACE/LINE DO (EXAMINE X)
DBG> SET BREAK %LINE 27 WHEN (SUM > 100) DO (EXAMINE TEST_RESULT)
See Section 4.1.6, ''Evaluating Language Expressions'' and Section 14.3.2.2, ''Evaluating Language Expressions'' for information about evaluating language expressions like SUM > 100.
STATUS at the tracepoint:
DBG> SET TRACE/SILENT %LINE 83 DO (EXAMINE STATUS)
DBG> GO
   .
   .
   .
SCREEN_IO\CLEAR\STATUS:   OFF
   .
   .
   .
DBG> DEFINE/VALUE COUNT=0
DBG> SET TRACE/SILENT %LINE 12 DO (DEF/VAL COUNT=COUNT+1;EVAL COUNT)
Source lines are displayed by default at breakpoints, tracepoints, and watchpoints if they are available for the module being debugged. You can also control their display with the SET STEP [NO]SOURCE command and the /[NO]SOURCE qualifier of the SET BREAK, SET TRACE, and SET WATCH commands. See Chapter 6, "Controlling the Display of Source Code" for information about how to control the display of source code in general and in particular at breakpoints, tracepoints, and watchpoints.
3.3.5. Setting Breakpoints or Tracepoints on Exceptions
The SET BREAK /EXCEPTION and SET TRACE /EXCEPTION commands direct the debugger to treat any exception generated by your program as a breakpoint or tracepoint, respectively. The breakpoint or tracepoint occurs before any application-declared exception handler is invoked. See Section 14.5, ''Debugging Exceptions and Condition Handlers'' for debugging techniques associated with exceptions and condition handlers.
3.3.6. Setting Breakpoints or Tracepoints on Events
event-name qualifier. You can use this
qualifier to set breakpoints or tracepoints that are triggered by various events (denoted by
event-name keywords).Events and their keywords are currently defined for the following event facilities:ADA event facility, which defines HPE Ada tasking events. ADA events are defined in Section 16.6.4, ''Monitoring Task Events''.
THREADS event facility, which defines tasking (multithread) events for programs written in any language that uses POSIX Threads services. Threads events are defined in Section 16.6.4, ''Monitoring Task Events''.
The appropriate facility and event-name keywords are defined when the program is brought under debugger control. Use the SHOW EVENT_FACILITY command to identify the current event facility and the associated event-name keywords. The SET EVENT_FACILITY command enables you to change the event facility and change your debugging context. This is useful if you have a multilanguage program and want to debug a routine that is associated with an event facility but that facility is not currently set.
DBG> SET BREAK/EVENT=TOKEN
When a breakpoint or tracepoint is triggered, the debugger identifies the event that caused it to be triggered and gives additional information.
3.3.7. Deactivating, Activating, and Canceling Breakpoints or Tracepoints
After a breakpoint or tracepoint is set, you can deactivate it, activate it, or cancel it.
To deactivate a breakpoint or tracepoint, enter the DEACTIVATE BREAK or DEACTIVATE TRACE command. This causes the debugger to ignore the breakpoint or tracepoint during program execution. However, you can activate it at a later time, for example, when you rerun the program (see Section 1.3.3, ''Rerunning the Same Program from the Kept Debugger''). A deactivated breakpoint or tracepoint is listed as such in a SHOW BREAK display.
To activate a breakpoint or tracepoint, use the ACTIVATE BREAK or ACTIVATE TRACE command. Activating a breakpoint or tracepoint causes it to take effect during program execution.
The commands DEACTIVATE BREAK/ALL and ACTIVATE BREAK/ALL (or DEACTIVATE TRACE/ALL and ACTIVATE TRACE/ALL) operate on all breakpoints or tracepoints and are particularly useful when rerunning a program with the RERUN command.
To cancel a breakpoint or tracepoint, use the CANCEL BREAK or CANCEL TRACE command. A canceled breakpoint or tracepoint is no longer listed in a SHOW BREAK or SHOW TRACE display.
DBG> DEACTIVATE TRACE/LINE
DBG> CANCEL BREAK SWAP, MOD2\LOOP4, 2753
3.4. Monitoring Changes in Variables and Other Program Locations
The SET WATCH command enables you to specify program variables (or arbitrary memory locations) that the debugger monitors as your program executes. This process is called setting watchpoints. If, during execution, the program modifies the value of a watched variable (or memory location), the watchpoint is triggered. The debugger then suspends execution, displays information, and prompts for more commands. The debugger monitors watchpoints continuously during program execution.
Note
In some cases, when using the SET WATCH command with a variable name (or any other symbolic address expression), you might need to set a module or specify a scope or a path name. Those concepts are described in Chapter 5, "Controlling Access to Symbols in Your Program". The examples in this section assume that all modules are set and that all variable names are uniquely defined.
If your program was optimized during compilation, certain variables in the program might be removed by the compiler. If you then try to set a watchpoint on such a variable, the debugger issues a warning (see Section 1.2, ''Preparing an Executable Image for Debugging'' and Section 14.1, ''Debugging Optimized Code'').
SET WATCH[/qualifier[...]] address-expression[, ...]
[WHEN (conditional-expression)]
[DO (command[; ...])]
DBG> SET WATCH COUNT
DBG> GO
   .
   .
   .
watch of MOD2\COUNT at MOD2\%LINE 24
     24:   COUNT := COUNT + 1;
    old value: 27
    new value: 28
break at MOD2\%LINE 25
     25:   END;
DBG>Announces the event ("watch of MOD2 \COUNT …"), identifying the location of the instruction that changed the value of the watched variable ("… at MOD2 \%LINE 24")
Displays the associated source line (24)
Displays the old and new values of the variable (27 and 28)
Announces that execution is paused at the beginning of the next line ("break at MOD2 \%LINE 25")and displays that source line
Prompts for another command
DBG> SET WATCH K
DBG> GO
   .
   .
   .
watch of TEST\K at TEST\%LINE 19+5
     19:   DO 40 K = 1, J
    old value: 4
    new value: 5
break at TEST\%LINE 19+9
     19:   DO 40 K = 1, J
DBG>
In this example, the address of the instruction that modified variable K is 5 bytes beyond the beginning of line 19. The breakpoint is on the instruction that follows the instruction that modified the variable (not on the beginning of the next source line as in the preceding example).
DBG> SET WATCH ARR
DBG> GO
   .
   .
   .
watch of SUBR\ARR at SUBR\%LINE 12
    12:     ARR (3) := 28
   old value:
    (1):         7
    (2):         12
    (3):         3
    (4):         0
   new value:
    (1):         7
    (2):         12
    (3):         28
    (4):         0
break at SUBR\%LINE 13
DBG>DBG> SET WATCH CHECK[7]
To identify all of the watchpoints that are currently set, use the SHOW WATCH command.
3.4.1. Deactivating, Activating, and Canceling Watchpoints
After a watchpoint is set, you can deactivate it, activate it, or cancel it.
To deactivate a watchpoint, use the DEACTIVATE WATCH command. This causes the debugger to ignore the watchpoint during program execution. However, you can activate it at a later time, for example, when you rerun the program (see Section 1.3.3, ''Rerunning the Same Program from the Kept Debugger''). A deactivated watchpoint is listed as such in a SHOW WATCH display.
To activate a watchpoint, use the ACTIVATE WATCH command. Activating a watchpoint causes it to take effect during program execution. You can always activate a static watchpoint, but the debugger cancels a nonstatic watchpoint if execution moves out of the scope in which the variable is defined (see Section 3.4.3, ''Watching Nonstatic Variables'').
The commands DEACTIVATE WATCH/ALL and ACTIVATE WATCH/ALLoperate on all watchpoint sand are particularly useful when rerunning a program with the RERUN command.
To cancel a watchpoint, use the CANCEL WATCH command. A canceled watchpoint is no longer listed in a SHOW WATCH display.
3.4.2. Watchpoint Options
The SET WATCH command provides the same options for controlling the behavior of the debugger at watchpoints that the SET BREAK and SET TRACE commands provide for breakpoints and tracepoints - namely the /AFTER, /[NO]SILENT, /[NO]SOURCE, and /TEMPORARY qualifiers, and the optional WHEN and DO clauses. See Section 3.3.4, ''Controlling Debugger Action at Breakpoints or Tracepoints'' for examples.
3.4.3. Watching Nonstatic Variables
Note
The generic term nonstatic variable is used here to denote what is called an automatic variable in some languages.
Storage for a variable in your program is allocated either statically or nonstatically. A static variable is associated with the same memory address throughout execution of the program. A nonstatic variable is allocated on the call stack or in a register and has a value only when its defining routine is active on the call stack. As explained in this section, the technique for setting a watchpoint, the watchpoint's behavior, and the speed of program execution are different for the two kinds of variables.
   .
   .
   .
VAR
     X: [STATIC] INTEGER;
     Y: INTEGER;
   .
   .
   .
DBG> EVALUATE/ADDRESS X
512
DBG> EVALUATE/ADDRESS Y
%R0
DBG>DBG> SET WATCH Y
%DEBUG-W-SYMNOTACT, nonstatic variable 'MOD4\ROUT3\Y'
is not active
DBG>Section 3.4.3.2, ''Setting a Watchpoint on a Nonstatic Variable'' describes how to set a watchpoint on a nonstatic variable.
3.4.3.1. Execution Speed
When a watchpoint is set, the speed of program execution depends on whether the variable is static or nonstatic. To watch a static variable, the debugger write-protects the page containing the variable. If your program attempts to write to that page (modify the value of that variable), an access violation occurs and the debugger handles the exception. The debugger temporarily unprotects the page to allow the instruction to complete and then determines whether the watched variable was modified. Except when writing to that page, the program executes at full speed.
DBG> SET WATCH Y
%DEBUG-I-WPTTRACE, nonstatic watchpoint, tracing every instruction
DBG>
3.4.3.2. Setting a Watchpoint on a Nonstatic Variable
DBG> SET TRACE/NOSOURCE ROUT3 DO (SET WATCH Y)
DBG> GO
   .
   .
   .
trace at routine MOD4\ROUT3
%DEBUG-I-WPTTRACE, nonstatic watchpoint, tracing every instruction
   .
   .
   .
watch of MOD4\ROUT3\Y at MOD4\ROUT3\%LINE 16
   16:     Y := 4
   old value:    3
   new value:    4
break at MOD4\ROUT3\%LINE 17
   17:     SWAP (X, Y);
DBG>
%DEBUG-I-WATCHVAR, watched variable MOD4\ROUT3\Y has gone out of scope
%DEBUG-I-WATCHCAN, watchpoint now canceled
3.4.3.3. Options for Watching Nonstatic Variables
The SET WATCH command qualifiers /OVER, /INTO, and /[NO]STATIC provide options for watching nonstatic variables.
Step over the called routine - executing it at full speed - and resume instruction tracing after returning. This is the default (SET WATCH /OVER).
Trace instructions within the called routine, which monitors the variable instruction-by-instruction within the routine (SET WATCH /INTO).
Using the SET WATCH /OVER command results in better performance. However, if the called routine modifies the watched variable, the watchpoint is triggered only after execution returns from that routine. The SET WATCH /INTO command slows down program execution but enables you to monitor watchpoints more precisely within called routines.
The debugger determines whether a variable is static or nonstatic by looking at its address (P0 space, P1 space, or register). When entering a SET WATCH command, you can override this decision with the /[NO]STATIC qualifier. For example, if you have allocated nonstack storage in P1 space, use the SET WATCH /STATIC command to specify that a particular variable is static even though it is in P1 space. Conversely, if you have allocated your own call stack in P0 space, use the SET WATCH /NOSTATIC command to specify that a particular variable is nonstatic even though it is in P0 space.
3.4.3.4. Setting Watchpoints in Installed Writable Shareable Images
When setting a watchpoint in an installed writable shareable image, use the SET WATCH /NOSTATIC command (see Section 3.4.3.3, ''Options for Watching Nonstatic Variables'').
The reason you must set a nonstatic watchpoint is as follows. Variables declared in such shareable images are typically static variables. By default, the debugger watches a static variable by write-protecting the page containing that variable. However, the debugger cannot write-protect a page in an installed writable shareable image. Therefore, the debugger must use the slower method of detecting changes, as for nonstatic variables - that is, by checking the value at the watched location after each instruction has been executed (see Section 3.4.3.1, ''Execution Speed'').
If any other process modifies the watched location's value, the debugger may report that your program modified the watched location.
Chapter 4. Examining and Manipulating Program Data
This chapter explains how to use the EXAMINE and DEPOSIT commands to display and modify the values of symbols declared in your program as well as the contents of arbitrary program locations. The chapter also explains how to use the EVALUATE and other commands that evaluate language expressions.
General concepts related to using the EXAMINE, DEPOSIT, and EVALUATE commands.
Use of the commands with symbolic names - for example, the names of variables and routines declared in your program. Such symbolic address expressions are associated with compiler generated types.
Use of the commands with program locations (memory addresses or registers) that do not have symbolic names. Such address expressions are not associated with compiler generated types.
Specifying a type to override the type associated with an address expression.
Section 14.3, ''Debugging Multilanguage Programs'', which highlights some important language differences that you should be aware of when debugging multilanguage programs.
The debugger's online help (type HELP Language).
The documentation supplied with that language.
4.1. General Concepts
This section introduces the EXAMINE, DEPOSIT, and EVALUATE commands and discusses concepts that are common to those commands.
4.1.1. Accessing Variables While Debugging
Note
The generic term nonstatic variable is used here to denote what is called an automatic variable in some languages.
Before you try to examine or deposit into a nonstatic (stack-local or register) variable, its defining routine must be active on the call stack. That is, program execution must be paused somewhere within the defining routine. See Section 3.4.3, ''Watching Nonstatic Variables'' for more information about nonstatic variables.
You can examine a static variable at any time during program execution, and you can examine a nonstatic variable as soon as execution reaches its defining routine. However, before you examine any variable, you should execute the program beyond the point where the variable is declared and initialized. The value contained in any uninitialized variable should be considered invalid.
Many compilers optimize code to make the program run faster. If the code that you are debugging has been optimized, some program locations might not match what you would expect from looking at the source code. In particular, some optimization techniques eliminate certain variables so that you no longer have access to them while debugging.
Section 14.1, ''Debugging Optimized Code'' explains the effect of several optimization techniques on the executable code. When first debugging a program, it is best to disable optimization, if possible, with the /NOOPTIMIZE (or equivalent) compiler command qualifier.
In some cases, when using the EXAMINE or DEPOSIT command with a variable name (or any other symbolic address expression) you might need to set a module or specify a scope or a path name. Those concepts are described in Chapter 5, "Controlling Access to Symbols in Your Program". The examples in this chapter assume that all modules are set and that all variable names are uniquely defined.
4.1.2. Using the EXAMINE Command
EXAMINE address-expression[,...]
DBG>EXAMINE X
MOD3\X:   17
DBG>
When displaying the value, the debugger prefixes the variable name with its path name - in this case, the name of the module where variable X is declared (see Section 5.3.2, ''Using SHOW SYMBOL and Path Names to Specify Symbols Uniquely'').
The EXAMINE command usually displays the current value of the entity, denoted by an address expression, in the type associated with that location (for example, integer, real, array, record, and so on).
If the location has a symbolic name, the debugger formats the value according to the compiler-generated type associated with that symbol.
If the location does not have a symbolic name, the debugger formats the value in the type longword integer by default.
See Section 4.1.5, ''Address Expressions and Their Associated Types'' for more information about the types associated with symbolic and nonsymbolic address expressions.
By default, when displaying the value, the debugger identifies the address expression and its path name symbolically if symbol information is available. See Section 4.1.11, ''Obtaining and Symbolizing Memory Addresses'' for more information about symbolizing addresses.
wchar_t variable:
DBG> EXAMINE wide_buffer
TST\main\wide_buffer[0:31]: 'test data line 1................'
Note
This is a rare condition that occurs only in unusual circumstances in C++ and assembly language programs; most programs are not affected by this problem.
In this condition, you must examine the CFM register and manually adjust the EXAMINE command to account for the non-zero CFM.rrb and CFM.sor fields.
4.1.3. Using the DUMP Command
- Binary
- Byte
- Decimal
- Hexadecimal
- Longword (default)
- Octal
- Quadword
- Word
DUMP address-expression1[:address-expression2]
address-expression2 is
address-expression1. For example, the following command displays the
current value of registers R16 through R25 in quadword format.
DBG>DUMP/QUADWORD R16:R25
 0000000000000078 0000000000030038 8.......x....... %R16
 000000202020786B 0000000000030041 A.......kx   ... %R18
 0000000000030140 0000000000007800 .x......@....... %R20
 0000000000010038 0000000000000007 ........8....... %R22
 0000000000000006 0000000000000000 ................ %R24
DBG>
|
Qualifier |
Formats Output As |
|---|---|
| /BINARY |
Binary integers |
| /BYTE |
One-byte integers |
| /DECIMAL |
Decimal integers |
| /HEXADECIMAL |
Hexadecimal integers |
| /LONGWORD |
Longword integers (length 4 bytes) |
| /OCTAL |
Octal integers |
| /QUADWORD |
Quadword integers (length 8 bytes) |
| /WORD |
Word integers (length 2 bytes) |
By default, the debugger displays examined entities that do not have a compiler-generated type as longwords.
4.1.4. Using the DEPOSIT Command
DEPOSIT address-expression = language-expression
DBG>EXAMINE X
MOD3\X:   17
DBG>DEPOSIT X = 23
DBG>EXAMINE X
MOD3\X:   23
DBG>
The DEPOSIT command usually evaluates a language expression and deposits the resulting value into a program location denoted by an address expression.
It evaluates the address expression to yield a program location.
If the program location has a symbolic name, the debugger associates the location with the symbol's compiler generated type. If the location does not have a symbolic name, the debugger associates the location with the type longword integer by default (see Section 4.1.5, ''Address Expressions and Their Associated Types'').
It evaluates the language expression in the syntax of the current language and in the current radix to yield a value. This behavior is identical to that of the EVALUATE command (see Section 4.1.6, ''Evaluating Language Expressions'').
It checks that the value and type of the language expression is consistent with the type of the address expression. If you try to deposit a value that is incompatible with the type of the address expression, the debugger issues a diagnostic message. If the value is compatible, the debugger deposits the value into the location denoted by the address expression.
DBG>DEPOSIT X = 2.0
DBG>EXAMINE X
MOD3\X:   2
DBG>
In general, the debugger tries to follow the assignment rules for the current language.
4.1.5. Address Expressions and Their Associated Types
The symbols that are declared in your program (variable names, routine names, and so on) are symbolic address expressions. They denote memory addresses or registers. Symbolic address expressions (also called symbolic names in this chapter) have compiler-generated types, and the debugger knows the type and location that are associated with symbolic names. Section 4.1.11, ''Obtaining and Symbolizing Memory Addresses'' explains how to obtain memory addresses and register names from symbolic names and how to symbolize program locations.
Variables
The associated program locations contain the current values of variables. Techniques for examining and depositing into variables are described in Section 4.2, ''Examining and Depositing into Variables''.
Routines, labels, and line numbers
The associated program locations contain instructions. Techniques for examining and depositing instructions are described in Section 4.3, ''Examining and Depositing Instructions''.
DBG>EXAMINE 926
926:  749404624
DBG>
DBG>DEPOSIT 926 = 84
DBG>EXAMINE 926
926:  84
DBG>
Techniques for examining and depositing into locations that do not have a symbolic name are described in Section 4.5, ''Specifying a Type When Examining and Depositing''.
The EXAMINE and DEPOSIT commands accept type qualifiers
(/ASCII: n, /BYTE, and so on)
that enable you to override the type associated with a program location. This is useful either
if you want the contents of the location to be interpreted and displayed in another type, or if
you want to deposit some value of a particular type into a location that is associated with
another type. Techniques for overriding a type are described in Section 4.5, ''Specifying a Type When Examining and Depositing''.
4.1.6. Evaluating Language Expressions
The EVALUATE and DEPOSIT commands, which are described in this section and in Section 4.1.4, ''Using the DEPOSIT Command'', respectively
The IF, FOR, REPEAT, and WHILE commands (see Section 13.6, ''Using Control Structures to Enter Commands'')
WHEN clauses, which are used with the SET BREAK, SET TRACE, and SET WATCH commands (see Section 3.3.4, ''Controlling Debugger Action at Breakpoints or Tracepoints'')
This discussion applies to all commands and constructs that evaluate language expressions, but it focuses on using the EVALUATE command.
EVALUATE language-expression […]
DBG>EVALUATE (8+12)*6/4
30
DBG>
The debugger uses the rules of operator precedence of the current language when evaluating language expressions.
DBG>DEPOSIT X = 23
DBG>EVALUATE (X - 3) * 4
80
DBG>
However, you cannot evaluate a language expression that includes a function call. For example, if PRODUCT is a function that multiplies two integers, you cannot enter the EVALUATE PRODUCT(3, 5) command. If your program assigns the returned value of a function to a variable, you can examine the resulting value of that variable.
If an expression contains symbols with different compiler generated types, the debugger uses the type-conversion rules of the current language to evaluate the expression. If the types are incompatible, a diagnostic message is issued. Debugger support for operators and other constructs in language expressions is listed in the debugger's online help for each language (type HELP Language).
DBG>EXAMINE X
MOD3\X:  23
DBG>EVALUATE %CURVAL
23
DBG>DEPOSIT Y = 47
DBG>EVALUATE \
47
DBG>
4.1.6.1. Using Variables in Language Expressions
You can use variables in language expressions in much the same way that you use them in the source code of your program.
DBG>DEPOSIT X = 12    ! Assign the value 12 to X.
DBG>EXAMINE X         ! Display the value of X.
MOD4\X:  12
DBG>EVALUATE X        ! Evaluate and display the value of X.
12
DBG>EVALUATE X + 4    ! Add the value of X to 4.
16
DBG>DEPOSIT X = X/2   ! Divide the value of X by 2 and assign
                      ! the resulting value to X.
DBG>EXAMINE X         ! Display the new value of X.
MOD4\X:   6
DBG>DBG> EVALUATE ARR %DEBUG-W-NOVALUE, reference does not have a value DBG>
DBG>EVALUATE ARR(2)          ! Evaluate element 2 of array ARR.
37
DBG>DEPOSIT K = 5 + ARR(2)   ! Deposit the sum of two integer
DBG>                         ! values into an integer variable.
DBG>EXAMINE Y         ! Display the value of Y.
MOD4\Y:  3
DBG>EVALUATE Y        ! Display the address of Y.
02475B
DBG>EVALUATE .Y       ! Display the value of Y.
3
DBG>EVALUATE Y + 4    ! Add 4 to the address of Y and
02475F                ! display the resulting value.
DBG>EVALUATE .Y + 4   ! Add 4 to the value of Y and display
7                     ! the resulting value.
DBG>
For all languages, to obtain the address of a variable, use the EVALUATE /ADDRESS command as described in Section 4.1.11, ''Obtaining and Symbolizing Memory Addresses''. The EVALUATE and EVALUATE /ADDRESS commands both display the address of an address expression when the language is set to BLISS.
4.1.6.2. Numeric Type Conversion by the Debugger
DBG>EVALUATE 1.5 + 1
2.5
DBG>
If integer and real types are mixed, the integer type is converted to the real type.
If integer types of different sizes are mixed (for example, byte-integer and word-integer), the one with the smaller size is converted to the larger size.
If real types of different sizes are mixed (for example, S_float and T_float), the one with the smaller size is converted to the larger size.
In general, the debugger allows more numeric type conversion than the programming language. In addition, the hardware type used for a debugger calculation (word, longword, S_float, and so on) might differ from that chosen by the compiler. Because the debugger is not as strongly typed or as precise as some languages, the evaluation of an expression by the EVALUATE command might differ from the result that would be calculated by compiler-generated code and obtained with the EXAMINE command.
4.1.7. Address Expressions Compared to Language Expressions
Do not confuse address expressions with language expressions. An address expression specifies a program location; a language expression specifies a value. In particular, the EXAMINE command expects an address expression as its parameter, and the EVALUATE command expects a language expression as its parameter. These points are shown in the next examples.
DBG>DEPOSIT X = 12
DBG>EXAMINE X
MOD3\X: 12
DBG>EVALUATE X + 6
18
DBG>
DBG>EXAMINE X + 6
MOD3\X+6: 274903
DBG>
In this case the location is not associated with a compiler-generated type. Therefore, the debugger interprets and displays the value stored at that location in the type longword integer (see Section 4.1.5, ''Address Expressions and Their Associated Types'').
DBG>EXAMINE X
MOD3\X: 12
DBG>DEPOSIT X + 6 = X + 6
DBG>EXAMINE X
MOD3\X: 12
DBG>EXAMINE X + 6
MOD3\X+6: 18
DBG>
4.1.8. Specifying the Current, Previous, and Next Entity
When using the EXAMINE and DEPOSIT commands, you can use three special built-in symbols (address expressions) to refer quickly to the current, previous, and next data locations (logical entities). These are the period (.), the circumflex (^), and the Return key.
DBG>EXAMINE X
SIZE\X: 7
DBG>DEPOSIT . = 12
DBG>EXAMINE .
SIZE\X: 12
DBG>
DBG>EXAMINE ARR(5)    ! Examine element 5 of array ARR.MAIN
\ARR(5): 448670
DBG>EXAMINE ^         ! Examine the previous element (4).MAIN
\ARR(4): 792802
DBG>EXAMINE           ! Examine the next element (5).MAIN
\ARR(5): 448670
DBG>EXAMINE           ! Examine the next element (6).MAIN
\ARR(6): 891236
DBG>
The debugger uses the type associated with the current entity to determine logical successors and predecessors.
You can also use the built-in symbols %CURLOC, %PREVLOC, and %NEXTLOC to achieve the same purpose as the period, circumflex, and Return key, respectively. These symbols are useful in command procedures and also if your program uses the circumflex for other purposes. Moreover, using the Return key to signify the logical successor does not apply to all contexts. For example, you cannot press the Return key after entering the DEPOSIT command to indicate the next location, but you can always use the symbol %NEXTLOC for that purpose.
Note that, like EXAMINE and DEPOSIT, the EVALUATE /ADDRESS command also resets the values of the current, previous, and next logical-entity built-in symbols (see Section 4.1.11, ''Obtaining and Symbolizing Memory Addresses''). However, you cannot press the Return key after entering the EVALUATE /ADDRESS command to indicate the next location. For more information about debugger built-in symbols, see Appendix C, "Built-In Symbols and Logical Names".
If the address has a symbolic name (the name of a variable, component of a composite variable, routine, and so on), the debugger uses the associated compiler-generated type.
If the address does not have a symbolic name, the debugger uses the type longword integer by default.
As the current entity is reset with new examine or deposit operations, the debugger associates each new location with a type in the manner indicated to determine logical successors and predecessors. This is shown in the following examples.
ARY is an array of three word integers (2 bytes each)
FLT is an F_floating type (4 bytes)
BTE is a byte integer (1 byte)
1000: ARY(1)
1002: ARY(2)
1004: ARY(3)
1006: FLT
1010: BTE
1011: undefined
   .
   .
   .
DBG>EXAMINE 1000          ! Examine ARY(1), associated with 1000.
MOD3\ARY(1):  13          ! Current entity is now ARY(1).
DBG>EXAMINE               ! Examine next location, ARY(2),
MOD3\ARY(2):   7          ! using type of ARY(1) as reference.
DBG>EXAMINE               ! Examine next location, ARY(3).
MOD3\ARY(3):  19          ! Current entity is now ARY(3).
DBG>EXAMINE               ! Examine entity at 1006 (FLT).
MOD3\FLT:  1.9117807E+07  ! Current entity is now FLT.
DBG>EXAMINE               ! Examine entity at 1010 (BTE).
MOD3\BTE:   43            ! Current entity is now BTE.
DBG>EXAMINE               ! Examine entity at 1011 (undefined).
1011: 17694732            ! Interpret data as longword integer.
DBG>                      ! Location is not symbolized.
The same principles apply when you use type qualifiers with the EXAMINE and DEPOSIT commands (see Section 4.5.2, ''Overriding the Current Type''). The type specified by the qualifier determines the data boundary of an entity and, therefore, any logical successors and predecessors.
4.1.9. Language Dependencies and the Current Language
The debugger enables you to set your debugging context to any of several supported languages. The setting of the current language determines how the debugger parses and interprets the names, numbers, operators, and expressions you specify in debugger commands, and how it displays data.
$ PASCAL/NOOPTIMIZE/DEBUG TEST1
$ LINK/DEBUG TEST1
$ DEBUG/KEEP
           Debugger Banner and Version Number
DBG>RUN TEST1
Language: PASCAL, Module: TEST1
DBG>
When debugging modules whose code is written in other languages, you can use the SET LANGUAGE command to establish a new language-dependent context. Section 14.3, ''Debugging Multilanguage Programs'' highlights some important language differences. Debugger support for operators and other constructs in language expressions is listed for each language in the debugger's online help (type HELP Language).
4.1.10. Specifying a Radix for Entering or Displaying Integer Data
The debugger can interpret and display integer data in any one of four radixes: decimal, hexadecimal, octal, and binary. The default radix is decimal for most languages.
On Alpha systems, the exceptions are BLISS, MACRO-32 and MACRO-64, which have a default radix of hexadecimal.
Data that you specify in address expressions or language expressions
Data that is displayed by the EVALUATE and EXAMINE commands
You cannot control the radix for other kinds of integer data. For example, addresses are
always displayed in hexadecimal radix in a SHOW CALLS display. Or, when specifying an integer
n with various command qualifiers (/AFTER:
n, /UP: n, and so on), you must use
decimal radix.
DBG>SET RADIX HEXADECIMAL
After this command is executed, all integer data that you enter in address or language expressions is interpreted as being hexadecimal. Also, all integer data displayed by the EVALUATE and EXAMINE commands is given in hexadecimal radix.
DBG>SHOW RADIX
input radix: hexadecimal
output radix: hexadecimal
DBG>
The SHOW RADIX command identifies both the input radix (for data entry) and the output radix (for data display). The SET RADIX command qualifiers /INPUT and /OUTPUT enable you to specify different radixes for data entry and display. For more information, see the SET RADIX command.
Use the CANCEL RADIX command to restore the default radix.
The examples that follow show several techniques for displaying or entering integer data in another radix without changing the current radix.
DBG>SHOW RADIX
input radix: decimal
output radix: decimal
DBG>EVALUATE 18 + 5
23                         ! 23 is decimal integer.
DBG>EVALUATE/HEX 18 + 5
00000017                   ! 17 is hexadecimal integer.
DBG>
The radix qualifiers do not affect the radix for data entry.
DBG>EXAMINE X
MOD4\X: 4398                ! 4398 is a decimal integer.
DBG>EXAMINE/OCTAL .        ! X is the current entity.
MOD4\X: 00000010456         ! 10456 is an octal integer.
DBG>
DBG>SHOW RADIX
input radix: decimal
output radix: decimal
DBG>EVAL %BIN 10              ! Evaluate the binary integer 10.
2                             ! 2 is a decimal integer.
DBG>EVAL %HEX (10 + 10)       ! Evaluate the hexadecimal integer 20.
32                            ! 32 is a decimal integer.
DBG>EVAL %HEX 20 + 33         ! Treat 20 as hexadecimal, 33 as decimal.
65                            ! 65 is a decimal integer.
DBG>EVAL/HEX %OCT 4672        ! Treat 4672 as octal and display in hex.
000009BA                      ! 9BA is a hexadecimal number.
DBG>EXAMINE X + %DEC 12       ! Examine the location 12 decimal bytes
MOD3\X+12:  493847            ! beyond the address of X.
DBG>DEPOS J = %OCT 7777777    ! Deposit an octal value.
DBG>EXAMINE .                 ! Display that value in decimal radix.
MOD3\J:  2097151
DBG>EXAMINE/OCTAL .           ! Display that value in octal radix.
MOD3\J:  00007777777
DBG>EXAMINE %HEX 0A34D        ! Examine location A34D, hexadecimal.
SHARE$LIBRTL+4941:  344938193 ! 344938193 is a decimal integer.
DBG>
Note
When specifying a hexadecimal integer that starts with a letter rather than a number (for example, A34D in the last example), add a leading 0. Otherwise, the debugger tries to interpret the integer as a symbol declared in your program.
For more examples showing the use of the radix built-in symbols, see Appendix C, "Built-In Symbols and Logical Names".
4.1.11. Obtaining and Symbolizing Memory Addresses
DBG>EVALUATE/ADDRESS X       ! A variable name
2476
DBG>EVALUATE/ADDRESS SWAP    ! A routine name
1536
DBG>EVALUATE/ADDRESS %LINE 26
1629
DBG>
DBG>EVALUATE/ADDRESS/HEX X
000009AC
DBG>
DBG>EVALUATE/ADDRESS K
%R2
DBG>
Like the EXAMINE and DEPOSIT commands, EVALUATE /ADDRESS resets the values of the current, previous, and next logical-entity built-in symbols (see Section 4.1.8, ''Specifying the Current, Previous, and Next Entity'').Unlike the EVALUATE command, EVALUATE /ADDRESS does not affect the current-value built-in symbols %CURVAL and backslash (\).
DBG>SYMBOLIZE %R2
address MOD3\%R2:    MOD3\K
DBG>
DBG>EVALUATE/ADDRESS X
2476
DBG>EXAMINE 2476
MOD3\X:  16
DBG>
DBG>EVALUATE/ADDRESS K
%R2
DBG>EXAMINE %R2
MOD3\%R2:  78
DBG>
DBG>EVALUATE/ADDRESS Y
512
DBG>EXAMINE 512
MOD3\Y:  28
DBG>EXAMINE/NOSYMBOLIC 512
512:  28
DBG>
Symbolic mode also affects the display of instructions.
DBG>EXAMINE/INSTRUCTION .%PC
HELLO\main\%LINE 8: add        r34=200028, r1
DBG>EXAMINE/NOSYMBOL/INSTRUCTION .%PC
65969:              add        r34 = 200028, r1
DBG>
4.2. Examining and Depositing into Variables
The examples in this section show how to use the EXAMINE and DEPOSIT commands with variables.
Scalars (such as integer, real, character, or Boolean)
Strings
Arrays
Records
Pointers (access types)
The most important consideration when examining and manipulating variables in high-level language programs is that the debugger recognizes the names, syntax, type constraints, and scoping rules of the variables in your program. Therefore, when specifying a variable with the EXAMINE or DEPOSIT command, you use the same syntax that is used in the source code. The debugger processes and displays the data accordingly. Similarly, when assigning a value to a variable, the debugger follows the typing rules of the language. It issues a diagnostic message if you try to deposit an incompatible value. The examples in this section show some of these invalid operations and the resulting diagnostics.
When using the DEPOSIT command (or any other command), note the following behavior. If the debugger issues a diagnostic message with a severity level of I (informational), the command is still executed (the deposit is made in this case). The debugger aborts an illegal command line only when the severity level of the message is W (warning) or greater.
For additional language-specific information, seethe debugger's online help (type HELP Language).
4.2.1. Scalar Types
The following examples show use of the EXAMINE, DEPOSIT, and EVALUATE commands with some integer, real, and Boolean types.
DBG>EXAMINE WIDTH, LENGTH, AREA
SIZE\WIDTH:   4SIZE
SIZE\LENGTH:  7SIZE
SIZE\AREA:    28
DBG>
DBG>DEPOSIT WIDTH = CURRENT_WIDTH + 10
DBG>
DBG>DEPOSIT X = -14
%DEBUG-I-IVALOUTBNDS, value assigned is out of bounds at or near DEPOSIT
DBG>
DBG>DEPOSIT I = 12345
DBG>EXAMINE I
MOD3\I:  12345
DBG>DEPOSIT I = 123.45
DBG>EXAMINE I
MOD3\I:  123
DBG>
DBG>DEPOSIT Y = 2.356     ! Y is of type G_floating point.
DBG>EXAMINE Y
MOD3\Y: 2.35600000000000
DBG>EVALUATE Y + 3
5.35600000000000
DBG>DEPOSIT R = 5.35E3    ! R is of type F_floating point.
DBG>EXAMINE R
MOD3\R:  5350.000
DBG>EVALUATE R*50
   267500.0
DBG>DEPOSIT I = 22222
DBG>EVALUATE R/I
   0.2407524
DBG>
DBG>DEPOSIT WILLING = TRUE
DBG>DEPOSIT ABLE = FALSE
DBG>EVALUATE WILLING AND ABLE
False
DBG>
4.2.2. ASCII String Types
DBG>EXAMINE EMPLOYEE_NAME
PAYROLL\EMPLOYEE_NAME:    "Peter C. Lombardi"
DBG>
DBG>DEPOSIT PART_NUMBER = "WG-7619.3-84"
DBG>
%DEBUG-I-ISTRTRU, string truncated at or near DEPOSIT
If the string has fewer characters, the debugger pads the remaining characters to the right of the string by inserting ASCII space characters.
4.2.3. Array Types
You can examine an entire array aggregate, a single indexed element, or a slice (a range of elements). However, you can deposit into only one element at a time. The following examples show typical operations with arrays.
DBG>EXAMINE ARRX
MOD3\ARRX
    (1):     42
    (2):     17
    (3):    278
    (4):     56
    (5):    113
    (6):    149
DBG>DBG>EXAMINE ARRX(4) MOD3\ARRX(4): 56 DBG>
DBG>EXAMINE ARRX(2:5)
MOD3\ARRX
    (2):     17
    (3):    278
    (4):     56
    (5):    113
DBG>
In general, a range of values to be examined is denoted by two values separated by a colon (value1:value2). Depending on the language, two periods (..) can be used instead of a colon.
DBG>DEPOSIT ARRX(2) = 53
DBG>
DBG>EXAMINE REAL_ARRAY
PROG2\REAL_ARRAY
   (1, 1):       27.01000
   (1, 2):       31.00000
   (1, 3):       12.48000
   (2, 1):       15.08000
   (2, 2):       22.30000
   (2, 3):       18.73000
DBG>
DBG>DEPOSIT REAL_ARRAY(1, 4) = 26.13
%DEBUG-I-SUBOUTBND, subscript 2 is out of bounds, value is 4,
bounds are 1..3
DBG>
In the previous example, the deposit operation was executed because the diagnostic message is of I level. This means that the value of some array element adjacent to (1, 3), possibly (2, 1) might have been affected by the out-of-bounds deposit operation.
DBG>FOR I = 1 TO 4 DO (DEPOSIT COLOR_ARRAY(I) = RED)
DBG>
You can also use the built-in symbols (.) and (^)to step through array elements, as explained in Section 4.1.8, ''Specifying the Current, Previous, and Next Entity''.
4.2.4. Record Types
Note
The generic term
record is used here to denote a data structure whose elements have
heterogeneous data types - what is called a struct type in the C
language.
You can examine an entire record aggregate, a single record component, or several components. However, you can deposit into only one component at a time. The following examples show typical operations with records.
DBG>EXAMINE PART
INVENTORY\PART:
    ITEM:     "WF-1247"
    PRICE:     49.95
    IN_STOCK:  24
DBG>DBG>EXAMINE PART.IN_STOCK INVENTORY\PART.IN_STOCK: 24 DBG>
DBG>EXAMINE IN_STOCK OF PART
INVENTORY\IN_STOCK of PART:    IN_STOCK:  24
DBG>
DBG>EXAMINE PART.ITEM, PART.IN_STOCK
INVENTORY\PART.ITEM:     "WF-1247"
INVENTORY\PART.IN_STOCK:  24
DBG>
DBG>DEPOSIT PART.IN_STOCK = 17
DBG>
4.2.5. Pointer (Access) Types
You can examine the entity designated (pointed to) by a pointer variable and deposit a value into that entity. You can also examine a pointer variable.
   .
   .
   .
TYPE
     T = ^REAL;
VAR
     A : T;
   .
   .
.DBG>EXAMINE A^ MOD3\A^: 1.7 DBG>
DBG>DEPOSIT A^ = 3.9
DBG>EXAMINE A^
MOD3\A^:  3.9
DBG>
DBG>EXAMINE/HEXADECIMAL A
SAMPLE\A: 0000B2A4
DBG>
4.3. Examining and Depositing Instructions
The debugger recognizes address expressions that are associated with instructions. This enables you to examine and deposit instructions using the same basic techniques as with variables.
DBG>SET STEP INSTRUCTION
DBG>
There are other step modes that enable you to execute the program to specific kinds of instructions. You can also set breakpoints to interrupt execution at these instructions.
In addition, you can use a screen-mode instruction display (see Section 7.4.4, ''Predefined Instruction Display (INST)'') to display the actual decoded instruction stream of your program.
4.3.1. Examining Instructions
If you specify an address expression that is associated with an instruction in an EXAMINE command (for example, a line number), the debugger displays the first instruction at that location. You can then use the period (.), Return key, and circumflex (^) to display the current, next, and previous instruction (logical entity), as described in Section 4.1.8, ''Specifying the Current, Previous, and Next Entity''.
DBG>EXAMINE %LINE 12
MOD3\%LINE 12:     BIS     R31, R31, R2
DBG>EXAMINE
MOD3\%LINE 12+4:   BIS     R31, R2, R0  ! Next instruction
DBG>EXAMINE
MOD3\%LINE 12+8:   ADDL    R31, R0, R0  ! Next instruction
DBG>EXAMINE ^
MOD3\%LINE 12+4:   BIS     R31, R2, R0  ! Previous instruction
DBG>
Line numbers, routine names, and labels are symbolic address expressions that are associated with instructions. In addition, instructions might be stored in various other memory addresses and in certain registers during the execution of your program.
EXAMINE %PC displays the current PC value, namely the address of the next instruction to be executed.
EXAMINE .%PC displays the contents of that address, namely the next instruction to be executed by the program.
As shown in the previous examples, the debugger knows whether an address expression is associated with an instruction. If it is, the EXAMINE command displays that instruction (you do not need to use the /INSTRUCTION qualifier). You use the /INSTRUCTION qualifier to display the contents of an arbitrary program location as an instruction - that is, the command EXAMINE /INSTRUCTION causes the debugger to interpret and format the contents of any program location as an instruction (see Section 4.5.2, ''Overriding the Current Type'').
module TEST
     1:         .TITLE  TEST
     2:
     3: TEST$START::
     4:         .WORD   0
     5:
     6:         MOVL    #2, R2
     7:         BRB     LABEL_2
     8:
     9:         .LONG   ^X12345
    10:         .LONG   ^X14465
    11:
    12: LABEL_2:
    13:         MOVL    #5, R5
    14:
15: .END TEST$STARTDBG>EXAMINE %LINE 6 TEST\TEST$START\%LINE 6: MOVL S^#02, R2 DBG>
DBG>EXAMINE
TEST\TEST$START\%LINE 7:  BRB     TEST\TEST$START\LABEL_2
DBG>
DBG>EXAMINE
TEST\TEST$START\%LINE 7+2:  MULF3   S^#11.00000, S^#0.5625000, S^#0.5000000
DBG>EXAMINE
%DEBUG-W-ADDRESSMODE, instruction uses illegal or undefined addressing modes
TEST\TEST$START\%LINE 7+6:  MULD3   S^#0.5625000[R4], S^#0.5000000, @W^5505(R0)
DBG>EXAMINE
TEST$START+12:   HALT
DBG>
4.4. Examining and Depositing into Registers
The EXAMINE command displays contents of any register that is accessible in your program. You can use the DEPOSIT command to change the contents of these registers. The number and type of registers vary for each OpenVMS platform, as described in the following sections.
4.4.1. Examining and Depositing into Alpha Registers
|
Symbol |
Description |
|---|---|
|
Alpha Integer Registers | |
|
%R0 …%R28 |
Registers R0 …R28 |
|
%FP (%R29) |
Stack frame base register (FP) |
|
%SP (%R30) |
Stack pointer (SP) |
|
%R31 |
ReadAsZero/Sink (RZ) |
|
%PC |
Program counter (PC) |
|
%PS |
Processor status register (PS). The built-in symbols %PSL and %PSW are disabled for Alpha systems. |
|
Alpha Floating-Point Registers | |
|
%F0 …%F30 |
Registers F0 …F30 |
|
%F31 |
ReadAsZero/Sink |
You can omit the percent sign (%) prefix if your program has not declared a symbol with the same name.
You cannot deposit a value into register R30.
You cannot deposit a value into registers R31 or F31. They are permanently assigned the value 0.
There are no vector registers.
DBG>SHOW TYPE          ! Show type for locations without
type: long integer     ! a compiler-generated type.
DBG>SHOW RADIX         ! Identify current radix.
input radix: decimal
output radix: decimal
DBG>EXAMINE %R11       ! Display value in R11.
MOD3\%R11:  1024
DBG>DEPOSIT %R11 = 444 ! Deposit new value into R11.
DBG>EXAMINE %R11       ! Check new value.
R11:  444
DBG>EXAMINE %PC        ! Display value in program counter.
MOD\%PC: 1553
DBG>EXAMINE %SP        ! Display value in stack pointer.
0\%SP:  2147278720
DBG>
See Section 4.3.1, ''Examining Instructions'' for specific information about the PC.
Processor Status (Alpha Only)
On Alpha systems, the processor status (PS) is a register whose value represents a number of processor state variables. The first three bits of the PS are reserved for the use of the software. The values of these bits can be controlled by a user program. The remainder of the bits, bits 4 to 64, contain privileged information and cannot be altered by a user-mode program.
DBG>EXAMINE %PS
MOD1\%PS:
      SP_ALIGN IPL VMM   CM   IP SW
         48     0   0   USER   0  3
DBG>
See the Alpha Architecture Reference Manual for complete information about the PS, including the values of the various bits.
DBG>EXAMINE/LONG/HEX %PS
MOD1\%PS:        0000001B
DBG>EXAMINE/LONG/BIN %PS
MOD1\%PS:        00000000 00000000 00000000 00011011
DBG>
The command EXAMINE /PS displays the value at any location in PS format. This is useful for examining the combined current and saved PS values.
4.4.2. Examining and Depositing into Integrity server Registers
Up to 128 64-bit general registers
Up to 128 82-bit floating-point registers (the debugger allows you to treat these as full octawords),
Up to 64 1-bit predicate, 8 64-bit branch, and 128 (only 20 are accessible/used) application registers
Special registers (for example, %PC) and virtual registers (for example, %RETURN_PC)
|
Symbol |
Description |
|---|---|
|
Integrity server Application Registers | |
|
%KR0 …%KR7 |
Kernel registers 0 …7 |
|
%RSC (%AR16 ) |
Register Stack Configuration |
|
%BSP (%AR17 ) |
Backing Store Pointer |
|
%BSPSTORE (%AR18 ) |
Backing Store Pointer for Memory Stores |
|
%RNAT (%AR19 ) |
RSE NaT Collection |
|
%CCV ($AR32 ) |
Compare and Exchange Compare Value |
|
%UNAT (%AR36 ) |
User NaT Collection |
|
%FPSR (%AR40 ) |
Floating-point Status |
|
%PFS (%AR64 ) |
Previous Function State |
|
%LC (%AR65 ) |
Loop Count |
|
%EC (%AR66 ) |
Epilog Count |
|
%CSD |
Code Segment |
|
%SSD |
Stack Segment |
|
Control Registers | |
|
%DCR (%CR0 ) |
Default Control |
|
%ITM (%CR1 ) |
Interval Timer Match (only visible for SCD) |
|
%IVA (%CR2 ) |
Interruption Vector Address (only visible for SCD) |
|
%PTA (%CR8 ) |
Page Table Address (only visible for SCD) |
|
%PSR (%CR9, %ISPR ) |
Interruption Processor Status |
|
%ISR (%CR17 ) |
Interruption Status |
|
%IIP (%CR19 ) |
Interruption Instruction Pointer |
|
%IFA (%CR20 ) |
Interruption Faulting Address |
|
%ITIR (%CR21 ) |
Interruption TLB Insertion |
|
%IIPA (%CR22 ) |
Interruption Instruction Previous |
|
%IFS (%CR23 ) |
Interruption Function State |
|
%IIM (%CR24 ) |
Interruption Immediate |
|
%IHA (%CR25 ) |
Interruption Hash Address |
|
%LID (%CR64 ) |
Local Interrupt ID (only visible for SCD ) |
|
%TPR (%CR66 ) |
Task Priority (only visible for SCD ) |
|
%IRR0 …%IRR3 (%CR68 …%CR71 ) |
External Interrupt Request 0 …3 (only visible for SCD ) |
|
%ITV (%CR72 ) |
Interval Timer (only visible for SCD ) |
|
%PMV (%CR73 ) |
Performance Monitoring (only visible for SCD ) |
|
%CMCV (%CR74 ) |
Corrected Machine Check Vector (only visible for SCD ) |
|
%IRR0 and %IRR1 (%CR80 and %CR81 ) |
Local Redirection 0:1 (only visible for SCD ) |
|
Special Registers | |
|
%IH (%SR0 ) |
Invocation Handle |
|
%PREV_BSP |
Previous Backing Store Pointer |
|
%PC (%IP ) |
Program Counter (Instruction Pointer | slot number ) |
|
%RETURN_PC |
Return Program Counter |
|
%CFM |
Current Frame Marker |
|
%NEXT_PFS |
Next Previous Frame State |
|
%PSP |
Previous Stack Pointer |
|
%CHFCTX_ADDR |
Condition Handling Facility Context Address |
|
%OSSD |
Operating System Specific Data |
|
%HANDLER_FV |
Handler Function Value |
|
%LSDA |
Language Specific Data Area |
|
%UM |
User Mask |
|
Predicate Registers | |
|
%PR (%PRED ) |
Predicate Collection Register -- Collection of %P0 …%P63 |
|
%P0 …%P63 |
Predicate (single-bit )Registers 0 …63 |
|
Branch Registers | |
|
%RP (%B0 ) |
Return Pointer |
|
%B1 …%B7 |
Branch Registers 1 …7 |
|
General Integer Registers | |
|
%R0 |
General Integer Register 0 |
|
%GP (%R1 ) |
Global Data Pointer |
|
%R2 …%R11 |
General Integer Registers 2 …11 |
|
%SP (%R12 ) |
Stack Pointer |
|
%TP (%R13 ) |
Thread Pointer |
|
%R14 …%R24 |
General Integer Registers 14 …24 |
|
%AP (%R25 ) |
Argument Information |
|
%R26 …%R127 |
General Integer Registers 26 …127 |
|
Output Registers | |
|
%OUT0 …%OUT7 |
Output Registers, runtime aliases (i.e., If the frame has allocated output registers, then %OUT0 maps to the first allocated output registers, for example, %R38, etc.) |
|
General Registers | |
|
%GRNAT0 and %GRNAT1 |
General Register Not A Thing (NAT) collection registers 64 bits each, for example,
%GRNAT0 |
|
Floating Point Registers | |
|
%F0 …%F127 |
Floating Point Registers 0 …127 |
You can omit the percent sign (%) prefix if your program has not declared a symbol with the same name.
- You cannot deposit values into the following kinds of registers: unallocated, disabled, or unreadable registers. For example:
%R38 to %R127, if only %R32 to %R37 were allocated
%F0 (always 0.0)
%F1 (always 1.0)
%R0 (always 0)
%SP
%P0 (always 1)
%GRNAT0 and %GRNAT1
All of the special registers, except %PC
Most of the control and application registers (see below)
- For regular user mode debug and SCD, you can also deposit into registers, as follows:
Control registers %IPSR, %ISR, %IIP, %IFA, %ITIR, %IIPA, %IFS, %IIM, and %IHA for exception frames
Application registers %RSC and %CCV
- For SCD ONLY, you can also deposit into registers, as follows:
Application registers %KR0 to %KR7
Control registers %DCR, %ITM, %IVA, %PTA, %LID, %TPR, %IRR0 to %IRR3, %ITV, %PMV, %CMCV, %LRR0, and %LRR1
There are no vector registers.
Some register reads are automatically formatted. You can override this formatting, as shown in Section 4.4.1, ''Examining and Depositing into Alpha Registers''(for example, EXAMINE/QUAD/HEX %FPSR).
- For information on the Floating Point Status Register (%FPSR), see the Intel IA-64 Architecture Software Developer's Manual Volume 1. Example:
DBG> ex %fpsr
LOOPER\main\%FPSR:
        I U O Z D V TD RC PC WRE FTZ
    SF3 0 0 0 0 0 0  1  0  3   0   0
    SF2 0 0 0 0 0 0  1  0  3   0   0
    SF1 0 0 0 0 0 0  1  0  3   1   0
    SF0 0 0 0 0 0 0  0  0  3   0   0
    TRAPS ID UD OD ZD DD VD
           1  1  1  1  1  1
DBG>
You can also force this formatting on any location (see EXAMINE /FPSR).
- For information about Previous Function State (%PFS), Current Frame Maker (%CFM), Interrupt Function State (%IFS), and Next Previous Function State (%NEXT_PFS) registers, see Intel IA-64 Architecture Software Developer's Manual, Volume 1. Example:
DBG> ex %pfs
LOOPER\main\%PFS:
    PPL PEC SOF SOL SOR RRB_GR RRB_FR RRB_PR
      3   0  29  21   0      0      0      0
DBG> ex %cfm
LOOPER\main\%CFM:
    SOF SOL SOR RRB_GR RRB_FR RRB_PR
      6   5   0      0      0      0
DBG> ex %ifs
LOOPER\main\%IFS:
    SOF SOL SOR RRB_GR RRB_FR RRB_PR
      6   5   0      0      0      0
DBG> ex %next_pfs
LOOPER\main\%NEXT_PFS:
    PPL PEC SOF SOL SOR RRB_GR RRB_FR RRB_PR
      3   0   6   5   0      0      0      0
DBG>
Also see EXAMINE /PFS and EXAMINE /CFM.
- For information about the Process Status Register (%PSR), see the Intel IA-64 Architecture Software Developer's Manual, Volume 2. Example:
DBG> ex %psr
LOOPER\main\%PSR:
    IA BN ED RI SS DD DA ID IT MC IS CPL RT TB LP DB SI DI PP SP DFH DFL
     0  1  0  0  0  0  0  0  1  0  0   3  1  0  0  0  0  1  0  0   0   0
    DT PK  I IC MFH MFL AC UP BE
     1  0  1  1   1   1  0  0  0
DBG>
Also see EXAMINE /PSR.
- The debugger defaults to a bit vector format for the %GRNAT0, %GRANT1, and %PR registers. For example:
DBG> ex %grnat0, %pr
LOOPER\main\%GRNAT0:
11111111 11111111 11111111 11000000 00000000 00000000 00000000 00000000
LOOPER\main\%PR:
00000000 00000000 00000000 00000000 11111111 01010110 10010110 10100011
DBG>
- The debugger defaults to single bits for registers %p0 …%p63. For example:
DBG> ex %p6, %p7
LOOPER\main\%P6:
        0
LOOPER\main\%P7:
        1
DBG>
4.5. Specifying a Type When Examining and Depositing
The preceding sections explain how to use the EXAMINE and DEPOSIT commands with program locations that have a symbolic name and, therefore, are associated with a compiler-generated type.
Section 4.5.1, ''Defining a Type for Locations Without a Symbolic Name'' describes how the debugger formats (types) data for program locations that do not have a symbolic name and explains how you can control the type for those locations.
Section 4.5.2, ''Overriding the Current Type'' explains how to override the type associated with any program location, including a location that has a symbolic name.
4.5.1. Defining a Type for Locations Without a Symbolic Name
Program locations that do not have a symbolic name and, therefore, are not associated with a compiler-generated type have the type longword integer by default. Section 4.1.5, ''Address Expressions and Their Associated Types'' explains how to examine and deposit into such locations using the default type.
DBG>SET TYPE BYTE
DBG>SET TYPE G_FLOAT
DBG>SET TYPE ASCII:6
Note that the SET TYPE command, when used without the /OVERRIDE qualifier, does not affect the type for program locations that have a symbolic name (locations associated with a compiler-generated type).
The SHOW TYPE command identifies the current type for locations without a symbolic name. To restore the default type for such locations, enter the SET TYPE LONGWORD command.
4.5.2. Overriding the Current Type
DBG>SET TYPE/OVERRIDE BYTE
See Table 4.3, ''SET TYPE Keywords'' for the valid type keywords for the SET TYPE /OVERRIDE command.
To identify the current override type, enter the SHOW TYPE /OVERRIDE command. To cancel the current override type and restore the normal interpretation of locations that have a symbolic name, enter the CANCEL TYPE /OVERRIDE command.
The EXAMINE and DEPOSIT commands have qualifiers that enable you to override the type currently associated with a program location for the duration of the EXAMINE or DEPOSIT command. These qualifiers override any previous SET TYPE or SET TYPE/OVERRIDE command as well as any compiler-generated type. See the DEPOSIT and EXAMINE commands for the type qualifiers available to each command.
DBG>EXAMINE/BYTE           ! Type is byte integer
MOD3\%LINE 15 :  -48
DBG>EXAMINE/WORD           ! Type is word integer.
MOD3\%LINE 15 :  464
DBG>EXAMINE/LONG           ! Type is longword integer.
MOD3\%LINE 15 :  749404624
DBG>EXAMINE/QUAD           ! Type is quadword integer.
MOD3%LINE 15 :  +0130653502894178768
DBG>EXAMINE/FLOAT          ! Type is F_floating.
MOD3%LINE 15 :   1.9117807E-38
DBG>EXAMINE/G_FLOAT        ! Type is G_floating.
MOD3%LINE 15 :   1.509506018605227E-300
DBG>EXAMINE/ASCII          ! Type is ASCII string.
MOD3\%LINE 15 :  ".."
DBG>
When used with a type qualifier, the DEPOSIT command deposits a value of that type into the location specified by the address expression, which overrides the type associated with the address expression.
The remaining sections provide examples of specifying integer, string, and user-declared types with type qualifiers and the SET TYPE command.
4.5.2.1. Integer Types
DBG>SHOW TYPE           ! Show type for locations without
type:  long integer     ! a compiler-generated type.
DBG>EVALU/ADDR .        ! Current location is 724.
724
DBG>DEPO/BYTE . = 1     ! Deposit the value 1 into one byte
                        ! of memory at address 724.
DBG>EXAM .              ! By default, 4 bytes are examined.
724:  1280461057
DBG>EXAM/BYTE .         ! Examine one byte only.
724:  1
DBG>DEPO/WORD . = 2     ! Deposit the value 2 into first two
                        ! bytes (word) of current entity.
DBG>EXAM/WORD .         ! Examine a word of the current entity.
724:  2
DBG>DEPO/LONG 724 = 999 ! Deposit the value 999 into 4 bytes
                        !(a longword) beginning at address 724.
DBG>EXAM/LONG 724       ! Examine 4 bytes (longword)
724:  999               ! beginning at address 724.
DBG>
4.5.2.2. ASCII String Type
The following examples show the use of the EXAMINE and DEPOSIT
commands with the /ASCII: n type qualifier.
n into an arbitrary program location. In the example, the location
has a symbolic name (I) and, therefore, is associated with a compiler-generated integer type.
The command syntax is as follows:
DEPOSIT/ASCII:n address-expression = "ASCII string of length n"
n is 4 bytes.
DBG>DEPOSIT I = "abcde"     ! I has compiler-generated integer type.
%DEBUG-W-INVNUMBER, invalid numeric string 'abcde'
                            ! So, it cannot deposit string into I.
DBG>DEP/ASCII:5 I = "abcde" ! /ASCII qualifier overrides integer
                            ! type to deposit 5 bytes of
                            ! ASCII data.
DBG>EXAMINE                 ! Display value of I in compiler-
MOD3\I:  1146048327         ! generated integer type.
DBG>EXAM/ASCII:5            ! Display value of I as 5-byte
MOD3\I:  "abcde"            ! ASCII string.
DBG>DBG>SET TYPE/OVER ASCII:5 ! Establish ASCII:5 as override type. DBG>DEPOSIT I = "abcde" ! Can now deposit 5-byte string into I. DBG>EXAMINE I ! Display value of I as 5-byte MOD3\I: "abcde" ! ASCII string. DBG>CANCEL TYPE/OVERRIDE ! Cancel ASCII override type. DBG>EXAMINE I ! Display I in compiler-generated type. MOD3\I: 1146048327 DBG>
4.5.2.3. User-Declared Types
The following examples show the
use of the EXAMINE and DEPOSIT commands with the
/TYPE=(name) qualifier. The qualifier enables you to specify
a user-declared override type when examining or depositing.
   .
   .
   .
TYPE
    COLOR = (RED, GREEN, BLUE);
   .
   .
.DBG>SHOW SYMBOL/TYPE COLOR
data MOD3\COLOR
enumeration type (COLOR, 3 elements), size: 1 byte
DBG>DBG>EXAMINE 1000 1000: 0 DBG>
DBG>EXAMINE/TYPE=(COLOR) 1000
1000:   RED
DBG>
DBG>DEPOSIT/TYPE=(COLOR) 1000 = GREEN
DBG>EXAMINE 1000
1000:   1
DBG>
DBG>SET TYPE TYPE=(COLOR)
DBG>EXAMINE 1000
1000:   GREEN
DBG>
Chapter 5. Controlling Access to Symbols in Your Program
Symbolic debugging enables you to specify variable names, routine names, and so on, precisely as they appear in your source code. You do not need to use numeric memory addresses or registers when referring to program locations.
In addition, you can use symbols in the context that is appropriate for the program and its source language. The debugger supports the language conventions regarding data types, expressions, scope and visibility of entities, and so on.
To have full access to the symbols that are associated with your program, you must compile and link the program using the /DEBUG command qualifier.
Under these conditions, the way in which symbol information is passed from your source program to the debugger and is processed by the debugger is transparent to you in most cases. However, certain situations might require some action.
DBG>SET BREAK COUNTER
%DEBUG-E-NOSYMBOL, symbol 'COUNTER' is not in the symbol table
DBG>
You must then set the module where COUNTER is defined, as explained in Section 5.2, ''Setting and Canceling Modules''.
DBG>EXAMINE X
%DEBUG-E-NOUNIQUE, symbol 'X' is not unique
DBG>
You must then resolve the symbol ambiguity, perhaps by specifying a path name for the symbol, as explained in Section 5.3, ''Resolving Symbol Ambiguities''.
This chapter explains how to handle these and other situations related to accessing symbols in your program.
The names of entities that you have declared in your source code, such as variables, routines, labels, array elements, or record components
The names of modules (compilation units) and shareable images that are linked with your program
Elements that the debugger uses to identify source code - for example, the specifications of source files, and source line numbers as they appear in a listing file or when the debugger displays source code
The symbols you create during a debugging session with the DEFINE command are covered in Section 13.4, ''Defining Symbols for Commands, Address Expressions, and Values''.
The debugger's built-in symbols, such as the period (.) and%PC, are discussed throughout this manual in the appropriate context and are defined in Appendix C, "Built-In Symbols and Logical Names".
Note
If your program was optimized during compilation, certain variables in the program might be removed by the compiler. If you then try to reference such a variable, the debugger issues a warning (see Section 1.2, ''Preparing an Executable Image for Debugging'' and Section 14.1, ''Debugging Optimized Code'').
Before you try to reference a nonstatic (stack-local or register) variable, its defining routine must be active on the call stack. That is, program execution must be paused somewhere within the defining routine (see Section 3.4.3, ''Watching Nonstatic Variables'').
5.1. Controlling Symbol Information When Compiling and Linking
To take full advantage of symbolic debugging, you must compile and link your program with the /DEBUG qualifier as explained in Section 1.2, ''Preparing an Executable Image for Debugging''.
The following sections describe how symbol information is created and passed to the debugger when compiling and linking.
5.1.1. Compiling
When you compile a source file using the /DEBUG qualifier, the compiler creates symbol records for the debug symbol table (DST records) and includes them in the object module being created.
Data types, ranges, constraints, and scopes associated with variables
Parameter names and parameter types associated with functions and procedures
Source-line correlation records, which associate source lines with line numbers and source files
$ RUN FORMS
   .
   .
   .
%PAS-F-ERRACCFIL, error in accessing file PAS$OUTPUT
%PAS-F-ERROPECRE, error opening/creating file
%RMS-F-FNM, error in file name
%TRACE-F-TRACEBACK, symbolic stack dump follows
module name     routine name     line      rel PC      abs PC
PAS$IO_BASIC    _PAS$CODE                 00000192    00001CED
PAS$IO_BASIC    _PAS$CODE                 0000054D    000020A8
PAS$IO_BASIC    _PAS$CODE                 0000028B    00001DE6
FORMS           FORMS             59      00000020    000005A1
$
Traceback information is also used by the debugger's SHOW CALLS command.
5.1.2. Local and Global Symbols
DST records contain information about all of the symbols that are defined in your program. These are either local or global symbols.
Typically, a local symbol is a symbol that is referenced only within the module where it is defined; a global symbol is a symbol such as a routine name, procedure entry point, or a global data name, that is defined in one module but referenced in other modules.
A global symbol that is defined in a shareable image and is referenced in another image (for example the main, executable image of a program) is called a universal symbol. When creating a shareable image, you must explicitly define any universal symbols as such at link time. See Section 5.4, ''Debugging Shareable Images'' for information about universal symbols and shareable images.
Generally, the compiler resolves references to local symbols, and the linker resolves references to global symbols.
The distinction between local and global symbols is discussed in various parts of this chapter in connection with symbol lookup and with shareable images and universal symbols.
5.1.3. Linking
It builds a debug symbol table (DST) from the DST records contained in the object modules being linked. The DST is the primary source of symbol information during a debugging session.
It resolves references to global symbols and builds a global symbol table (GST). The GST duplicates some of the global symbol information already contained in the DST, but the GST is used by the debugger for symbol lookup under certain circumstances.
It puts the DST and GST in the executable image.
It sets flags in the executable image that cause the image activator to pass control to the debugger when you enter the DCL command RUN (see Section 1.2, ''Preparing an Executable Image for Debugging'').
Section 5.4, ''Debugging Shareable Images'' explains how to link shareable images for debugging, including how to define universal symbols (global symbols that are defined within a shareable image and referenced from another image).
|
Compiler Command Qualifier? |
DST Data in Object Module |
LINK Command Qualifier? |
DST Data Passed to Debugger |
GST Data Passed to Debugger? |
|---|---|---|---|---|
|
/DEBUG |
Full |
/DEBUG |
Full |
Full |
|
/DEBUG=TRACE |
Traceback only |
/DEBUG |
Traceback only |
Full |
|
/NODEBUG |
None |
/DEBUG |
None |
Full |
|
/DEBUG |
Full |
/DSF? |
Full |
Full ? |
|
/DEBUG=TRACE |
Traceback only |
/DSF ? |
Traceback only |
Full ? |
|
/NODEBUG |
None |
/DSF ? |
None |
Full ? |
|
/DEBUG |
Full |
/TRACE ? |
Traceback only |
Full |
|
/DEBUG=TRACE |
Traceback only |
/TRACE |
Traceback only |
Full |
|
/NODEBUG |
None |
/TRACE |
None |
Full |
|
/DEBUG |
Full |
/NOTRACE ? | ||
%DEBUG-I-NOLOCALS, image does not contain local symbols
The previous message, which occurs whether you linked with the /TRACEBACK or /DEBUG qualifier, indicates that no DST has been created for that image. Therefore, you have access only to global symbols contained in the GST.
%DEBUG-I-NOGLOBALS, some or all global symbols not accessible
The previous message indicates that the only global symbol information available during the debugging session is stored in the DST.
These concepts are discussed in later sections. In particular, see Section 5.4, ''Debugging Shareable Images'' for additional information related to debugging shareable images.
5.1.4. Controlling Symbol Information in Debugged Images
Symbol records occupy space within the executable image. After you debug your program, you might want to link it again without using the /DEBUG qualifier to make the executable image smaller. This creates an image with only traceback data in the DST and with a GST.
The LINK /NOTRACEBACK command enables you to secure the contents of an image from users after it has been debugged. Use this command for images that are to be installed with privileges (see the VSI OpenVMS System Manager's Manual, Volume 1: Essentials and the VSI OpenVMS System Management Utilities Reference Manual, Volume I: A–L). When you use the /NOTRACEBACK qualifier with the LINK command, no symbolic information (including traceback data) is passed to the image.
5.1.5. Creating Separate Symbol Files (Alpha Only)
.DSF.
For example:
$ CC/DEBUG/NOOPTIMIZE TESTPROGRAM.C
$ LINK/DSF TESTPROGRAM
$ DEFINE DBG$IMAGE_DSF_PATH SYS$DISK:[]
$ DEBUG/KEEP TESTPROGRAM
Compiles
TESTPROGRAM.CCreates
TESTPROGRAM.EXEandTESTPROGRAM.DSFDefines logical name DBG$IMAGE_DSF_PATH as the current directory
Invokes the kept debugger
.DSF files allow you to deliver executable files without symbol
tables to customers, but retain separate .DSF files for future
debugging needs. Note
For ease of debugging, use the /NOOPTIMIZE qualifier (if possible) when compiling the program. See Section 14.1, ''Debugging Optimized Code'' for information about debugging optimized code.
.DSF) file
requires the following: The name of the
.DSFfile must match the name of the.EXEfile being debugged.You must define DBG$IMAGE_DSF_PATH to point to the directory that contains the
.DSFfile.
See the VSI OpenVMS Linker Utility Manual for more information about using the /DSF qualifier.
5.2. Setting and Canceling Modules
DBG>EXAMINE X
%DEBUG-E-NOSYMBOL, symbol 'X' is not in the symbol table
DBG>
This section explains module setting, and the conditions under which you might need to set or cancel a module, using the SET MODULE and CANCEL MODULE commands.
When you compile and link your program using the /DEBUG command qualifier, as explained in Section 5.1, ''Controlling Symbol Information When Compiling and Linking'', complete symbol information is passed from the program's source code to its executable image.
Symbol information is contained in the debug symbol table (DST) and global symbol table (GST) within the executable image. The DST contains detailed information about local and global symbols. The GST duplicates some of the global symbol information contained in the DST.
To facilitate symbol searches, the debugger loads symbol information from the DST and GST into a run-time symbol table (RST), which is structured for efficient symbol lookup. Unless symbol information is in the RST, the debugger does not recognize or properly interpret the associated symbol.
Because the RST takes up memory, the debugger loads it dynamically, anticipating what symbols you might want to reference in the course of program execution. The loading process is called module setting, because all symbol information for a given module is loaded into the RST at one time.
When your program is brought under debugger control, all GST records are loaded into the RST, because global symbols must be accessible throughout the debugging session. Also, the debugger sets the module that contains the main program (the routine specified by the image transfer address, where execution is paused at the start of a debugging session). You then have access to all global symbols and to any local symbols that should be visible within the main program.
%DEBUG-I-DYNMODSET, setting module MOD4
DBG>EXAMINE X
%DEBUG-E-NOSYMBOL, symbol 'X' is not in the symbol table
DBG>SET MODULE MOD3
DBG>EXAMINE X
MOD3\ROUT2\X: 26
DBG>
The SHOW MODULE command lists the modules of your program and identifies which modules are set.
When a module is set, the debugger automatically allocates memory as needed by the RST. This can eventually slow down the debugger as more modules are set. If performance becomes a problem, you can use the CANCEL MODULE command to reduce the number of set modules, which automatically releases memory. Or you can disable dynamic mode by entering the SET MODE NODYNAMIC command. When dynamic mode is disabled, the debugger does not set modules automatically. Use the SHOW MODE command to determine whether dynamic mode is enabled or disabled.
For additional information about module setting specific to Ada programs, seethe debugger's online help (type Help Language_Support_Ada).
Section 5.4, ''Debugging Shareable Images'' explains how to set images and modules when debugging shareable images.
5.3. Resolving Symbol Ambiguities
Symbol ambiguities can occur when a symbol (for example, a variable name X)is defined in more than one routine or other program unit.
In most cases, the debugger resolves symbol ambiguities automatically, by using the scope and visibility rules of the currently set language and the ordering of routine calls on the call stack, as explained in Section 5.3.1, ''Symbol Lookup Conventions''.
- It might not be able to determine the particular declaration of the symbol that you intended. For example:
DBG>EXAMINE X
%DEBUG-W-NOUNIQUE, symbol 'X' is not unique
DBG>
It might reference the declaration that is visible in the current scope, which may not be the one you want.
DBG>EXAMINE COUNTER\X
COUNTER\X: 14
DBG>
The following sections discuss scope concepts and explain how to resolve symbol ambiguities.
5.3.1. Symbol Lookup Conventions
This section explains how the debugger searches for symbols, resolving most potential symbol ambiguities using the scope and visibility rules of the programming language and also its own rules. Section 5.3.2, ''Using SHOW SYMBOL and Path Names to Specify Symbols Uniquely'' and Section 5.3.3, ''Using SET SCOPE to Specify a Symbol Search Scope'' describe supplementary techniques that you can use when necessary.
You can specify symbols in debugger commands by using either a path name or the exact symbol.
If you use a path name, the debugger looks for the symbol in the scope denoted by the pathname prefix (see Section 5.3.2, ''Using SHOW SYMBOL and Path Names to Specify Symbols Uniquely'').
If you do not specify a pathname prefix, by default, the debugger searches the run-time symbol table (RST) as explained in the following paragraphs (you can modify this default behavior with the SET SCOPE command as explained in Section 5.3.3, ''Using SET SCOPE to Specify a Symbol Search Scope'').
First, the debugger looks for symbols in the PC scope (also known as scope 0), according to the scope and visibility rules of the currently set language. This means that, typically, the debugger first looks within the block or routine surrounding the current PC value (where execution is currently paused). If the symbol is not found, the debugger searches the nesting program unit, then its nesting unit, and so on. The precise manner, which depends on the language, ensures that the correct declaration of a symbol that is defined multiple times is chosen.
However, you can reference symbols throughout your program, not just those that are visible in the PC scope as defined by the language. This is necessary so you can set breakpoints in arbitrary areas, examine arbitrary variables, and so on. Therefore, if the symbol is not visible in the PC scope, the debugger continues searching as follows.
After the PC scope, the debugger searches the scope of the calling routine (if any),
then its caller, and so on. Symbolically, the complete scope search
list is denoted (0, 1, 2, …, n), where 0 denotes the
PC scope and n is the number of calls on the call stack. Within each
scope (call frame), the debugger uses the visibility rules of the language to locate a
symbol.
This search list, based on the call stack, enables the debugger to differentiate symbols that are defined multiple times in a convenient, predictable way.
%DEBUG-W-NOUNIQUE, symbol 'Y' is not unique
If you have used a SET SCOPE command to modify the default symbol search behavior, you can restore the default behavior with the CANCEL SCOPE command.
5.3.2. Using SHOW SYMBOL and Path Names to Specify Symbols Uniquely
DBG>EXAMINE COUNT
%DEBUG-W-NOUNIQUE, symbol 'COUNT' is not unique
DBG>SHOW SYMBOL COUNT
data MOD7\ROUT3\BLOCK1\COUNT
data MOD4\ROUT2\COUNT
routine MOD2\ROUT1\ROUT3\COUNT
DBG>EXAMINE MOD4\ROUT2\COUNT
MOD4\ROUT2\COUNT: 12
DBG>
The command SHOW SYMBOL COUNT lists all declarations of the symbol COUNT that exist in the RST. The first two declarations of COUNT are variables (data). The last declaration listed is a routine. Each declaration is shown with its pathname prefix, which indicates the path (search scope) the debugger must follow to reach that particular declaration. For example, MOD4 \ROUT2 \COUNT denotes the declaration of the symbol COUNT in routine ROUT2 of module MOD4.
The pathname format is as follows. The leftmost element of a path name identifies the module containing the symbol. Moving toward the right, the path name lists the successively nested routines and blocks that lead to the particular declaration of the symbol (which is the rightmost element).
The debugger always displays symbols with their path names, but you need to use path names in debugger commands only to resolve an ambiguity.
DBG>SET BREAK QUEUE_MANAGER\%LINE 26
DBG>SHOW SYMBOL X
data ALPHA\X                ! global X
data ALPHA\BETA\X           ! local X
data X (global)             ! same as ALPHA\X
DBG>
In the case of a shareable image, its global symbols are universal symbols and the SHOW SYMBOL command identifies universal symbols twice (see Section 5.1.2, ''Local and Global Symbols'' and Section 5.4, ''Debugging Shareable Images'').
5.3.2.1. Simplifying Path Names
Abbreviate a path name
Define a brief symbol for a path name
Set a new search scope so you do not have to use a path name
To abbreviate a path name, delete the names of nesting program units starting from the left, but leave enough of the path name to specify it uniquely. For example, ROUT3 \COUNT is a valid abbreviated pathname for the routine in the first example of Section 5.3.2, ''Using SHOW SYMBOL and Path Names to Specify Symbols Uniquely''.
DBG>DEFINE INTX = INT_STACK\CHECK\X
DBG>EXAMINE INTX
To set a new search scope, use the SET SCOPE command, which is described in Section 5.3.3, ''Using SET SCOPE to Specify a Symbol Search Scope''.
5.3.2.2. Specifying Symbols in Routines on the Call Stack
You can use a numeric path name to specify the scope associated with a routine on the call stack (as identified in a SHOW CALLS display). The pathname prefix "0 \ " denotes the PC scope, the pathname prefix "1 \ " denotes scope 1 (the scope of the caller routine), and so on.
DBG>EXAMINE 0\Y
DBG>EXAMINE 2
By default, the EXAMINE Y command signifies EXAMINE 0 \Y.
See the SET SCOPE/CURRENT command description in Section 5.3.3, ''Using SET SCOPE to Specify a Symbol Search Scope''. That command enables you to reset the reference for the default scope search list relative to the call stack.
5.3.2.3. Specifying Global Symbols
DBG>EXAMINE \X
5.3.2.4. Specifying Routine Invocations
When a routine is called recursively, you might need to distinguish among several calls to the same routine, all of which generate new symbols with identical names.
DBG>EXAMINE PROG\COMPUTE 0\SUM
To refer to the variable SUM that was generated in the previous call to COMPUTE, express the path name with a 1 in place of the 0.
When you do not include an invocation number, the debugger assumes that the reference is to the most recent call to the routine (the default invocation number is 0).
See the SET SCOPE/CURRENT command description in Section 5.3.3, ''Using SET SCOPE to Specify a Symbol Search Scope''. That command enables you to reset the reference for the default scope search list relative to the call stack.
5.3.3. Using SET SCOPE to Specify a Symbol Search Scope
By default, the debugger looks up symbols that you specify without a pathname prefix by using the scope search list described in Section 5.3.1, ''Symbol Lookup Conventions''.
The SET SCOPE command enables you to establish a new scope for symbol lookup so that you do not have to use a path name when referencing symbols in that scope.
DBG>EXAMINE Y
%DEBUG-E-NOUNIQUE, symbol 'Y' is not unique
DBG>SHOW SYMBOL Y
data MOD7\ROUT3\BLOCK1\Y
data MOD4\ROUT2\Y
DBG>SET SCOPE MOD4\ROUT2
DBG>EXAMINE Y
MOD4\ROUT2\Y: 12
DBG>
After you enter a SET SCOPE command, the debugger applies the pathname you specified in the command to all references that are not individually qualified with path names.
DBG>SET SCOPE 3
DBG>SET SCOPE 0, MOD4\ROUT2
DBG>SET SCOPE 0, 1, 2, 3,
…, n
Here the debugger searches successively down the call stack to find a symbol.
n:DBG>SET SCOPE/CURRENT 2
To display the current scope search list for symbol lookup, use the SHOW SCOPE command. To restore the default scope search list (see Section 5.3.1, ''Symbol Lookup Conventions''), use the CANCEL SCOPE command.
5.4. Debugging Shareable Images
By default, your program might be linked with several
HPE-supplied shareable
images (for example, the run-time library image
LIBRTL.EXE). This section explains how to extend the concepts described
in the previous sections when debugging user-defined shareable images.
A shareable image is not intended to be directly executed. A shareable image must first be included as input in the linking of an executable image, and then the shareable image is loaded at run time when the executable image is run. You do not have to install a shareable image to debug it. Instead, you can debug your own private copy by assigning a logical name to it.
See the VSI OpenVMS Linker Utility Manual for detailed information about linking shareable images.
5.4.1. Compiling and Linking Shareable Images for Debugging
Compile the source files for the main image and for the shareable image, by using the /DEBUG qualifier.
Link the shareable image with the /SHAREABLE and /DEBUG command qualifiers and declare any universal symbols for that image. (A universal symbol is a global symbol that is defined in a shareable image and referenced in another image.)
Link the shareable image against the main image by specifying the shareable image with the /SHAREABLE file qualifier as a linker option. Also specify the /DEBUG command qualifier.
Define a logical name to point to the local copy of the shareable image. You must specify the device and directory as well as the image name. Otherwise the image activator looks for an image of that name in the system default shareable image library directory, SYS$SHARE.
Bring the main image under debugger control. The shareable image is loaded at run time.
These steps are shown next with a simple example. In the example, MAIN.FOR and SUB1.FOR are the source files for the main (executable) image; SHR1.FOR and SHR2.FOR are the source files for the shareable image to be debugged.
$ FORTRAN/NOOPT/DEBUG MAIN, SUB1
$ FORTRAN/NOOPT/DEBUG SHR1, SHR2
SYMBOL_VECTOR
option to create the shareable image and specify any universal symbols. For example:
$ LINK/SHAREABLE/DEBUG SHR1, SHR2, SYS$INPUT:/OPTIONS
SYMBOL_VECTOR=(SHR_ROUT=PROCEDURE)
Ctrl/Z The /SHAREABLE command qualifier creates the shareable image
SHR1.EXEfrom the object filesSHR1.OBJandSHR2.OBJ.The /OPTIONS qualifier appended to SYS$INPUT: enables you to specify the universal symbol
SHR_ROUT.The /DEBUG qualifier builds a debug symbol table (DST) and a global symbol table (GST) for
SHR1.EXEand puts them in that image. The GST contains the universal symbolSHR_ROUT.
SHR1.EXE in your current
default directory. Because SHR1.EXE is a shareable image, you do not
execute it explicitly. Instead you link SHR1.EXE against the main
(executable) image:
$ LINK/DEBUG MAIN, SUB1, SYS$INPUT:/OPTIONS
SHR1.EXE/SHAREABLE Ctrl/Z
$The LINK command creates the executable image
MAIN.EXEfromMAIN.OBJandSUB1.OBJ.The /DEBUG qualifier builds a DST and a GST for
MAIN.EXEand puts them in that image.The /SHAREABLE qualifier appended to
SHR1.EXEspecifies thatSHR1.EXEis to be linked againstMAIN.EXEas a shareable image.
MAIN.EXE, any shareable
images linked against it are loaded at run time. However, by default, the image activator
looks for shareable images in the system default shareable image library directory,
SYS$SHARE. Therefore, you must define the logical name SHR1 to
point to SHR1.EXE in your current default directory. Be sure to specify
the device and directory:
$ DEFINE SHR1 SYS$DISK:[]SHR1.EXE
5.4.2. Accessing Symbols in Shareable Images
All the concepts covered in Section 5.1, ''Controlling Symbol Information When Compiling and Linking'', Section 5.2, ''Setting and Canceling Modules'', and Section 5.3, ''Resolving Symbol Ambiguities'' apply to the modules of a single image, namely the main (executable) image. This section provides additional information that is specific to debugging shareable images.
When you link shareable images for debugging as explained in Section 5.4.1, ''Compiling and Linking Shareable Images for Debugging'', the linker builds a DST and a GST for each image. The GST for a shareable image contains only universal symbols. To conserve memory, the debugger builds an RST for an image only when that image is set, either dynamically by the debugger or when you use a SET IMAGE command.
The SHOW IMAGE command identifies all shareable images that are linked with your program, shows which images are set, and identifies the current image (see Section 5.4.2.2, ''Accessing Symbols in Arbitrary Images'' for a definition of the current image). Only the main image is set initially when you bring the program under debugger control.
The following sections explain how the debugger sets images dynamically during program execution and how you can access symbols in arbitrary images independently of execution.
See Section 3.4.3.4, ''Setting Watchpoints in Installed Writable Shareable Images'' for information about setting watch points in installed writable shareable images.
5.4.2.1. Accessing Symbols in the PC Scope (Dynamic Mode)
By default, dynamic mode is enabled. Therefore, whenever the debugger interrupts execution, the debugger sets the image and module where execution is paused, if they are not already set.
You can reference symbols defined in all set modules in the image where execution is paused.
You can reference any universal symbols in the GST for that image.
By setting other modules in that image with the SET MODULE command, you can reference any symbol defined in the image.
After an image is set, it remains set until you cancel it with the CANCEL IMAGE command. If the debugger slows down as more images and modules are set, use the CANCEL IMAGE command. You can also enter the SET MODE NODYNAMIC command to disable dynamic mode.
5.4.2.2. Accessing Symbols in Arbitrary Images
- DEFINE/ADDRESS
- DEFINE/VALUE
- DEPOSIT
- EVALUATE
- EXAMINE
- TYPE
- (SET, CANCEL) BREAK
- (SET, SHOW, CANCEL) MODULE
- (SET, CANCEL) TRACE
- (SET, CANCEL) WATCH
- SHOW SYMBOL
Note that the SHOW BREAK, SHOW TRACE, and SHOW WATCH commands identify any breakpoints, tracepoints, or watchpoints that have been set in all images.
To reference a symbol in another image, use the SET IMAGE command to make the specified image the current image, then use the SET MODULE command to set the module where that symbol is defined (the SET IMAGE command does not set any modules). The following sample program shows these concepts.
The sample program consists of a main image PROG1 and a shareable image SHR1. Assume that you have just brought the program under debugger control and that execution is paused within the main program unit in image PROG1. Assume that you want to set a breakpoint on routine ROUT2, which is defined in some module in image SHR1.
DBG>SET BREAK ROUT2
%DEBUG-E-NOSYMBOL, symbol 'ROUT2' is not in symbol table
DBG>
DBG>SHOW IMAGE
 image name           set    base address    end address
*PROG1                yes    00000200        000009FF
 SHR1                 no     00001000        00001FFF
 total images: 2           bytes allocated: 32856
DBG>SET IMAGE SHR1
DBG>SHOW IMAGE
 image name           set    base address    end address
 PROG1                yes    00000200        000009FF
*SHR1                 yes    00001000        00001FFF
 total images: 2           bytes allocated: 41948
DBG>
DBG>SET BREAK ROUT2
%DEBUG-E-NOSYMBOL, symbol 'ROUT2' is not in symbol table
DBG>SET MODULE/ALL
DBG>SET BREAK ROUT2
DBG>GO
break at routine ROUT210:     SUBROUTINE ROUT2(A, B)
DBG>
Now that you have set image SHR1 and all its modules and have reached the breakpoint at ROUT2, you can debug using the normal method (for example, step through the routine, examine variables, and so on).
After you have set an image and set modules within that image, the image and modules remain set even if you establish a new current image. However, you have access to symbols only in the current image at any one time.
5.4.2.3. Accessing Universal Symbols in Run-Time Libraries and System Images
The following paragraphs describe how to access a universal symbol (such as a routine name) in a run-time library or other shareable image for which no symbol-table information was generated. With this information you can, for example, use the CALL command to execute a run-time library or system service routine as explained in Section 13.7, ''Calling Routines Independently of Program Execution''.
SET MODULE SHARE$image-nameDBG>SET MODULE SHARE$LIBRTL
The debugger creates dummy modules for each shareable image in your program. The names of these shareable image modules have the prefix SHARE$. The command SHOW MODULE /SHARE identifies these shareable image modules as well as the modules in the current image.
DBG>SHOW SYMBOL * IN SHARE$LIBRTL
   .
   .
   .
routine SHARE$LIBRTL\STR$APPEND
routine SHARE$LIBRTL\STR$DIVIDE
routine SHARE$LIBRTL\STR$ROUND
   .
   .
   .
routine SHARE$LIBRTL\LIB$WAIT
routine SHARE$LIBRTL\LIB$GETDVI
   .
   .
   .
You can then specify these universal symbols with, for example, the CALL or SET BREAK command.
Setting a shareable image module with the SET MODULE command loads the universal symbols for that image into the run-time symbol table so that you can reference these symbols from the current image. However, you cannot reference other (local or global) symbols in that image from the current image. That is, your debugging context remains set to the current image.
5.4.3. Debugging Resident Images (Alpha Only)
- Compile the shareable image. For example:
$ CC/DEBUG/NOOPTIMIZE RESIDENTMODULE.C
- Link the shareable image using the /DSF qualifier. For example:
$ LINK/NOTRACEBACK/SHAREABLE/SECTION_BINDING/DSF RESIDENTMODULE
See the VSI OpenVMS Linker Utility Manual for information about linking the image.
Create the installed resident image. See VSI OpenVMS System Management Utilities Reference Manual, Volume I: A–L for information about using the Install utility. See VSI OpenVMS System Manager's Manual, Volume 2: Tuning, Monitoring, and Complex Systems for information about resident images.
- Compile the program that calls the resident image. For example:
$ CC/DEBUG/NOOPTIMIZE TESTPROGRAM
- Create the executable image that calls the resident image. For example:
$ LINK/DSF TESTPROGRAM
- Create a private copy of the resident image. For example:
$ COPY SYS$LIBRARY:RESIDENTMODULE.EXE []RESIDENTMODULE.EXE
- Define a logical name that points to the private copy of the resident image. For example:
$ DEFINE RESIDENTMODULE []RESIDENTMODULE
Make sure that the
.DSFfile for the test program and the.DSFfile for the resident module both reside in the same directory.Define DBG$IMAGE_DSF_PATH to point to the directory that contains the
.DSFfiles.- Invoke the debugger. For example:
$ DEBUG/KEEP TESTPROGRAM
You should now have access to all debugging options for the executable and resident images.
Chapter 6. Controlling the Display of Source Code
The term source code refers to statements in a programming language as they appear in a source file. Each line of source code is also called a source line.
Obtaining information about source files and source lines
Specifying the location of a source file that has been moved to another directory after it was compiled
Displaying source lines by specifying line numbers, code address expressions, or search strings
Controlling the display of source code at breakpoints, tracepoints, and watchpoints and after a STEP command has been executed
Using the SET MARGINS command to improve the display of source lines under certain circumstances
The techniques described in this chapter apply to screen mode as well as line (no screen) mode. Any difference in behavior between line mode and screen mode is identified in this chapter and in the descriptions of the commands discussed. (Screen mode is described in Chapter 7, "Screen Mode".)
If your program has been optimized by the compiler, the code that is executing as you debug might not always match your source code. See Section 14.1, ''Debugging Optimized Code'' for more information.
6.1. How the Debugger Obtains Source Code Information
When a compiler processes source files to generate object modules, it assigns a line number to each source line sequentially. For most languages, each compilation unit (module) starts with line 1. For other languages like Ada, each source file, which might represent several compilation units, starts with line 1.
Line numbers appear in a source listing obtained with the /LIST compile-command qualifier. They also appear whenever the debugger displays source code, either in line mode or screen mode. Moreover, you can specify line numbers with several debugger commands (for example, TYPE and SET BREAK).
The debugger displays source lines only if you have specified the /DEBUG command with both the compile command and the LINK command. Under these conditions, the symbol information created by the compiler and passed to the debug symbol table (DST) includes source-line correlation records. Fora given module, source-line correlation records contain the full file specification of each source file that contributes to that module. In addition, they associate source records (symbols, types, and so on) with source files and line numbers in the module.
6.2. Specifying the Location of Source Files
%DEBUG-W-UNAOPNSRC, unable to open source file DISK:[JONES.WORK]PRG.FOR;2
In such cases, use the SET SOURCE command to direct the debugger to the new directory. The command can be applied to all source files for your program or to only the source files for specific modules.
WORK$:[JONES.PROG3]:
DBG> SET SOURCE WORK$:[JONES.PROG3]
WORK$:[JONES.PROG3]:
DBG> SET SOURCE [], WORK$:[JONES.PROG3]
module-name qualifier and specify
that module. For example, the following command line specifies that the source files for
module SCREEN_IO are in the directory DISK2:[SMITH.SHARE] (the
search of source files for other modules is not affected by this
command):DBG> SET SOURCE/MODULE=SCREEN_IO DISK2:[SMITH.SHARE]
To summarize, the SET SOURCE /MODULE command specifies the location of source files for a particular module, but the SET SOURCE command specifies the location of source files for modules that were not mentioned explicitly in SET SOURCE /MODULE commands.
When you enter a SET SOURCE command, be aware that one of the two qualifiers, /LATEST or /EXACT, will always be active. The /LATEST qualifier directs the debugger to search for the latest version of your source files (the highest-numbered version in your directory). The /EXACT qualifier, the default, directs the debugger to search for the version last compiled (the version recorded in the debugger symbol table created at compile time). For example, a SET SOURCE /LATEST command might search for SORT.FOR;3 while a SET SOURCE /EXACT command might search for SORT.FOR;1.
DBG> SET SOURCE [PROJA], [PROJB], USER$:[PETER.PROJC]
DBG> SET SOURCE/MODULE=COBOLTEST [], DISK$2:[PROJD]
DBG> SHOW SOURCE
source directory search list for COBOLTEST:
        []
        DISK$2:[PROJD]
source directory search list for all other modules:
        [PROJA]
        [PROJB]
        USER$:[PETER.PROJC]
DBG>
If no SET SOURCE or SET SOURCE/MODULE command has been entered, the SHOW SOURCE command indicates that no search list is currently in effect.
Use the CANCEL SOURCE command to cancel the effect of a previous SET SOURCE command. Use the CANCEL SOURCE /MODULE command to cancel the effect of a previous SET SOURCE /MODULE command (specifying the same module name).
When a source directory search list has been canceled, the debugger again expects the source files corresponding to the designated modules to be in the same directories they were in at compile time.
For more information about how the debugger locates source files that have been moved to another directory after compile time, see the SET SOURCE command.
6.3. Displaying Source Code by Specifying Line Numbers
The TYPE command enables you to display source lines by specifying compiler-assigned line numbers, where each line number designates a line of source code.
DBG> TYPE 160, 22:24
module COBOLTEST
   160: START-IT-PARA.
module COBOLTEST
    22: 02      SC2V2   PIC S99V99      COMP VALUE  22.33.
    23: 02      SC2V2N  PIC S99V99      COMP VALUE -22.33.
    24: 02      CPP2    PIC PP99        COMP VALUE  0.0012.
DBG>
You can display all the source lines of a module by specifying a range of line numbers starting from 1 and ending at a number equal to or greater than the largest line number in the module.
DBG> TYPE 160
module COBOLTEST
   160: START-IT-PARA.
DBG> TYPE
module COBOLTEST
   161:         MOVE SC1 TO ES0.
DBG>
You can then display the next line and successive lines by entering the TYPE command repeatedly, which lets you read through your code one line at a time.
DBG> TYPE TEST\16
If you specify a module name with the TYPE command, the module must be set. Use the SHOW MODULE command to determine whether a particular module is set. Then use the SET MODULE command, if necessary (see Section 5.2, ''Setting and Canceling Modules'').
If you do not specify a module name with the TYPE command, the debugger displays source lines for the module in which execution is currently paused by default - that is, the module associated with the PC scope. If you have specified another scope with the SET SCOPE command, the debugger displays source lines in the module associated with the specified scope.
In screen mode, the output of a TYPE command updates the current source display (see Section 7.2.6, ''SOURCE Display Kind'').
After displaying source lines at various locations in your program, you can redisplay the line at which execution is currently paused by pressing KP5.
6.4. Displaying Source Code by Specifying Code Address Expressions
A line number associated with one or more instructions
A label
A routine name
The memory address of an instruction
You cannot specify a variable name with the EXAMINE /SOURCE command, because a variable name is associated with data, not with instructions.
When you use the EXAMINE /SOURCE command, the debugger evaluates the address expression to obtain a memory address, determines which compiler-assigned line number corresponds to that address, and then displays the source line designated by the line number.
DBG> EXAMINE/SOURCE SWAP
module MAIN
    47:  procedure SWAP(X, Y: in out INTEGER) is
DBG>DBG> EXAMINE/SOURCE %LINE 6 %DEBUG-I-LINEINFO, no line 6, previous line is 5, next line is 8 %DEBUG-E-NOSYMBOL, symbol '%LINE 6' is not in the symbol table DBG>
When using the EXAMINE /SOURCE command with a symbolic address expression (a line number, label, or routine), you might need to set the module in which the entity is defined, unless that module is already set. Use the SHOW MODULE command to determine whether a particular module is set. Then, if necessary, use the SET MODULE command (see Section 5.2, ''Setting and Canceling Modules'').
DBG> EXAMINE/SOURCE .%PC
module COBOLTEST
   162:         DISPLAY ES0.
DBG>
DBG> EXAMINE/SOURCE %PC
%DEBUG-W-NOSRCLIN, no source line for address 7FFF005C
DBG>
DBG> EXAMINE/SOURCE .1\%PC
In screen mode, the output of an EXAMINE /SOURCE command updates the current source display (see Section 7.2.6, ''SOURCE Display Kind'').
The debugger uses the EXAMINE /SOURCE command in the following contexts to display source code at the current PC value.
EXAMINE/SOURCE .%SOURCE_SCOPE\%PC; EXAMINE/INST .%INST_SCOPE\%PC
This command sequence displays the source line and the instruction at which execution is currently paused in the current scope. Pressing KP5 enables you to quickly determine your debugging context.
EXAMINE/SOURCE .%SOURCE_SCOPE\%PC
6.5. Displaying Source Code by Searching for Strings
The SEARCH command enables you to display any source lines that contain an occurrence of a specified string.
SEARCH[/qualifier[, ...]] [range] [string]
The range parameter can be a module name, a range of line numbers, or a combination of both. If you do not specify a module name, the debugger uses the current scope to find source lines, as with the TYPE command (see Section 6.3, ''Displaying Source Code by Specifying Line Numbers'').
DBG> SEARCH SCREEN_IO pro
The remaining examples use source lines from one COBOL module, in the current scope, to show various aspects of the SEARCH command.
DBG> SEARCH/ALL 40:50 D
module COBOLTEST
    40: 02      D2N     COMP-2 VALUE -234560000000.
    41: 02      D       COMP-2 VALUE  222222.33.
    42: 02      DN      COMP-2 VALUE -222222.333333.
    47: 02      DR0     COMP-2 VALUE  0.1.
    48: 02      DR5     COMP-2 VALUE  0.000001.
    49: 02      DR10    COMP-2 VALUE  0.00000000001.
    50: 02      DR15    COMP-2 VALUE  0.0000000000000001.
DBG>DBG> SEARCH 42:50 D
module COBOLTEST
42: 02 DN COMP-2 VALUE -222222.333333.
DBG> SEARCH
module COBOLTEST
47: 02 DR0 COMP-2 VALUE 0.1.
DBG>By default, the debugger searches for a string as specified and does not interpret the context surrounding an occurrence of the string (this is the behavior of SEARCH /STRING).If you want to locate an occurrence of a string that is an identifier in your program (for example, a variable name) and exclude other occurrences of the string, use the /IDENTIFIER qualifier. The command SEARCH /IDENTIFIER displays only those occurrences of the string that are bounded on either side by a character that cannot be part of an identifier in the current language.
6.6. Controlling Source Display After Stepping and at Event points
By default, the debugger displays the associated source line when a breakpoint, tracepoint, or watchpoint is triggered and upon the completion of a STEP command.
DBG> STEP
stepped to MAIN\%LINE 16
    16:        RANGE := 500;
DBG>DBG> SET BREAK SWAP
DBG> GO
.
.
.
break at MAIN\SWAP
47: procedure SWAP(X, Y: in out INTEGER) is
DBG>When a watchpoint is triggered, the debugger displays the source line corresponding to the instruction that caused the watch point to be triggered.
DBG> SET STEP NOSOURCE
DBG> STEP
stepped to MAIN\%LINE 16
DBG> SET BREAK SWAP
DBG> GO
   .
   .
   .
break at MAIN\SWAP
DBG>
You can selectively override the effect of a SET STEP SOURCE command or a SET STEP NOSOURCE command by using the qualifiers /SOURCE and /NOSOURCE with the STEP, SET BREAK, SET TRACE, and SET WATCH commands.
DBG> SET STEP NOSOURCE
DBG> STEP/SOURCE
stepped to MAIN\%LINE
 16    16:        RANGE := 500;
DBG>
DBG> SET STEP SOURCE
DBG> SET BREAK/NOSOURCE SWAP
DBG> GO
   .
   .
   .
break at MAIN\SWAP
DBG>
6.7. Setting Margins for Source Display
The SET MARGINS command enables you to specify the leftmost and rightmost source-line character positions at which to begin and end the display of a source line (respectively, the left and right margins). This is useful for controlling the display of source code when, for example, the code is deeply indented or long lines wrap at the right margin. In such cases, you can set the left margin to eliminate indented space in the source display, and you can decrease the right margin setting to truncate lines and prevent them from wrapping.
DBG> SET MARGINS 20:35
Subsequently, only that portion of the source code that is between columns 20 and 35 is displayed when you enter commands that display source lines (for example, TYPE, SEARCH, STEP). Use the SHOW MARGINS command to identify the current margin settings for the display of source lines.
Note that the SET MARGINS command affects only the display of source lines. It does not affect the display of other debugger output (for example, output from an EXAMINE command).
The SET MARGINS command is useful mostly in line (no screen) mode. In screen mode, the SET MARGINS command has no effect on the display of source lines in a source display, such as the predefined display SRC.
Chapter 7. Screen Mode
Screen mode is an enhancement to the command line interface of the OpenVMS debugger that enables you to simultaneously display separate groups of data about the debugging session, in a manner similar to that available with the VSI DECwindows Motif for OpenVMS user interface (see Part III,''DECwindows Interface''). For example, you can display source code in one portion of the screen, register contents in a different portion, debugger output in another portion, and so on.
Note
Note that you cannot enter screen mode from within the VSI DECwindows Motif for OpenVMS interface to the debugger.
Screen mode output is best displayed on VT-series terminals with higher numbers than VT52, and on workstations running VWS. The larger screen of workstations is particularly suitable to using a number of displays for different purposes.
Screen mode concepts and terminology used throughout the chapter
Using different kinds of displays
Directing debugger output to different displays by assigning display attributes
Using predefined displays SRC, OUT, PROMPT, INST, REG, IREG, and FREG (Alpha only), which are automatically available when you enter screen mode
Scrolling, hiding, deleting, moving, and resizing a display
Creating a new display
Specifying a display window
Creating a display configuration
Saving the current state of screen displays
Changing your terminal screen's height and width during a debugging session and the effect on display windows
Using screen-related debugger built-in symbols
Using predefined windows
Enabling country-specific features for screen mode
Note
This chapter provides information common to programs that run in one or several processes. See Chapter 15, "Debugging Multiprocess Programs" for additional information specific to multiprocess programs.
7.1. Concepts and Terminology
A display is a group of text lines. The text can be lines from a source file, assembly-language instructions, the values contained in registers, your input to the debugger, debugger output, or program input and output.
You view a display through its display window, which can occupy any rectangular area of the screen. Because a display window is typically smaller than the associated display, you can scroll the display window up, down, right, and left across the display text to view any part of the display.
Figure 7.1, ''Default Screen Mode Display Configuration'' is an example of screen mode that shows three display windows. The name of each display (SRC, OUT, and PROMPT) appears at the top left corner of its display window. The display name serves both as a tag on the display itself and as a name for future reference in commands.
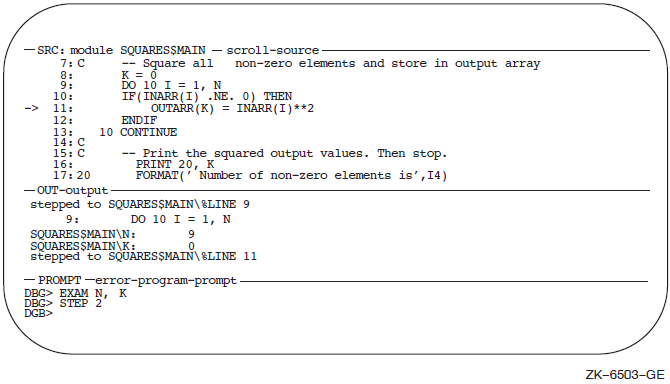 |
Figure 7.1, ''Default Screen Mode Display Configuration'' is the default display configuration established when you first invoke screen mode. SRC, OUT, and PROMPT are three of the predefined displays that the debugger provides when you enter screen mode (see Section 7.4, ''Predefined Displays'').You can modify the configuration of these displays as well as create additional displays.
SRC is a source-code display that occupies the upper half of the screen(it displays Fortran code in Figure 7.1, ''Default Screen Mode Display Configuration''). The name of the source module displayed, SQUARES$MAIN, is to the right of the display name.
OUT, located in a window directly below SRC, shows the output of debugger commands.
PROMPT, at the bottom of the screen, shows the debugger prompt and debugger input.
Conceptually, displays are placed on the screen as on a pasteboard. The display most recently referenced by a command is put on top of the pasteboard by default. Therefore, depending on their screen locations, display windows that you have referenced recently might overlay or hide other display windows.
The debugger maintains a display list, which is the pasting order of displays. Several keypad key definitions use the display list to cycle through the displays currently on the pasteboard.
Every display belongs to a display kind (see Section 7.2, ''Display Kinds''). The display kind determines what type of information the display can capture and display, such as source code, or debugger output. The display kind defines whether displayed data is paged into the memory buffer or discarded when the memory buffer over flows. The display kind also determines how the contents of the display are generated.
Some displays are automatically updated. Their definition includes a command list that is executed whenever the debugger gains control from the program. The output of the command list forms the contents of those displays. Display SRC belongs to that category: it is automatically updated so that an arrow points to the source line at which execution is currently paused.
Other displays, for example, display OUT, are updated in response to commands you enter interactively. For a display of this type to be updated, it must first be assigned an appropriate display attribute (with the SELECT command). The display attribute identifies the display as the target display for one or more types of output (see Section 7.3, ''Display Attributes'').
The names of any attributes assigned to a display appear to the right of the display name, in lowercase letters. In Figure 7.1, ''Default Screen Mode Display Configuration'', SRC has the source and scroll attributes (SRC is the current source display and the current scrolling display), OUT has the output attribute (it is the current output display), and so on. Note that, although SRC is automatically updated by its own built-in command, it can also receive the output of certain interactive commands (such as EXAMINE /SOURCE) because it has the source attribute.
The concepts introduced in this section are developed in more detail in the rest of this chapter.
7.2. Display Kinds
Every display has a display kind. The display kind determines the type of information a display contains, how that information is generated, and whether the memory buffer associated with the display is paged.
- DO (
command[, ...]) - INSTRUCTION
- INSTRUCTION (
command) - OUTPUT
- REGISTER
- SOURCE
- SOURCE (
command)
The contents of a register display are generated and updated automatically by the debugger. The contents of other kinds of displays are generated by commands, and these display kinds fall into two general groups.
- DO (
command[, ...]) - INSTRUCTION (
command) - REGISTER
- SOURCE (
command)
The command list specified is executed each time the debugger gains control from your program, if the display is not marked as removed. The output of the commands forms the new contents of the display. If the display is marked as removed, the debugger does not execute the command list until you view that display (marking that display as unremoved).
- INSTRUCTION
- OUTPUT
- SOURCE
To direct debugger output to a specific display in this group, you must first select it with the SELECT command. The technique is explained in the following sections and in Section 7.3, ''Display Attributes''. After a display is selected for a certain type of output, the output from your commands forms the contents of the display.
7.2.1. DO (Command[; …]) Display Kind
A DO display is an automatically-updated display. The commands in the command list are executed in the order listed each time the debugger gains control from your program. Their output forms the contents of the display and erases any previous contents.
DBG> DISPLAY CALLS AT Q3 DO (SHOW CALLS)
DBG> DISPLAY V2_DISP AT RQ2 DO (EXAMINE %V2(4:7))
The default size of the memory buffer associated with any DO display is 64 lines. When the memory buffer is full, the oldest lines are discarded to make room for new text. You can use the DISPLAY /SIZE command to change the buffer size.
7.2.2. INSTRUCTION Display Kind
An instruction display shows the output of an EXAMINE /INSTRUCTION command within the instruction stream of a routine. Because the instructions displayed are decoded from the image being debugged and show the exact code that is executing, this kind of display is particularly useful in helping you debug optimized code (see Section 14.1, ''Debugging Optimized Code'').
In the display, one line is devoted to each instruction. Source-line numbers corresponding to the instructions are displayed in the left column. The instruction at the location being examined is centered in the display and is marked by an arrow in the left column.
Before anything can be written to an instruction display, you must select it as the current instruction display with the SELECT /INSTRUCTION command.
DBG> DISPLAY INST2 AT RH1 INSTRUCTION
DBG> SELECT/INSTRUCTION INST2
DBG> EXAMINE/INSTRUCTION X
Each subsequent EXAMINE /INSTRUCTION command updates the display.
The default size of the memory buffer associated with any instruction display is 64 lines;however, you can scroll back and forth to view all the instructions within the routine. You can use the DISPLAY /SIZE command to change the buffer size and improve performance.
7.2.3. INSTRUCTION (Command) Display Kind
This is an instruction display that is automatically updated with the out put of the command specified. That command, which must be an EXAMINE /INSTRUCTION command, is executed each time the debugger gains control from your program.
DBG> DISPLAY INST3 AT RS45 INSTRUCT (EX/INST .%INST_SCOPE\%PC)
This command creates a display that functions like the predefined display INST. The built-in EXAMINE/INSTRUCTION command displays the instruction at the current PC value in the current scope(see Section 7.4.4, ''Predefined Instruction Display (INST)'').
If an automatically updated instruction display is selected as the current instruction display, it is updated like a simple instruction display by an interactive EXAMINE /INSTRUCTION command (in addition to being updated by its built-in command).
The default size of the memory buffer associated with any instruction display is 64 lines; however, you can scroll back and forth to view all the instructions within the routine. You can use the DISPLAY /SIZE command to change the buffer size and improve performance.
7.2.4. OUTPUT Display Kind
An output display shows any debugger output that is not directed to another display. New output is appended to the previous contents of the display.
Before anything can be written to an output display, it must be selected as the current output display with the SELECT /OUTPUT command, or as the current error display with the SELECT /ERROR command, or as the current input display with the SELECT /INPUT command. See Section 7.3, ''Display Attributes'' for more information about using the SELECT command with output displays.
DBG> DISPLAY OUT2 AT T2 OUTPUT
DBG> SELECT/OUTPUT OUT2
The output of a SHOW CALLS command goes to OUT2.
If no instruction display has been selected as the current instruction display, the output of an EXAMINE /INSTRUCTION command goes to OUT2.
By default, debugger diagnostic messages are directed to the PROMPT display. They can be directed to OUT2 with the SELECT /ERROR command.
The default size of the memory buffer associated with any output display is 64 lines. When the memory buffer is full, the oldest lines are discarded to make room for new text. You can use the DISPLAY /SIZE command to change the buffer size.
7.2.5. REGISTER Display Kind
A register display is an automatically updated display that shows the current values, in hexadecimal format, of the processor registers and as many of the top call-stack values as will fit in the display.
The register values displayed are for the routine in which execution is currently paused. The values are updated whenever the debugger takes control. Any changed values are highlighted.
|
Display |
Alpha |
Intel Itanium |
|---|---|---|
|
REG |
|
|
|
IREG |
The data is shown in hexadecimal format. |
The data is shown in hexadecimal format. |
|
FREG |
The data is shown in floating-point format. |
The register data is shown in the format consistent with the data value (integer or floating-point); the stack values are shown in floating-point format. |
On Alpha systems, the predefined display REG contains, in hexadecimal format, general-purpose registers R0 to R28, FP (R29), SP (R30), R31, PC, PS floating-point registers F0 to F31, FPCR, SFPCR, and as many of the top call-stack values as will fit in the display.
On Alpha systems, the predefined display IREG contains, in hexadecimal format, general-purpose registers R0 to R28, FP, and as many of the top call-stack values as can be displayed in the window.
On Alpha systems, the predefined display FREG contains floating-point registers F0 to F31, FPCR, SFPCR, displayed in floating-point format and as many of the top call-stack values (in hexadecimal format) as can be displayed in the window.
The default size of the memory buffer associated with any register display is 64 lines. When the memory buffer is full, the oldest lines are discarded to make room for new text. You can use the DISPLAY /SIZE command to change the buffer size.
7.2.6. SOURCE Display Kind
A source display shows the output of a TYPE or EXAMINE /SOURCE command within the source code of a module, if that source code is available. Source line numbers are displayed in the left column. The source line that is the output of the command is centered in the display and is marked by an arrow in the left column. If a range of lines is specified with the TYPE command, the lines are centered in the display, but no arrow is shown.
Before anything can be written to a source display, you must select it as the current source display with the SELECT /SOURCE command.
DBG> DISPLAY SRC2 AT Q2 SOURCE
DBG> SELECT/SOURCE SRC2
DBG> TYPE 34
Each subsequent TYPE or EXAMINE /SOURCE command updates the display.
The default size of the memory buffer of a source display is 64 lines. The memory buffer of a source display is paged, enabling you to scroll back and forth through the entire source module or routine. You can use the DISPLAY /SIZE command to change the buffer size to improve performance.
7.2.7. SOURCE (Command) Display Kind
This is a source display that is automatically updated with the output of the command specified. That command, which must be an EXAMINE /SOURCE or TYPE command, is executed each time the debugger gains control from your program.
DBG> DISPLAY SRC3 AT RS45 SOURCE (EX/SOURCE .%SOURCE_SCOPE\%PC)
This command creates a display that functions like the predefined display SRC. The built-in EXAMINE /SOURCE command displays the source line for the current PC value in the current scope(see Section 7.4.1, ''Predefined Source Display (SRC)'').
If you select an automatically updated source display as the current source display, it displays the output generated by an interactive EXAMINE /SOURCE or TYPE command in addition to the output generated by its built-in command.
The default size of the memory buffer of a source display is 64 lines. The memory buffer of an automatically updated source display is paged, enabling you to scroll back and forth through the entire source module or routine. You can use the DISPLAY /SIZE command to change the buffer size to improve performance.
7.2.8. PROGRAM Display Kind
A program display can receive the output of the program being debugged. The predefined PROMPT display belongs to the program display kind, and is the only display permitted of that kind. You cannot create a new display of the program display kind.
To avoid possible confusion, the PROMPT display has several restrictions (see Section 7.4.3, ''Predefined Prompt Display (PROMPT)'').
7.3. Display Attributes
In screen mode, the output from commands you enter interactively is directed to various displays according to the type of output and the display attributes assigned to these displays. For example, debugger diagnostic messages go to the display that has the error attribute (the current error display). By assigning one or more attributes to a display, you can mix or isolate different kinds of information.
- error
- input
- instruction
- output
- program
- prompt
- scroll
- source
When a display is assigned an attribute, the name of that attribute appears in lowercase letters on the top border of its window to the right of the display name. Note that the scroll attribute does not affect debugger output but is used to control the default display for the SCROLL, MOVE, and EXPAND commands.
SRC has the source and scroll attributes
OUT has the output attribute
PROMPT has the prompt, program, and error attributes
DBG> DISPLAY ZIP OUTPUT
DBG> SELECT/OUTPUT ZIP
| SELECT Qualifier | Apply to Display Kind | Description |
|---|---|---|
| /ERROR | Selects the specified display as the current error display. Directs any subsequent debugger diagnostic message to that display. If no display is specified, selects the PROMPT display as the current error display. | |
| /INPUT | Selects the specified display as the current input display. Echoes any subsequent debugger input in that display. If no display is specified, unselects the current input display: debugger input is not echoed to any display. | |
| /INSTRUCTION | Selects the specified display as the current instruction display. Directs the output of any subsequent EXAMINE /INSTRUCTION command to that display. Keypad key sequence PF4 COMMA selects the next instruction display in the display list as the current instruction display. If no display is specified, unselects the current instruction display: no display has the instruction attribute. | |
| /OUTPUT | Selects the specified display as the current output display. Directs any subsequent debugger output to that display, except where a particular type of output is being directed to another display (such as diagnostic messages going to the current error display). Keypad key sequence PF1 KP3 selects the next output display in the display list as the current output display. If no display is specified, selects the PROMPT display as the current output display. | |
| /PROGRAM | Selects the specified display as the current program display. Tries to force any subsequent program input or output to that display. If no display is specified, unselects the current program display: program input and output are no longer forced to the PROMPT display. | |
| /PROMPT | Selects the specified display as the current prompt display where the debugger prompts for input. You cannot unselect the PROMPT display. | |
| /SCROLL | Selects the specified display as the current scrolling display. Makes that display the default display for any subsequent SCROLL, MOVE, or EXPAND command. You can specify any display (however, note that the PROMPT display cannot be scrolled). The /SCROLL qualifier is the default if you do not specify a qualifier with the SELECT command. Key KP3 selects as the current scrolling display the next display in the display list after the current scrolling display. If no display is specified, unselects the current scrolling display: no display has the scroll attribute. | |
| /SOURCE | Selects the specified display as the current source display. Directs the output of any subsequent TYPE or EXAMINE/SOURCE command to that display. Keypad key sequence PF4 KP3 selects the next source display in the display list as the current source display. If no display is specified, unselects the current source display: no display has the source attribute. |
DBG> SELECT/INPUT/ERROR/SCROLL ZIP
To identify the displays currently selected for each of the display attributes, use the SHOW SELECT command.
If you use the SELECT command with a particular qualifier but without specifying a display name, the effect is typically to deassign that attribute (to unselect the display that had the attribute). The exact effect depends on the attribute, as described in the preceding table.
7.4. Predefined Displays
- SRC, the predefined source display
- OUT, the predefined output display
- PROMPT, the predefined prompt display
- INST, the predefined instruction display
- REG, the predefined register display
- FREG, the predefined floating-point register display (Alpha only)
- IREG, the predefined integer register display
When you enter screen mode, the debugger puts SRC in the top half of the screen, PROMPT in the bottom sixth, and OUT between SRC and PROMPT, as shown in Figure 7.1, ''Default Screen Mode Display Configuration''. Displays INST, REG, FREG (Alpha only), and IREG are initially removed from the screen by default.
To re-create this default configuration, press BLUE MINUS on the keypad (PF4 followed by the MINUS (-) key).
The basic features of the predefined displays are described in the next sections. As explained in other parts of this chapter, you can change certain characteristics of these displays, such as the buffer size or display attributes. You can also create additional displays similar to the predefined displays.
To display summary information about the characteristics of any display, use the SHOW DISPLAY command.
| Display Name | Display Kind | Valid Display Attributes | Visible on Startup |
|---|---|---|---|
| SRC | Source |
|
X |
| OUT | Output |
|
X |
| PROMPT | Output |
|
X |
| INST | Instruction |
| |
| REG | Register | Scroll | |
| FREG (Alpha only) | Register | Scroll | |
| IREG | Register | Scroll |
7.4.1. Predefined Source Display (SRC)
Note
See Chapter 6, "Controlling the Display of Source Code" for information about how to make source code available for display during a debugging session.
The predefined display SRC (see Figure 7.1, ''Default Screen Mode Display Configuration'') is an automatically updated source display.
By default, SRC automatically displays the source code for the module in which execution is currently paused. This enables you to quickly determine your current debugging context.
In addition, because SRC has the source attribute by default, you can use it to display the source code for any part of your program as explained in Section 7.4.1.1, ''Displaying Source Code in Arbitrary Program Locations''.
The name of the module whose source code is displayed is shown at the right of the display name, SRC. The numbers displayed at the left of the source code are the compiler-generated line numbers, as they might appear in a compiler-generated listing file.
As you execute the program under debugger control, SRC is automatically updated whenever execution is paused. The arrow in the left most column indicates the source line to be executed next. Specifically, execution is paused at the first instruction associated with that source line. Thus, the line indicated by the arrow corresponds to the current program counter (PC) value. The PC is a register that contains the memory address of the next instruction to be executed.
%DEBUG-I-SOURCESCOPE, Source lines not available for .0\%PC.
        Displaying source in a caller of the current routine.
Figure 7.2, ''Screen Mode Source Display When Source Code Is Not Available'' shows this feature. The source display shows that a call to routine TYPE is currently active. TYPE corresponds to a Fortran run-time library procedure. No source code is available for that routine, so the debugger displays the source code of the calling routine. The output of a SHOW CALLS command, shown in the output display, identifies the routine where execution is paused and the call sequence leading to that routine.
In such cases, the arrow in the source window identifies the line to which execution returns after the routine call. Depending on the source language and coding style, this might be the line that contains the call state mentor the next line.
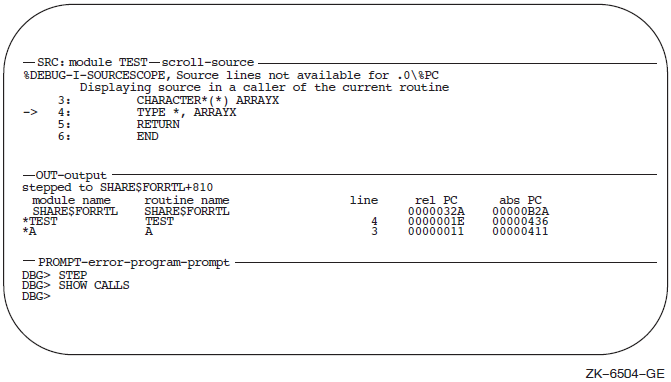 |
If your program was optimized during compilation, the source code displayed in SRC might not always represent the code that is actually executing. The predefined instruction display INST is useful in such cases, because its hows the exact instructions that are executing (see Section 7.4.4, ''Predefined Instruction Display (INST)'').
By default %SOURCE_SCOPE denotes scope 0, which is the scope of the routine where execution is currently paused.
If you have reset the scope search list relative to the call stack by means of the SET SCOPE /CURRENT command (see Section 7.4.1.2, ''Displaying Source Code for a Routine on the Call Stack''), %SOURCE_SCOPE denotes the current scope specified (the scope of the routine at the start of the search list).
If source code is not available for the routine in the current scope, %SOURCE_SCOPE denotes scope
n, wherenis the first level down the call stack for which source code is available.
7.4.1.1. Displaying Source Code in Arbitrary Program Locations
You can scroll through the entire source display by pressing KP2 (scroll down) or KP8 (scroll up) as explained in Section 7.5.1, ''Scrolling a Display''. This enables you to view any of the source code within the module in which execution is paused.
You can display the source code for any routine that is currently on the call stack by using the SET SCOPE /CURRENT command (see Section 7.4.1.2, ''Displaying Source Code for a Routine on the Call Stack'').
- Because SRC has the source attribute, you can display source code throughout your program by using the TYPE and EXAMINE /SOURCE commands:
To display arbitrary source lines, use the TYPE command (see Section 6.3, ''Displaying Source Code by Specifying Line Numbers'').
To display the source line associated with a code location (for example, a routine declaration), use the EXAMINE /SOURCE command (see Section 6.4, ''Displaying Source Code by Specifying Code Address Expressions'').
When using the TYPE or EXAMINE /SOURCE command, make sure that the module in which you want to view source code is set first. Use the SHOW MODULE command to determine whether a particular module is set. Then use the SET MODULE command, if necessary (see Section 5.2, ''Setting and Canceling Modules'').
After manipulating the contents of display SRC, you can redisplay the location at which execution is currently paused (the default behavior of SRC) by pressing KP5.
7.4.1.2. Displaying Source Code for a Routine on the Call Stack
DBG> SET SCOPE/CURRENT 1
To reset the default scope for displaying source code, enter the command CANCEL SCOPE. The command causes display SRC to show the source code for the routine at the top of the call stack where execution is paused.
7.4.2. Predefined Output Display (OUT)
Figure 7.1, ''Default Screen Mode Display Configuration'' and Figure 7.2, ''Screen Mode Source Display When Source Code Is Not Available'' show some typical debugger output in the predefined display OUT.
Display OUT is a general-purpose output display. By default, OUT has the output attribute so it displays any debugger output that is not directed to the source display SRC or the instruction display INST. For example, if display INST is not displayed or does not have the instruction attribute, any output that would otherwise update display INST is shown in display OUT.
By default, OUT does not display debugger diagnostic messages (these appear in the PROMPT display). You can assign display attributes to OUT so that it captures debugger input and diagnostics as well as normal output (see Section 7.3, ''Display Attributes'').
By default, the memory buffer associated with predefined display OUT contains 100 lines.
7.4.3. Predefined Prompt Display (PROMPT)
The predefined display PROMPT is the display in which the debugger prompts for input. Figure 7.1, ''Default Screen Mode Display Configuration'' and Figure 7.2, ''Screen Mode Source Display When Source Code Is Not Available'' show PROMPT in its default location, the bottom sixth of the screen.
By default, PROMPT has the prompt attribute. In addition, PROMPT also has (by default) the program and error attributes, which force program output and diagnostic messages to that display.
The PROMPT display window is always fully visible. You cannot hide PROMPT (with the DISPLAY /HIDE command), remove PROMPT from the pasteboard (with the DISPLAY /REMOVE command), or delete PROMPT (with the CANCEL DISPLAY command).
You can assign PROMPT the scroll attribute so that it receives the output of the MOVE and EXPAND commands. However, you cannot scroll through the PROMPT display.
The PROMPT display window always occupies the full width of the screen, beginning in the first column.
You can move PROMPT vertically anywhere on the screen, expand it to fill the full screen height, or contract it down to two lines.
The debugger alerts you if you try to move or expand a display such that it is hidden by PROMPT.
7.4.4. Predefined Instruction Display (INST)
Note
By default, the predefined instruction display INST is not shown on the screen and does not have the instruction attribute (see Section 7.4.4.1, ''Displaying the Instruction Display'' and Section 7.4.4.2, ''Displaying Instructions in Arbitrary Program Locations'').
Display INST is an automatically updated instruction display. It shows the decoded instruction stream of your program. This is the exact code that is executing, including the effects of any compiler optimization.
A VAX example is shown in Figure 7.3, ''Screen Mode Instruction Display (VAX Example)''.
This type of display is useful when debugging code that has been optimized. In such cases some of the code being executed might not match the source code that is shown in a source display. See Section 14.1, ''Debugging Optimized Code'' for information about the effects of optimization.
By default, INST automatically displays the decoded instructions for the routine in which execution is currently paused. This enables you to quickly determine your current debugging context.
In addition, if INST has the instruction attribute, you can use it to display the decoded instructions for any part of your program as explained in Section 7.4.4.2, ''Displaying Instructions in Arbitrary Program Locations''.
The name of the routine whose instructions are displayed is shown at the right of the display name, INST. The numbers displayed at the left of the instructions are the compiler-generated source line numbers.
As you execute the program under debugger control, INST is updated automatically whenever execution is paused. The arrow in the leftmost column points to the instruction at which execution is paused. This is the instruction that will be executed next and whose address is the current PC value.
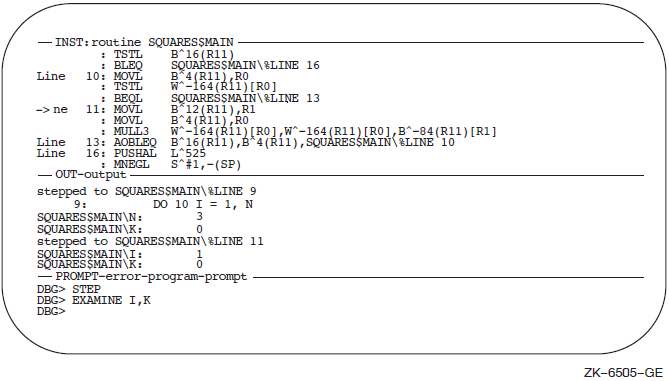 |
By default %INST_SCOPE denotes scope 0, which is the scope of the routine where execution is currently paused.
If you have reset the scope search list relative to the call stack by means of the SET SCOPE /CURRENT command (see Section 7.4.4.3, ''Displaying Instructions for a Routine on the Call Stack''), %INST_SCOPE denotes the current scope specified (the scope of the routine at the start of the search list).
7.4.4.1. Displaying the Instruction Display
Press KP7 to place displays SRC and INST side by side. This enables you to compare the source code and the decoded instruction stream.
Press PF1 KP7 to place displays INST and REG side by side.
Enter the DISPLAY INST command to place INST in its default or most recently defined location (see Section 7.5.2, ''Showing, Hiding, Removing, and Canceling a Display'').
7.4.4.2. Displaying Instructions in Arbitrary Program Locations
You can scroll through the entire instruction display by pressingKP2 (scroll down) or KP8 (scroll up) as explained in Section 7.5.1, ''Scrolling a Display''. This enables you to view any instruction within the routine in which execution is paused.
You can display the instruction stream for any routine that is currently on the call stack by using the SET SCOPE/CURRENT command (see Section 7.4.4.3, ''Displaying Instructions for a Routine on the Call Stack'').
- If INST has the instruction attribute, you can display the instructions for any code location throughout your program by using the EXAMINE/INSTRUCTION command as follows:
To assign INST the instruction attribute, use the SELECT/INSTRUCTION INST command (see Section 7.2.2, ''INSTRUCTION Display Kind'' and Section 7.3, ''Display Attributes''). Note that the instruction attribute is automatically assigned to INST when you display it by pressing either KP7 or PF1 KP7.
To display the instructions associated with a code location (for example, a routine declaration), use the EXAMINE/INSTRUCTION command (see Section 4.3.1, ''Examining Instructions'').
If no display has the instruction attribute, the output of an EXAMINE/INSTRUCTION command is directed at display OUT.
After manipulating the contents of display INST, you can redisplay the location at which execution is currently paused (the default behavior of INST) by pressing KP5.
7.4.4.3. Displaying Instructions for a Routine on the Call Stack
DBG> SET SCOPE/CURRENT 1
To reset the default scope for displaying instructions, enter the CANCEL SCOPE command. The command causes display INST to show the instructions for the routine at the top of the call stack where execution is paused.
7.4.4.4. Displaying Register Values for a Routine on the Call Stack
DBG> SET SCOPE/CURRENT 1
To reset the default scope for displaying register values, enter the CANCEL SCOPE command. This command causes display REG to show the register values for the routine at the top of the call stack, where execution is paused.
7.5. Manipulating Existing Displays
Use the SELECT and SCROLL commands to scroll a display.
Use the DISPLAY command to show, hide, or remove a display; the CANCEL DISPLAY command to permanently delete a display; and the SHOW DISPLAY command to identify the displays that currently exist and their order in the display list.
Use the MOVE command to move a display across the screen.
Use the EXPAND command to expand or contract a display.
Section 7.7, ''Specifying a Display Window'' and Section 7.2, ''Display Kinds''discuss more advanced techniques for modifying existing displays with the DISPLAY command - how to change the display window and the type of information displayed.
7.5.1. Scrolling a Display
A display usually has more lines of text (and possibly longer lines) than can be seen through its window. The SCROLL command lets you view text that is hidden beyond a window's border. You can scroll through all displays except for the PROMPT display.
The easiest way to scroll displays is with the keypad keys, described later in this section. Using the relevant commands is explained first.
You can specify a display explicitly with the SCROLL command. Typically, however, you first
use the SELECT/SCROLL command to select the current scrolling display. This display then has the
scroll attribute and is the default display for the SCROLL command. You then use the SCROLL
command with no parameter to scroll that display up or down by a specified number of lines, or
to the right or left by a specified number of columns. The direction and distance scrolled are
specified with the command qualifiers (/UP: n, /RIGHT:
n, and so on).
DBG> SELECT OUT DBG> SCROLL/DOWN:18
Pressing KP3 assigns the scroll attribute to the next display in the display list after the current scrolling display. To select a display as the current scrolling display, press KP3 repeatedly until the word "scroll" appears on the top line of that display.
Press KP8, KP2, KP6, or KP4 to scroll up, down, right, or left, respectively. The amount of scroll depends on which key state you use (DEFAULT, GOLD, or BLUE).
7.5.2. Showing, Hiding, Removing, and Canceling a Display
DBG> DISPLAY INST
Pressing KP9, which is bound to the DISPLAY %NEXTDISP command, enables you to achieve this effect conveniently. The built-in function %NEXTDISP signifies the next display in the display list. (Appendix C, "Built-In Symbols and Logical Names" identifies all screen-related built-in functions.) Each time you press KP9, the next display in the list is put on top of the pasteboard in its current window.
By default, the top line of display OUT (which identifies the display) coincides with the bottom line of display SRC. If SRC is on top of the pasteboard, its bottom line hides the top line of OUT (keep this in mind when using the DISPLAY command and associated keypad keys to put various displays on top of the pasteboard).
To hide a display at the bottom of the pasteboard, use the DISPLAY/HIDE command. This command changes the order of that display in the display list.
To remove a display from the pasteboard so that it is no longer seen (yet is not permanently deleted), use the DISPLAY/REMOVE command. To put a removed display back on the pasteboard, use the DISPLAY command.
To delete a display permanently, use the CANCEL DISPLAY command. To re-create the display, use the DISPLAY command as described in Section 7.6, ''Creating a New Display''.
Note that you cannot hide, remove, or delete the PROMPT display.
To identify the displays that currently exist, use the SHOW DISPLAY command. They are listed according to their order on the display list. The display that is on top of the pasteboard is listed last.
For more information about the DISPLAY options, see the DISPLAY command. Note that the DISPLAY command accepts optional parameters that let you modify other characteristics of existing displays, namely the display window and the type of information displayed. The techniques are discussed in Section 7.7, ''Specifying a Display Window'' and Section 7.2, ''Display Kinds''.
7.5.3. Moving a Display Across the Screen
Use the MOVE command to move a display
across the screen. The qualifiers /UP: n, /DOWN:
n, /RIGHT: n, and /LEFT:
n specify the direction and the number of lines or columns by which
to move the display. If you do not specify a display, the current scrolling display is
moved.
Press KP3 repeatedly as needed to select the current scrolling display.
Put the keypad in the MOVE state, then press KP8, KP2, KP4, or KP6 to move the display up, down, left, or right, respectively. See Appendix A, " Predefined Key Functions".
7.5.4. Expanding or Contracting a Display
Use the EXPAND
command to expand or contract a display. The qualifiers /UP:
n, /DOWN:
n, /RIGHT:
n, and /LEFT:
n specify the direction and the number of lines or columns
by which to expand or contract the display (to contract a display, specify negative integer
values with these qualifiers). If you do not specify a display, the current scrolling display is
expanded or contracted.
Press KP3 repeatedly as needed to select the current scrolling display.
Put the keypad in the EXPAND or CONTRACT state, then press KP8, KP2, KP4, or KP6 to expand or contract the display vertically or horizontally. See Appendix A, " Predefined Key Functions".
The PROMPT display cannot be contracted (or expanded) horizontally. Also, it cannot be contracted vertically to less than two lines.
7.6. Creating a New Display
DISPLAYdisplay-name[ATwindow-spec] [display-kind]
The display name can be any name that is not already used to name a display (use the SHOW DISPLAY command to identify all existing displays). A newly created display is placed on top of the pasteboard, on top of any existing displays (except for the predefined PROMPT display, which cannot be hidden). The display name appears at the top left corner of the display window.
Section 7.7, ''Specifying a Display Window'' explains the options for specifying windows. If you do not provide a window specification, the display is positioned in the upper or lower half of the screen, alternating between these locations as you create new displays.
Section 7.2, ''Display Kinds'' explains the options for specifying display kinds. If you do not specify a display kind, an output display is created.
DBG> DISPLAY OUT2
EXAM_XY that is
located in the right third quarter (RQ3) of the screen. This display shows the current value of
variables X and Y and is updated whenever the debugger gains control from the
program.DBG> DISPLAY EXAM_XY AT RQ3 DO (EXAMINE X, Y)
For more information, see the DISPLAY command.
7.7. Specifying a Display Window
Display windows can occupy any rectangular portion of the screen.
Specify a window in terms of lines and columns.
Use the name of a predefined window, such as H1.
Use the name of a window definition previously established with the SET WINDOW command.
Each of these techniques is described in the following sections. When specifying windows, keep in mind that the PROMPT display always remains on top of the display pasteboard and, therefore, occludes any part of another display that shares the same region of the screen.
Display windows, regardless of how specified, are dynamic. This means that, if you use a SET TERMINAL command to change the screen height or width, the window associated with a display expands or contracts in proportion to the new screen height or width.
7.7.1. Specifying a Window in Terms of Lines and Columns
start-line,
line-count [, start-column,
column-count]). For example, the following command creates the
output display CALLS and specifies that its window be 7 lines deep starting at line 10, and 30
columns wide starting at column 50:DBG> DISPLAY CALLS AT (10, 7, 50, 30)
If you do not specify start-column or
column-count, the window occupies the full width of the
screen.
7.7.2. Using a Predefined Window
DBG> DISPLAY ZIP AT RH1
The SHOW WINDOW command identifies all predefined window definitions as well as those you create with the SET WINDOW command.
7.7.3. Creating a New Window Definition
SET WINDOWwindow-nameAT (start-line, line-count[,start-column, column-count])
DBG> SET WINDOW MIDDLE AT (9, 4, 30, 20) DBG> DISPLAY OUT AT MIDDLE
To identify all current window definitions, use the SHOW WINDOW command. To delete a window definition, use the CANCEL WINDOW command.
7.8. Sample Display Configuration
How to best use screen mode depends on your personal style and on what type of error you are looking for. You might be satisfied to use the predefined displays. If you have access to a larger screen, you might want to create additional displays for various purposes. The following example gives some ideas.
Assume you are debugging in a high-level language and are interested in tracing the execution of your program through several routine calls.
First set up the default screen configuration - that is, SRC in H1, OUT in S45, and PROMPT in S6 (the keypad key sequence PF4 MINUS gives this configuration). SRC shows the source code of the module in which execution is paused.
DBG> DISPLAY SRC2 AT RH1 SOURCE (EXAMINE/SOURCE .1\%PC)
Thus the left half of your screen shows the currently executing routine and the right half shows the caller of that routine.
DBG> DISPLAY CALLS AT S4 DO (SHOW CALLS)
DBG> DISPLAY OUT AT S5
You can create a similar display configuration with instruction displays instead of source displays.
7.9. Saving Displays and the Screen State
The SAVE command enables you to make a snapshot of an existing display and save that copy as a new display. This is useful if, for example, you later want to refer to the current contents of an automatically updated display (such as a DO display).
DBG> SAVE CALLS AS CALLS4
DBG> DISPLAY CALLS4
COB34.TXT:
DBG> EXTRACT/APPEND CALLS COB34
DBG> EXTRACT/SCREEN_LAYOUT . . . DBG> @DBGSCREEN
Note that you cannot save the PROMPT display as another display, or extract it into a file.
7.10. Changing the Screen Height and Width
During a debugging session, you can change the height or width of your terminal screen. One reason might be to accommodate long lines that would wrap if displayed across 80 columns. Or, if you are at a workstation, you might want to reformat your debugger window relative to other windows.
To change the screen height or width, use the SET TERMINAL command. The general effect of the command is the same whether you are at a VT-series terminal or at a workstation.
DBG> SET TERMINAL/PAGE:35/WIDTH:110
By default, all displays are dynamic. A dynamic display automatically adjusts its window dimensions in proportion when a SET TERMINAL command changes the screen height or width. This means that, when using the SET TERMINAL command, you preserve the relative positions of your displays. The /[NO]DYNAMIC qualifier on the DISPLAY command lets you control whether or not a display is dynamic. If a display is not dynamic, it does not change its window coordinates after you enter a SET TERMINAL command (you can then use the DISPLAY, MOVE, or EXPAND commands, or various keypad key combinations, to move or resize a display).
To see the current terminal width and height being used by the debugger, use the SHOW TERMINAL command.
Note that the debugger's SET TERMINAL command does not affect the terminal screen size at DCL level. When you exit the debugger, the original screen size is maintained.
7.11. Screen-Related Built-In Symbols
%SOURCE_SCOPE - To display source code. %SOURCE_SCOPE is described in Section 7.4.1, ''Predefined Source Display (SRC)''.
%INST_SCOPE - To display instructions. %INST_SCOPE is described in Section 7.4.4, ''Predefined Instruction Display (INST)''.
%PAGE, %WIDTH - To specify the current screen height and width.
%CURDISP, %CURSCROLL, %NEXTDISP, %NEXTINST, %NEXTOUTPUT, %NEXTSCROLL, %NEXTSOURCE - To specify displays in the display list.
7.11.1. Screen Height and Width
DBG> SET WINDOW MIDDLE AT (%PAGE/4, %PAGE/2, %WIDTH/4, %WIDTH/2)
7.11.2. Display Built-In Symbols
Each time you refer to a specific display with a DISPLAY command, the display list is updated and reordered, if necessary. The most recently referenced display is put at the tail of the display list, because that display is pasted last on the pasteboard (you can identify the display list by entering a SHOW DISPLAY command).
You can use display built-in symbols to specify displays relative to their positions in the display list. These symbols, listed as follows, enable you to refer to displays by their relative positions in the list instead of by their explicit names. The symbols are used mainly in keypad key definitions or command procedures.
7.12. Screen Dimensions and Predefined Windows
On a VT-series terminal, the screen consists of 24 lines by 80 or 132 columns. On a workstation, the screen is larger in both height and width. The debugger can accommodate screen sizes up to 100 lines by 255 columns.
Dividing the screen vertically into equal fractions: halves, thirds, quarters, sixths, or eighths
Combining vertically contiguous equal fractions: halves, thirds, quarters, sixths, or eighths
Dividing the vertical fractions into left and right halves
The SHOW WINDOW command identifies all predefined display windows.
Windows T1, T2, and T3 occupy the top, middle, and bottom thirds of the screen, respectively.
Window RH2 occupies the right bottom half of the screen.
Window LQ23 occupies the left middle two quarters of the screen.
Window S45 occupies the fourth and fifth sixths of the screen.
DBG> DISPLAY XYZ AT H1 SOURCE DBG> DISPLAY XYZ AT Q12 SOURCE DBG> DISPLAY XYZ AT S123 SOURCE DBG> DISPLAY XYZ AT E1234 SOURCE
Left-hand windows: (1, 40)
Right-hand windows: (42, 39)
| Window Name | Start-line, Line-count | Window Location |
|---|---|---|
| FS | (1, 23) | Full screen |
| H1 | (1, 11) | Top half |
| H2 | (13, 11) | Bottom half |
| T1 | (1, 7) | Top third |
| T2 | (9, 7) | Middle third |
| T3 | (17, 7) | Bottom third |
| Q1 | (1, 5) | Top quarter |
| Q2 | (7, 5) | Second quarter |
| Q3 | (13, 5) | Third quarter |
| Q4 | (19, 5) | Bottom quarter |
| S1 | (1, 3) | Top sixth |
| S2 | (5, 3) | Second sixth |
| S3 | (9, 3) | Third sixth |
| S4 | (13, 3) | Fourth sixth |
| S5 | (17, 3) | Fifth sixth |
| S6 | (21, 3) | Bottom sixth |
| E1 | (1, 2) | Top eighth |
| E2 | (4, 2) | Second eighth |
| E3 | (7, 2) | Third eighth |
| E4 | (10, 2) | Fourth eighth |
| E5 | (13, 2) | Fifth eighth |
| E6 | (16, 2) | Sixth eighth |
| E7 | (19, 2) | Seventh eighth |
| E8 | (22, 2) | Bottom eighth |
7.13. Internationalization of Screen Mode
DBG$SMGSHR- For specifying the Screen Management (SMG) shareable image. The debugger uses the SMG shareable image in its implementation of screen mode. Asian variants of the SMG shareable image handle multibyte characters. Hence, if an Asian variant of SMG is used by the debugger, the screen mode interface to the debugger will be able to display and manipulate multibyte characters.Define theDBG$SMGSHRlogical name as follows:$ DEFINE/JOB DBG$SMGSHR <
name_of_Asian_SMG>where
<name_of_Asian_SMG>varies according to the variants of Asian OpenVMS. For example, the name of the Asian SMG in Japanese OpenVMS is JSY$SMGSHR.EXE.SMG$DEFAULT_CHARACTER_SET - For the Asian SMG and multibyte characters. This logical need only be defined if DBG$SMGSHR has been defined. See the documentation on Asian or Japanese screen management routines for details on how to define this logical name.
Part III. DECwindows Interface
Chapter 8. Introduction
Note
The VSI DECwindows Motif for OpenVMS user interface to the OpenVMS Debugger Version 7.1 or later requires Version 1.2 or later of VSI DECwindows Motif for OpenVMS.
A functional overview of the OpenVMS Debugger, including its user interface options - VSI DECwindows Motif for OpenVMS and command (Section 8.1, ''Introduction'')
An orientation to the debugger's VSI DECwindows Motif for OpenVMS screen features, such as windows, menus, and so on (Section 8.2, ''Debugger Windows and Menus'')
Instructions for entering debugger commands at the command-entry prompt (Section 8.3, ''Entering Commands at the Prompt'')
Instructions for accessing online help (Section 8.4, ''Displaying Online Help About the Debugger'')
For information about starting a debugging session, see Chapter 9, "Starting and Ending a Debugging Session". For
detailed information about using the Motif interface for debugging, see Chapter 10, "Using the Debugger". For the source code of program
EIGHTQUEENS.EXE, shown in the figures of this chapter, see Appendix E, "EIGHTQUEENS.C".
8.1. Introduction
The OpenVMS Debugger has a VSI DECwindows Motif for OpenVMS graphical user interface (GUI) for workstations. This enhancement to the screen-mode command interface accepts mouse input to choose items from menus and to activate or deactivate push buttons, to drag the pointer to select text in windows, and so on. The debugger's VSI DECwindows Motif for OpenVMS GUI menus and push buttons provide the functions for most basic debugging tasks.
To perform certain operations by using the VSI DECwindows Motif for OpenVMS user interface menus and push buttons for certain operations
To do debugging tasks not available through the VSI DECwindows Motif for OpenVMS GUI menus and push buttons
You can customize the VSI DECwindows Motif for OpenVMS GUI to associate other debugger commands with new or existing push buttons.
Note
The VSI DECwindows Motif for OpenVMS GUI does not recognize the HELP command at its command-entry prompt. Choose the On Commands item in the Help menu for online help on debugger commands.
You cannot use the VSI DECwindows Motif for OpenVMS GUI to debug detached processes such as print symbionts that run without a command line interpreter (CLI).See Section 1.11, ''Debugging Detached Processes That Run with No CLI'' for details about debugging detached processes that do not have a CLI.
8.1.1. Convenience Features
The following paragraphs highlight some of the convenience features of the debugger's default VSI DECwindows Motif for OpenVMS interface. Section 8.2, ''Debugger Windows and Menus'' gives visual details. (Convenience features of the debugger's command interface are described in detail in Section 1.1.2, ''Convenience Features''.)
Source-Code Display
The OpenVMS Debugger is a source-level debugger. The debugger displays in the source viewthe source code that surrounds the instruction where program execution is paused currently. You can enable and disable the display of compiler-generated line numbers.
List the images, modules, and routines of your program
Display source code from selected modules or routines
Display the underlying hierarchy of modules and routines
Set breakpoints by double-clicking on selected routines
Call-Stack Navigation
Source code display (in the source view)
Register display (in the register view)
Instruction display (in the instruction view)
Symbol searches
Breakpoints
You set, activate, and deactivate breakpoints by clicking on buttons next to the source lines in the source view or the instruction view. Optionally, you can set, deactivate, or activate breakpoints by selecting items in window pull-down menus, pop-up menus, context-sensitive menus, or dialog boxes. You can set conditional breakpoints, which suspend program execution if the specified condition is true. You can set action breakpoints, which execute one or more debugger commands when the breakpoint suspends program execution. The main window push buttons, the instruction view push buttons, and the breakpoint view give a visual indication of activated, deactivated, and conditional breakpoints.
Push Buttons
Push buttons in the push button view control common operations:by clicking on a push button, you can start execution, step to the next source line, display the value of a variable selected in a window, interrupt execution, and so on.
You can modify, add, remove, and resequence push buttons and the associated debugger commands.
Context-Sensitive Pop-Up Menus
Context-sensitive pop-up menus list common operations associated with your view (source view, command view, and so on.) When you click MB3, the pop-up menu lists actions for the text you have selected, the source line at which you are pointing, or the view in which you are working.
Displaying and Manipulating Data
To display the value of a variable or expression, select the variable or expression in the source view and click on a push button, such as Examine (examine variable). You can also display selected values by choosing items from window pull-down menus(such as Examine, in the Commands pull-down menu), context-sensitive menus, or dialog boxes. You can display values in different type or radix formats.
To change the value of a variable, edit the currently displayed value in the monitor view. You can also change values by selecting items in window pull-down menus (such as Deposit, in the Commands pull-down menu), context-sensitive pop-up menus, or dialog boxes.
The monitor view displays the updated values of specified variables whenever the debugger regains control from your program.
Kept Debugger RERUN Command
You can run the debugger in a state known as the kept debugger from which you can rerun the same program or run another program without exiting the debugger. When rerunning a program, you can choose to save the current state of breakpoints, tracepoints, and static watch points. The kept debugger is also available in the screen mode debugger. See Section 9.1, ''Starting the Kept Debugger'' for information on starting the kept debugger.
Client/Server Configuration
You can run the debugger in a client/server configuration, which allows you to debug programs that run on an OpenVMS node remotely from another OpenVMS node using the VSI DECwindows Motif for OpenVMS interface, or from a PC using the Microsoft Windows interface. Up to 31 debug clients can simultaneously access the same debug server, which allows many debugging options.
Instruction and Register Views
The instruction view shows the decoded instruction stream (the code that is actually executing) of your program. This view is useful if the program you are debugging has been optimized by the compiler, in which case the source code in the source view may not reflect the code that is executing. You can set breakpoints on instructions and display the memory addresses and source-code line numbers associated with each instruction.
The register view displays the current contents of all machine registers. You can edit the displayed values to deposit other values into the registers.
Debugger Status Indicator
D — the program being debugged is running
U — the Debugger is executing a user command
Threads Program Support
The threads view displays information about the current state of all tasks of a multithread program. You can modify threads characteristics to control thread execution, priority, state transitions, and so on.
Integration with Command Interface
When you use the VSI DECwindows Motif for OpenVMS GUI menus and push buttons, the debugger echoes your commands in the command view to provide a record of your actions.
When you enter commands at the prompt, the debugger updates the VSI DECwindows Motif for OpenVMS views accordingly.
Integration with Source-Level Editor
You can edit program source code without exiting from the debugger. In the editor view, you can display the source code, search and replace text, or add additional text. Editor view text buffers allow you to move quickly back and forth between new or existing files, and copy, cut, and paste text from buffer to buffer.
The text editor available through the debugger's VSI DECwindows Motif for OpenVMS menu interface
is a simple convenience feature, not intended to replace sophisticated text editors
such as the Language-Sensitive Editor (LSE). To use a different editor, enter the
Edit command at the DBG> prompt in the command view (see the
EDIT command).
Customization
Configuration of windows and views (for example, size, screen location, order)
Push button order, labels, and associated debugger commands (this includes adding and removing push buttons)
Character fonts for displayed text
Online Help
Online help is available for the debugger's VSI DECwindows Motif for OpenVMS interface(context-sensitive help) and for its command interface.
8.2. Debugger Windows and Menus
The following sections describe the debugger windows, menus, views, and other features of the OpenVMS Debugger VSI DECwindows Motif for OpenVMS interface.
8.2.1. Default Window Configuration
By default, the debugger starts up in the main window, as shown in Figure 8.1, ''Debugger Main Window''.
When you start the debugger as explained in Section 9.1, ''Starting the Kept Debugger'', the source view is initially empty. Figure 8.1, ''Debugger Main Window'' shows the source view after a program has been brought under debugger control (by directing the debugger to run a specific image, in this example, EIGHTQUEENS).
You can customize the startup configuration to your preference as described in Section 10.10.1, ''Defining the Startup Configuration of Debugger Views''.
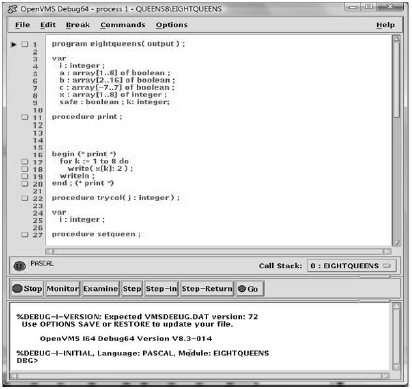
8.2.2. Main Window
Title bar (see Section 8.2.2.1, ''Title Bar'')
Source view (see Section 8.2.2.2, ''Source View'')
Call Stack view (see Section 8.2.2.4, ''Call Stack Menu'')
Push button view (see Section 8.2.2.5, ''Push Button View'')
Command view (see Section 8.2.2.6, ''Command View '')
If the debugger is running on an Alpha or Integrity server processor, the name of the debugger is "OpenVMS Debug64."
8.2.2.1. Title Bar
The title bar, at the top of the main window, displays (by default) the name of the debugger, the name of the program being debugged, and the name of the source code module that is currently displayed in the source view.
8.2.2.2. Source View
Source code of the program you are debugging and, by default, the compiler-generated line numbers (to the left of the source code). To choose not to display line numbers, see Section 10.1, ''Displaying the Source Code of Your Program''.
Breakpoint toggle push buttons.
Current-location pointer (a triangle to the left of breakpoint push buttons), which points to the line of source code that will be executed when program execution resumes.
For more information about displaying source code, see Section 8.2.2.3, ''Menus on Main Window'' and Section 10.1, ''Displaying the Source Code of Your Program''.
8.2.2.3. Menus on Main Window
Figure 8.2, ''Menus on Main Window'' and Table 8.1, ''Menus on Main Window'' describe the menus on the main window.
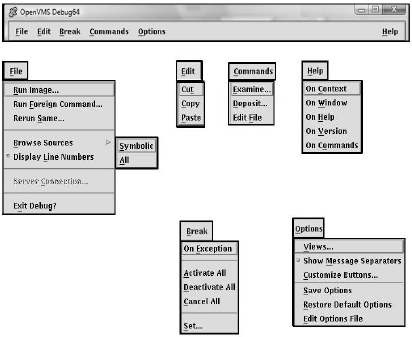
|
Menu |
Item |
Description |
|---|---|---|
|
File |
Run Image... |
Bring a program under debugger control by specifying an executable image. |
|
Run Foreign Command... |
Bring a program under debugger control by specifying a symbol for a foreign command. | |
|
Rerun Same... |
Rerun the same program under debugger control. | |
|
Browse Sources |
Display the source code in any module of your program. Set
breakpoints on routines.
| |
|
Display Line Numbers |
Display or hide line numbers in the source view. | |
|
Server Connection... |
(Client/Server mode)Specify the network binding string of the server for connection. | |
|
Exit Debug? |
End the debugging session, terminating the debugger. | |
|
Edit |
Cut |
Cut selected text and copy it to the clipboard. You can cut text only from fields or regions that accept input (although, in most cases, Cut copies the selected text to the clipboard). |
|
Copy |
Copy selected text from the window to the clipboard without deleting the text. | |
|
Paste |
Paste text from the clipboard to a text-entry field or region. | |
|
Break |
On Exception |
Break on any exception signaled during program execution. |
|
Activate All |
Activate any previously set breakpoints. | |
|
Deactivate All |
Deactivate any previously set breakpoints. | |
|
Cancel All |
Remove all breakpoints from the debugger's breakpoint list and from the breakpoint view. | |
|
Set... |
Set a new breakpoint, optionally associated with a particular condition or action, at a specified location. | |
|
Commands |
Examine... |
Examine the current value of a variable or expression. The output value may be typecast or changed in radix. |
|
Deposit... |
Deposit a value to a variable. The input value may be changed in radix. | |
|
Edit File |
Edit the source code of your file in the debugger's editor. | |
|
Options |
Views... |
Display one or more of the following:
|
|
Track Language Changes |
Notify you if the debugger enters a module that is written in a language different from the previously executed module. | |
|
Show Message Separators |
Display a dotted line between each command and message displayed by the debugger. | |
|
Customize Buttons... |
Modify, add, remove, or resequence a push button in the push button view and the associated debugger command. | |
|
Save Options |
Save the current settings of all VSI DECwindows Motif for OpenVMS features of the debugger that you can customize interactively, such as the configuration of windows and views, and push button definitions. This preserves the current debugger configuration for the next time you run the debugger. | |
|
Restore Default Options |
Copy the system default debugger resource file
| |
|
Edit Options File |
Load and display the user-specific resource file
| |
|
Help |
On Context |
Enable the display of context-sensitive online help. |
|
On Window |
Display information about the debugger. | |
|
On Help |
Display information about the online help system. | |
|
On Version |
Display information about this version of the debugger. | |
|
On Commands |
Display information about debugger commands. |
|
Register Type |
Alpha Displays |
Integrity Server Displays |
|---|---|---|
|
Call Frame |
R0, R25, R26, R27, FP, SP, F0, F1, PC, PS, FPCR, SFPCR |
PC, CFM, BSP, BSPSTORE, PFS, RP, UNAT, GP, SP, TP, AI |
|
General Purpose |
R0-R28, FP, SP, R31 |
PC, GP, R2-R11, SP, TP, R14-R24, AI, R26-R127 |
|
Floating Point |
F0-F31 |
F2 - F127 |
8.2.2.4. Call Stack Menu
The Call Stack menu, between the source view and the push button view, shows the name of the routine whose source code is displayed in the source view. This menu lists the sequence of routine calls currently on the stack and lets you set the scope of source code display and symbol searches to any routine on the stack (see Section 10.6.2, ''Setting the Current Scope Relative to the Call Stack'').
8.2.2.5. Push Button View
Figure 8.3, ''Default Buttons in the Push Button View Table'' and Table 8.3, ''Default Buttons in the Push Button View''describe the default push buttons in the main window. You can modify, add, remove, and resequence buttons and their associated commands as explained in Section 10.10.3, ''Modifying, Adding, Removing, and Resequencing Push Buttons''.

|
Button |
Description |
|---|---|
|
Stop |
Interrupt program execution or a debugger operation without ending the debugging session. |
|
Go |
Start or resume execution from the current program location. |
|
STEP |
Execute the program one step unit of execution. By default, this is one executable line of source code. |
|
S/in |
When execution is suspended at a routine call statement, move execution into the called routine just past the start of the routine. This is the same behavior as STEP if not at a routine call statement. |
|
S/ret |
Execute the program directly to the end of the current routine. |
|
S/call |
Execute the program directly to the next Call or Return instruction. |
|
EX |
Display, in the command view, the current value of a variable whose name you have selected in a window. |
|
E/az |
Display, in the command view, the current value of a variable whose name you have selected in a window. The variable is interpreted as a zero-terminated ASCII string. |
|
E/ac |
Display, in the command view, the current value of a variable whose name you have selected in a window. The variable is interpreted as a counted ASCII string preceded by a one-byte count field that contains the length of the string. |
|
EVAL |
Display, in the command view, the value of a language expression in the current language (by default, the language of the module containing the main program). |
|
MON |
Display, in the monitor view, a variable name that you have selected in a window and the current value of that variable. Whenever the debugger regains control from your program, it automatically checks the value and updates the displayed value accordingly. |
8.2.2.6. Command View
The result of an Examine operation.
Diagnostic messages. For online help on debugger diagnostic messages, see Section 8.4.4, ''Displaying Help on Debugger Diagnostic Messages''.
Command echo. The debugger translates your VSI DECwindows Motif for OpenVMS menu and push button input into debugger commands and displays those commands on the command line in the command view, providing a record of your most recent commands. This enables you to correlate your input with debugger actions.
You can clear the entire command view, leaving only the current command-line prompt, by choosing Clear Command Window from the pop-up menu.
You can clear the current command line by choosing Clear Command Line from the pop-up menu.
8.2.3. Optional Views Window
|
View |
Description |
|---|---|
|
Breakpoint view |
List all breakpoints that are currently set and identify those which are activated, deactivated, or qualified as conditional breakpoints. The breakpoint view also allows you to modify the state of each breakpoint. |
|
Monitor view |
List variables whose values you want to monitor as your program executes. The debugger updates the values whenever it regains control from your program (for example, after a step or at a breakpoint). Alternatively, you can set a watchpoint, causing execution to stop whenever a particular variable has been modified. You can also change the values of variables. |
|
Instruction view |
Display the decoded instruction stream of your program and allow you to set breakpoints on instructions. By default, the debugger displays the corresponding memory addresses and source-code line numbers to the left of the instructions. You can choose to suppress these. |
|
Register view |
Display the current contents of all machine registers. The debugger updates the values whenever it regains control from your program. The register view also lets you change the values in registers. |
|
Tasking view |
List all the existing (non terminated) tasks of a tasking program. Provides information about each task and allows you to modify the state of each task. |
Figure 8.5, ''Monitor, Breakpoint, and Register Views'' shows a possible configuration of the breakpoint view, monitor view, and register view, as a result of the selections in the View menu in Figure 8.4, ''Debugger Main Window and the Optional Views Window''.
Figure 8.6, ''Instruction View'' shows the instruction view, which is a separate window so that you can position it where most convenient. Figure 8.7, ''Thread View'' shows the tasking view.
Note that the registers and instructions displayed are system-specific. Figure 8.5, ''Monitor, Breakpoint, and Register Views'' and Figure 8.6, ''Instruction View'' show Integrity server-specific registers and instructions.
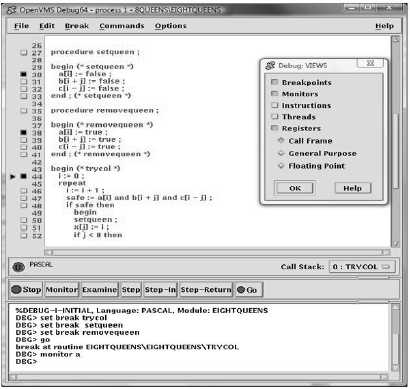
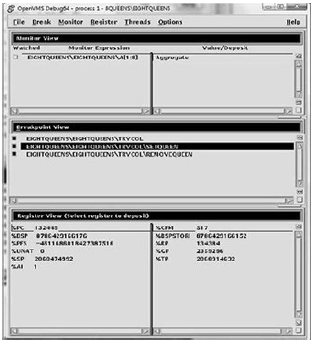
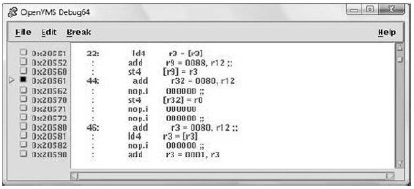
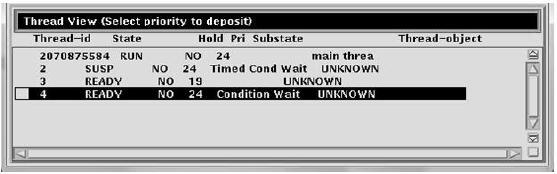
8.2.3.1. Menus on Optional Views Window
Figure 8.8, ''Menus on Optional Views Window'' and Table 8.5, ''Menus on Optional Views Window'' describe the menus on the optional views window.
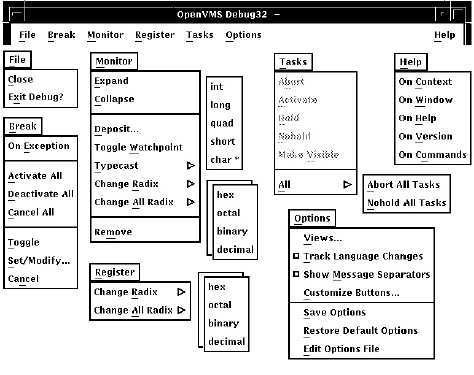
|
Menu |
Item |
Description |
|---|---|---|
|
File |
Close |
Close the optional views window. |
|
Exit Debug? |
End the debugging session, terminating the debugger. | |
|
Break |
On Exception |
Break on any exception signaled during program execution. |
|
Activate All |
Activate any previously set breakpoints. | |
|
Deactivate All |
Deactivate any previously set breakpoints. | |
|
Cancel All |
Remove all breakpoints from the debugger's breakpoint list and from the breakpoint view. | |
|
Toggle |
Toggle a breakpoint. | |
|
Set/Modify... |
Set a new breakpoint, optionally associated with a particular condition or action, at a specified location. | |
|
Cancel |
Cancel (delete) an individual breakpoint. | |
|
Monitor |
Expand |
Expand monitor view output to include the values of component parts of a selected item as well as the aggregate value. |
|
Collapse |
Collapse the monitor view output to show only the aggregate value of a selected item, instead of the values of each component part. | |
|
Deposit... |
Change the value of a monitored element. | |
|
Toggle Watchpoint |
Toggle a selected watchpoint. | |
|
Typecast |
Use the submenu to typecast output for a selected variable to int, long, quad, short, or char*. | |
|
Change Radix |
Use the submenu to change the output radix for a selected variable to hex, octal, binary, or decimal. | |
|
Change All Radix |
Use the submenu to change the output radix for all subsequent monitored elements to hex, octal, binary, or decimal. | |
|
Remove |
Remove an element from the monitor view. | |
|
Register |
Change Radix |
Use the submenu to change radix for selected register to hex, octal, binary, or decimal. |
|
Change All Radix |
Use the submenu to change radix for all registers to hex, octal, binary, or decimal. | |
|
Tasks |
Abort |
Request that the selected task be terminated at the next allowed opportunity. |
|
Activate |
Make the selected task the active task. | |
|
Hold |
Place the selected task on hold. | |
|
No hold |
Release the selected task from hold. | |
|
Make Visible |
Make the selected task the visible task. | |
|
All |
Use the submenu to abort all tasks or release all tasks from hold. | |
|
Options |
Views... |
Display one or more of the following:
|
|
Customize Buttons... |
Modify, add, remove, or resequence a push button in the push button view and the associated debugger command. | |
|
Save Options |
Save the current settings of all VSI DECwindows Motif for OpenVMS features of the debugger that you can customize interactively, such as the configuration of windows and views, and push button definitions. This preserves your current debugger configuration for the next time you run the debugger. | |
|
Restore Default Options |
Copy the system default debugger resource file
| |
|
Edit Options File |
Load and display the user-specific resource file
| |
|
Help |
On Context |
Enable the display of context-sensitive online help. |
|
On Window |
Display information about the debugger. | |
|
On Help |
Display information about the online help system. | |
|
On Version |
Display information about this version of the debugger. | |
|
On Commands |
Display information about debugger commands. |
8.3. Entering Commands at the Prompt
As an alternative to using the VSI DECwindows Motif for OpenVMS GUI menus and push buttons for certain operations
To do debugging tasks not available through the VSI DECwindows Motif for OpenVMS GUI pull-down menus and push buttons
Figure 8.9, ''Entering Commands at the Prompt'' shows the RUN command in the command view.
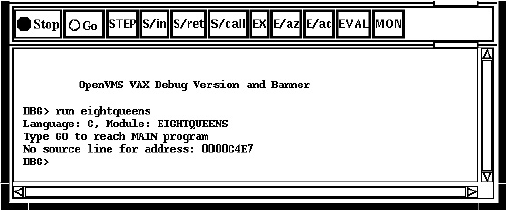
When you use the VSI DECwindows Motif for OpenVMS interface pull-down menus and push buttons, the debugger translates your input into debugger commands and echoes these commands on the command line so that you have a record of your commands. Echoed commands are visually indistinguishable from commands that you enter explicitly on the command line.
For information about the debugger's command interface, see Part II,''Command Interface''. For online help about the commands, see Section 8.4.3, ''Displaying Help on Debugger Commands''.
In addition to entering debugger commands interactively at the prompt, you can also place them in debugger initialization files and command files for execution within the VSI DECwindows Motif for OpenVMS environment.
|
Command |
Corresponding Key |
|---|---|
|
Step/Line |
KP0 |
|
Step/Into |
GOLD-KP0 |
|
Step/Over |
BLUE-KP0 |
|
Examine |
KP1 |
|
Examine^ |
GOLD-KP1 |
|
Go |
KP, |
|
Show Calls |
KP5 |
|
Show Calls 3 |
GOLD-KP5 |
To enter one of these commands, press the key or keys indicated, followed by the Enter key on the keypad. (The GOLD key is PF1; the BLUE key is PF4.)
For information on changing these key bindings, or binding commands to unassigned keys on the keypad, see Section 10.10.4.4, ''Defining the Key Bindings on the Keypad''.
8.3.1. Debugger Commands That Are Not Available in the VSI DECwindows Motif for OpenVMS Interface
|
ATTACH |
SELECT |
|
CANCEL MODE |
(SET, SHOW) ABORT_KEY |
|
CANCEL WINDOW |
(SET, SHOW) KEY |
|
DEFINE/KEY |
(SET, SHOW) MARGINS |
|
DELETE/KEY |
SET MODE [NO]KEYPAD |
|
DISPLAY |
SET MODE [NO]SCREEN |
|
EXAMINE/SOURCE |
SET MODE [NO]SCROLL |
|
EXPAND |
SET OUTPUT [NO]TERMINAL |
|
EXTRACT |
(SET, SHOW) TERMINAL |
|
HELP ? |
(SET, SHOW) WINDOW |
|
MOVE |
(SET, CANCEL) DISPLAY |
|
SAVE |
SHOW SELECT |
|
SCROLL |
SPAWN |
The debugger issues an error message if you enter any of these commands on the command line, or if the debugger encounters one of these commands while executing a command procedure.
8.4. Displaying Online Help About the Debugger
Context-sensitive help - information about an area or object in a window or dialog box
Task-oriented help - consists of an introductory help topic named Overview of the Debugger and several subtopics on specific debugging tasks
Help on debugger commands and various topics, such as language support
Help on debugger diagnostic messages
Task-oriented topics related to context-sensitive topics are connected through the list of additional topics in the help windows.
8.4.1. Displaying Context-Sensitive Help
Context-sensitive help is information about an area or object in a window or a dialog box.
Choose On Context from the Help menu in a debugger window. The pointer shape changes to a question mark (?).
Place the question mark on an object or area in a debugger window or dialog box.
Click MB1. Help for that area or object is displayed in a Help window. Additional topics provide task-oriented discussions, where applicable.
Note
Chapter 12, "Using the Heap Analyzer ", which is organized by task, explains how to use the debugger's Heap Analyzer.
You cannot obtain true context-sensitive help about any push button other than Stop. This is because all other buttons can be modified or removed.
8.4.2. Displaying the Overview Help Topic and Subtopic
The Overview help topic (Overview of the Debugger) and its subtopics provide task-oriented information about the debugger and debugging.
Choose On Window from the Help menu in a debugger window.
Choose Go To Overview from the View menu of a debugger help window.
To display information about a particular topic, choose it from the list of additional topics.
8.4.3. Displaying Help on Debugger Commands
Choose On Commands from the Help menu of a debugger window.
Choose the command name or other topic (for example, Language_Support) from the list of additional topics.
Note that the Help command is not available through the command
line interface in the command view.
8.4.4. Displaying Help on Debugger Diagnostic Messages
Chapter 9. Starting and Ending a Debugging Session
Start the debugger (Section 9.1, ''Starting the Kept Debugger'')
Continue when your program completes execution (Section 9.2, ''When Your Program Completes Execution'')
Rerun the same program from the current debugging session (Section 9.3, ''Rerunning the Same Program from the Current Debugging Session'')
Run another program from the current debugging session (Section 9.4, ''Running Another Program from the Current Debugging Session'')
Interrupt program execution and debugger operations (Section 9.6, ''Interrupting Program Execution and Aborting Debugger Operations'')
End a debugging session (Section 9.7, ''Ending a Debugging Session'')
Start the debugger in additional ways for specific purposes (Section 9.8, ''Additional Options for Starting the Debugger'')
Debug a program already running in a subprocess or detached process (Section 9.5, ''Debugging an Already Running Program'')
9.1. Starting the Kept Debugger
This section explains the most common way to start the debugger from DCL level ($) and bring your program under debugger control. Section 9.8, ''Additional Options for Starting the Debugger'' explains optional ways to start the debugger.
Starting the kept debugger as explained here enables you to use the Connect (see Section 9.5, ''Debugging an Already Running Program''), Rerun (see Section 9.3, ''Rerunning the Same Program from the Current Debugging Session''), and Run (see Section 9.4, ''Running Another Program from the Current Debugging Session'') features.
Verify that you have compiled and linked the program as explained in Section 1.2, ''Preparing an Executable Image for Debugging''.
- Enter the following command line:
$ DEBUG/KEEP
By default, the debugger starts up as shown in Figure 9.1, ''Debugger at Startup''. The main window remains empty until you bring a program under debugger control (Step 4). Upon startup, the debugger executes any user-defined initialization file (see Section 13.2, ''Using a Debugger Initialization File'').
Figure 9.1. Debugger at Startup 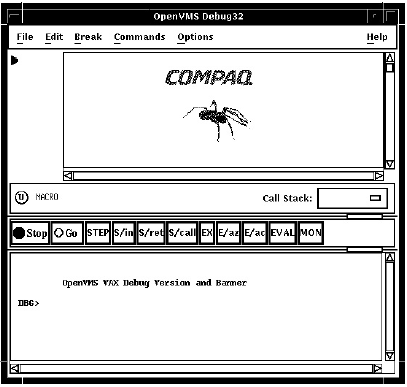
- Bring your program under debugger control using one of the following three techniques:
If the program is already running in a subprocess or detached process, use the
CONNECTcommand to bring the program under debugger control. See Section 9.5, ''Debugging an Already Running Program''.- Run a specified image (this is the most common technique):
Choose Run Image... from the File menu on the main window. The Run Image dialog lists the executable images in your current directory (see Figure 9.2, ''Running a Program by Specifying an Image'').
Click on the name of the image to be debugged. The Image: field displays the image name.
If applicable, enter arguments to be passed to the program in theArguments: field. If you specify a quoted string, you might have to add quotation marks because the debugger strips quotation marks when parsing the string.
Click on OK.
Figure 9.2. Running a Program by Specifying an Image 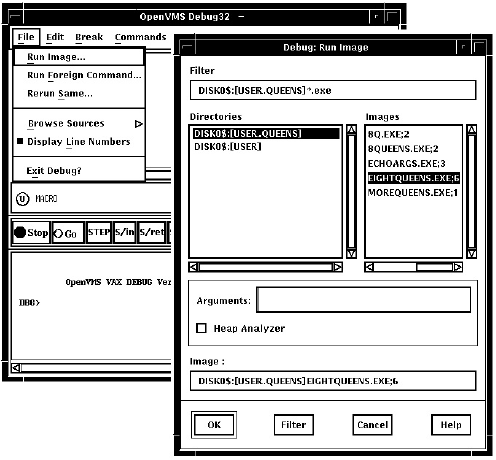
- Run an image by specifying a DCL command or a symbol for a foreign command:
Choose Run Foreign Command... from the File menu on the main window. The Run Foreign Command dialog is displayed (see Figure 9.3, ''Running a Program by Specifying a Command Symbol'').
- Enter the symbol in the Foreign Command: field (such a symbol can provide a shortcut around the directory and file selection process). The foreign command X1, shown in Figure 9.3, ''Running a Program by Specifying a Command Symbol'', has been previously defined:
$X1 :== RUN MYDISK:[MYDIR.MYSUBDIR]EIGHTQUEENS.EXE
Enter any arguments to be passed with the command in the Arguments: field.
Click on OK.
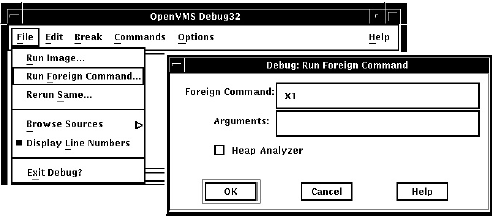
Displays the program's source code in the main window, as shown in Figure 9.4, ''Source Display at Startup''.
Suspends execution at the start of the main program. The current-location pointer to the left of the source code shows which line of code will be executed next.
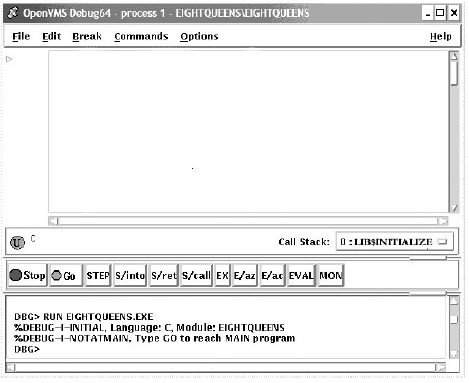
The message displayed in the command view indicates that this debugging session is initialized for a C program and that the name of the source module is EIGHTQUEENS.
Type GO to reach MAIN program No source line for address: nnnnnnnn
With some of these programs (for example, Ada programs), the breakpoint enables you to debug the initialization code using full symbolic information.The initialization sets up language-dependent debugger parameters. These parameters control the way the debugger parses names and expressions, formats debugger output, and so on.
You can now debug your program as explained in Chapter 10, "Using the Debugger".
You cannot use the procedure in this section to connect the debugger to a running program (see Section 9.8.2, ''Starting the Debugger After Interrupting a Running Program'').
To run a program under debugger control over a network link, you must use the debugger client/server interface. See Section 9.9, ''Starting the Motif Debug Client'' for more information.
9.2. When Your Program Completes Execution
'Normal successful completion'
You can rerun your program from the same debugging session (see Section 9.3, ''Rerunning the Same Program from the Current Debugging Session'').
You can run another program from the same debugging session (see Section 9.4, ''Running Another Program from the Current Debugging Session'').
You can end the debugging session (see Section 9.7, ''Ending a Debugging Session'').
9.3. Rerunning the Same Program from the Current Debugging Session
When running the kept debugger (see Section 9.1, ''Starting the Kept Debugger''), you can rerun the program currently under debugger control at any time during a debugging session.
Choose Rerun Same... from the File menu on the main window. The Rerun dialog is displayed (see Figure 9.5, ''Rerunning the Same Program'').
Enter any arguments to be passed to the program, if required, in the Arguments: field. If you specify a quoted string, you might have to add quotation marks because the debugger strips quotation marks when parsing the string.
Choose whether or not to keep the current state of any breakpoints, tracepoints, or static watchpoints that you previously set, activated, or deactivated(see Section 10.4, ''Suspending Execution by Setting Breakpoints'' and Section 10.5.5, ''Watching a Variable''). Nonstatic watchpoints might or might not be saved, depending on the scope of the variable being watched relative to the main program unit (where execution restarts).
Click on OK.
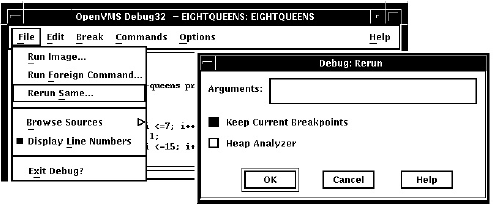
When you rerun a program, it is in the same initial state as a program that is brought under debugger control as explained in Section 9.1, ''Starting the Kept Debugger'', except for any saved breakpoints, tracepoints, or static watchpoints. The source display and current location pointer are updated accordingly.
When you rerun a program, the debugger uses the same version of the image that is currently under debugger control. To debug a different version of that program (or a different program) from the same debugging session, choose Run Image... or Run Foreign Command.. from the File menu on the main window (see Section 9.1, ''Starting the Kept Debugger'').
9.4. Running Another Program from the Current Debugging Session
You can bring another program under debugger control at any time during a debugging session, if you started the debugger as explained in Section 9.1, ''Starting the Kept Debugger''. Follow the procedure in that section for bringing a program under debugger control (also note the restrictions about using that procedure).
9.5. Debugging an Already Running Program
- Start the Kept debugger configuration using the DCL command:
$ DEBUG/KEEP
- At the
DBG>prompt, use theCONNECTcommand to interrupt the program and bring it under debug control.CONNECTcan be used to attach to a program running in a subprocess or attach to a program running in a detached process. Detached processes must meet both of the following requirements:The detached process UIC must be in the same group as your process
The detached process must have a CLI mapped
The second requirement effectively means that the program must have been started with a command similar to this:$ RUN/DETACH/INPUT=xxx.com SYS$SYSTEM:LOGINOUT
wherexxx.com
is a command procedure that starts the program with/NODEBUG.Once you have connected to the program, the rest of the debugging session is the same as a normal debugger session.
- When you have finished debugging the program, do either of the following:
Use the
DISCONNECTcommand to release debugger control of the program. The program continues execution.Exit the debugger. The program will terminate.
9.6. Interrupting Program Execution and Aborting Debugger Operations
To interrupt program execution during a debugging session, click on the Stop button on the push button view (see Figure 8.3, ''Default Buttons in the Push Button View Table'').This is useful if, for example, the program is in an infinite loop.
To abort a debugger operation in progress, click on Stop. This is useful if, for example, the debugger is displaying along stream of data.
Clicking on Stop does not end the debugging session. Clicking on Stop has no effect when the program is not running or when the debugger is not executing a command.
9.7. Ending a Debugging Session
To end a debugging session and terminate the debugger, choose Exit Debugger
from the File menu on the main window, or enter EXIT at the prompt
(to avoid confirmation dialogue). This returns control to system level.
To rerun your program from the current debugging session, see Section 9.3, ''Rerunning the Same Program from the Current Debugging Session''.
To run another program from the current debugging session, see Section 9.4, ''Running Another Program from the Current Debugging Session''.
9.8. Additional Options for Starting the Debugger
Start the debugger by running the program to be debugged with the DCL command
RUN(see Section 9.8.1, ''Starting the Debugger by Running a Program'').Interrupt a running program by pressing Ctrl/Y and then start the debugger using the DCL command
DEBUG(see Section 9.8.2, ''Starting the Debugger After Interrupting a Running Program'').- Override the debugger's default (VSI DECwindows Motif for OpenVMS user interface (see Section 9.8.3, ''Overriding the Debugger's Default Interface'') to achieve the following:
Display the VSI DECwindows Motif for OpenVMS user interface on another workstation
Display the command interface in a DECterm window along with any program input/output (I/O)
Display the command interface and program I/O in separate DECterm windows
In all cases, before starting the debugger, verify that you have compiled and linked the modules of your program (as explained in Section 1.2, ''Preparing an Executable Image for Debugging'').
9.8.1. Starting the Debugger by Running a Program
You can start the debugger and also bring your program under debugger control in one step by
entering the DCL command RUN
(assuming the program was compiled and linked with the filespec/DEBUG
qualifier).
However, you cannot then use the Rerun or Run features explained in Section 9.3, ''Rerunning the Same Program from the Current Debugging Session'' and Section 9.4, ''Running Another Program from the Current Debugging Session'', respectively. To rerun the same program or run a new program under debugger control, you must first exit the debugger and start it again.
RUN
filespec to start the debugger. For
example:$ RUN EIGHTQUEENS
By default, the debugger starts up as shown in Figure 9.4, ''Source Display at Startup'', executing any user-defined initialization file and displaying the program's source code in the main window. The current-location pointer shows that execution is paused at the start of the main program. The debugger sets the language-dependent parameters to the source language of the main program unit.
For more information about debugger startup, see Section 9.1, ''Starting the Kept Debugger''.
9.8.2. Starting the Debugger After Interrupting a Running Program
You can bring a program that is executing freely under debugger control. This is useful if you suspect that the program might be in an infinite loop or if you see erroneous output.
Enter the DCL command
RUN /NODEBUGto execute the program without debugger control.filespecPress Ctrl/Y to interrupt the executing program. Control passes to the DCL command interpreter.
Enter the DCL command
DEBUGto start the debugger.
$ RUN/NODEBUG EIGHTQUEENS
⋮
Ctrl/Y
Interrupt
$ DEBUG
[starts debugger]At startup, the debugger displays the main window and executes any user-defined initialization file, and sets the language-dependent parameters to the source language of the module in which execution was interrupted.
Look at the main window.
Enter the
SET MODULES /CALLScommand at the command-entry prompt.Display the Call Stack menu on that window to identify the sequence of routine calls on the call stack. The routine at level 0 is the routine in which execution is currently paused(see Section 10.3.1, ''Determining Where Execution Is Currently Paused'').
When you start the debugger in this manner, you cannot then use the Rerun or Run features explained in Section 9.3, ''Rerunning the Same Program from the Current Debugging Session'' and Section 9.4, ''Running Another Program from the Current Debugging Session'', respectively. To rerun the same program or run a new program under debugger control, you must first exit the debugger and start it again.
For more information about debugger startup, see Section 9.1, ''Starting the Kept Debugger''.
9.8.3. Overriding the Debugger's Default Interface
By default, if your workstation is running VSI DECwindows Motif for OpenVMS, the debugger starts up in the
VSI DECwindows Motif for OpenVMS user interface, which is displayed on the workstation specified
by the VSI DECwindows Motif for OpenVMS application wide logical name
DECW$DISPLAY.
Display the debugger's VSI DECwindows Motif for OpenVMS user interface on another workstation
Display the debugger's command interface in a DECterm window along with any program I/O
Display the debugger's command interface and program I/O in separate DECterm windows
The logical name DBG$DECW$DISPLAY enables you to override the default
interface of the debugger. In most cases, there is no need to define
DBG$DECW$DISPLAY because the default is appropriate.
Section 9.8.3.4, ''Explanation of DBG$DECW$DISPLAY and DECW$DISPLAY'' provides more information about the logical names
DBG$DECW$DISPLAY and DECW$DISPLAY.
9.8.3.1. Displaying the Debugger's VSI DECwindows Motif for OpenVMS User Interface on Another Workstation
- Enter a logical definition with the following syntax in the DECterm window from which you plan to run the program:
DEFINE/JOB DBG$DECW$DISPLAY
workstation_pathnameThe path name for the workstation where the debugger's VSI DECwindows Motif for OpenVMS user interface is to be displayed is
workstation_pathname. See the description of theSET DISPLAYcommand in the VSI OpenVMS DCL Dictionary: N–Z for the syntax of this path name.It is recommended that you use a job definition. If you use a process definition, it must not have the
CONFINEattribute. Run the program from that DECterm window. The debugger's VSI DECwindows Motif for OpenVMS user interface is now displayed on the workstation specified by
DBG$DECW$DISPLAY. The application's windowing interface is displayed on the workstation where it is normally displayed.Use client/server mode (see Section 9.9.2, ''Starting the Server'').
9.8.3.2. Displaying the Debugger's Command User Interface in a DECterm Window
- Enter the following definition in the DECterm window from which you plan to start the debugger:
$ DEFINE/JOB DBG$DECW$DISPLAY " "
You can specify one or more spaces between the quotation marks. You should use a job definition for the logical name. If you use a process definition, it must not have the
CONFINEattribute. Start the debugger from that DECterm window (see Section 9.1, ''Starting the Kept Debugger''). The debugger's command interface is displayed in the same window.
$ DEFINE/JOB DBG$DECW$DISPLAY " "
$ DEBUG/KEEP
Debugger Banner and Version Number
DBG>You can now bring your program under debugger control as explained in Section 9.1, ''Starting the Kept Debugger''.
9.8.3.3. Displaying the Command Interface and Program Input/Output in Separate DECterm Windows
The program's input/output (I/O) is displayed in the window from which you start the debugger.
The debugger's I/O, including any screen-mode display, is displayed in the separate window.
The effect is the same as entering the SET MODE SEPARATE
command at the DBG> prompt on a workstation running VWS
rather than VSI DECwindows Motif for OpenVMS. (The SET MODE SEPARATE
command is not valid when used in a DECterm window.)
- Create the command procedure
SEPARATE_WINDOW.COMshown in Example 9.1, ''Command Procedure SEPARATE_WINDOW.COM''.Example 9.1. Command Procedure SEPARATE_WINDOW.COM $ ! Simulates effect of SET MODE SEPARATE from a DECterm window $ ! $ CREATE/TERMINAL/NOPROCESS - /WINDOW_ATTRIBUTES=(TITLE="Debugger", - ICON_NAME="Debugger", ROWS=40)- /DEFINE_LOGICAL=(TABLE=LNM$JOB, DBG$INPUT, DBG$OUTPUT) $ ALLOCATE DBG$OUTPUT $ EXIT$ ! $ ! The command CREATE/TERMINAL/NOPROCESS creates a DECterm $ ! window without a process. $ ! $ ! The /WINDOW_ATTRIBUTES qualifier specifies the window's $ ! title (Debugger), icon name (Debugger), and the number $ ! of rows in the window (40). $ ! $ ! The /DEFINE_LOGICAL qualifier assigns the logical names $ ! DBG$INPUT and DBG$OUTPUT to the window, so that it becomes $ ! the debugger input and output device. $ ! $ ! The command ALLOCATE DBG$OUTPUT causes the separate window $ ! to remain open when you end the debugging session. - Execute the command procedure as follows:
$ @SEPARATE_WINDOW %DCL-I-ALLOC, _MYNODE$TWA8: allocated
A new DECterm window is created with the attributes specified in
SEPARATE_WINDOW.COM. Follow the steps in Section 9.8.3.2, ''Displaying the Debugger's Command User Interface in a DECterm Window'' to display the debugger's command interface. The interface is displayed in the new window.
You can now enter debugger commands in the debugger window. Program I/O is displayed in the DECterm window from which you started the debugger.
When you end the debugging session with the
EXITcommand, control returns to the DCL prompt in the program I/O window but the debugger window remains open.- To display the debugger's command interface in the same window as the program's I/O (as in Section 9.8.3.2, ''Displaying the Debugger's Command User Interface in a DECterm Window''), enter the following commands:
$ DEASSIGN/JOB DBG$INPUT $ DEASSIGN/JOB DBG$OUTPUT
The debugger window remains open until you close it explicitly.
9.8.3.4. Explanation of DBG$DECW$DISPLAY and DECW$DISPLAY
By default, if your workstation is running VSI DECwindows Motif for OpenVMS, the debugger starts up in the
VSI DECwindows Motif for OpenVMS user interface, which is displayed on the workstation
specified by the VSI DECwindows Motif for OpenVMS application wide logical name
DECW$DISPLAY.DECW$DISPLAY is defined in the job table by
File View or DECterm and points to the display device for the
workstation.
For information about DECW$DISPLAY, see the description of the DCL commands
SET DISPLAY and SHOW DISPLAY in the
VSI OpenVMS DCL Dictionary: N–Z.
The logical name DBG$DECW$DISPLAY is the debugger-specific equivalent of
DECW$DISPLAY.DBG$DECW$DISPLAY is similar to the
debugger-specific logical names DBG$INPUT and
DBG$OUTPUT. These logical names enable you to reassign
SYS$INPUT and SYS$OUTPUT,
respectively, to specify the device on which debugger input and output are to
appear.
The default user interface of the debugger results when DBG$DECW$DISPLAY is
undefined or has the same translation as DECW$DISPLAY. By
default, DBG$DECW$DISPLAY is undefined.
DECW$DISPLAY and DBG$DECW$DISPLAY is
as follows:If the logical name
DBG$DECW$DISPLAYis defined, then use it. Otherwise, use the logical nameDECW$DISPLAY.Translate the logical name. If its value is not null (if the string contains characters other than spaces), the VSI DECwindows Motif for OpenVMS user interface is displayed on the specified workstation. If the value is null (if the string consists only of spaces), the command interface is displayed in the DECterm window.
$ DEFINE DBG$DECW$DISPLAY "WSNAME::0" $ SET DISPLAY/CREATE/NODE=WSNAME
where WSNAME is the node name of your workstation.
9.9. Starting the Motif Debug Client
The OpenVMS Debugger Version 7.2 features a client/server interface that allows you to debug programs running on OpenVMS on a VAX or Alpha CPU from a client interface running on the same or separate system.
The debugger client/server retains the functionality of the kept debugger, but splits the debugger into two components:the debug server and the debug client. The debug server runs on an OpenVMS system, and is just like the kept debugger without the user interface. The debug client contains the user interface, and runs on an OpenVMS system using VSI DECwindows Motif for OpenVMS, or on a PC running Microsoft Windows 95 or Microsoft Windows NT.
9.9.1. Software Requirements
The debug server requires OpenVMS Version 7.2 or later.
OpenVMS Version 7.2 or later, along with VSI DECwindows Motif for OpenVMS Version 1.2-4
Microsoft Windows 95
Microsoft Windows NT Version 3.51 or later (Intel or Alpha)
A TCP/IP stack
DCE RPC
Note
If you are running TCP/IP Services for OpenVMS (UCX) Version 4.1, you must have ECO2 installed. You can also run a later version of UCX.
The OpenVMS Version 7.2 installation procedures automatically install DCE RPC.
9.9.2. Starting the Server
You can start the debug server after logging in directly to the OpenVMS system, or you may find it more convenient to log in remotely with a product such as eXcursion, or an emulator such as Telnet.
$ DEBUG/SERVER
The server displays its network binding strings. The server port number is enclosed in square brackets ([]). For example:
$ DEBUG/SERVER%DEBUG-I-SPEAK: TCP/IP: YES, DECnet: YES, UDP: YES %DEBUG-I-WATCH: Network Binding: ncacn_ip_tcp:16.32.16.138[1034] %DEBUG-I-WATCH: Network Binding: ncacn_dnet_nsp:19.10[RPC224002690001] %DEBUG-I-WATCH: Network Binding: ncadg_ip_udp:16.32.16.138[1045] %DEBUG-I-AWAIT: Ready for client connection...
|
Network Transport |
Network Binding String Prefix |
|---|---|
|
TCP/IP |
ncacn_ip_tcp |
|
DECnet |
ncacn_dnet_nsp |
|
UDP |
ncadg_ip_udp |
Note
You can usually identify the server using only the node name and the port
number. For example, nodnam[1034].
Messages and program output appear by default in the window in which you start the server. You can redirect program output to another window as required.
$ debug/server %LIB-E-ACTIMAGE, error activating image disk:[SYSn.SYSCOMMON.][SYSLIB]DTSS$SHR.EXE; -RMS-E-FNF, file not found
This indicates that DCE is installed but not configured.
9.9.3. Primary Clients and Secondary Clients
The debugger client/server interface allows more than one client to be connected to the same server. This allows team debugging, classroom sessions, and other applications.
The primary client is the first client to connect to the server. A secondary client is an additional client that has connected to the same server. The primary client controls whether or not any secondary clients can connect to the server.
Section 9.9.4, ''Starting the Motif Client'' describes how to specify the number of secondary clients allowed in a session.
9.9.4. Starting the Motif Client
$ DEBUG/CLIENT
To establish a session from the Motif debug client, click on Server Connection from the File menu. The Server Connection dialog displays, in the Connection list, the default network binding string. This string is based on the last string you entered, or the node on which the client is running. There is not necessarily a server associated with the default binding string. Figure 9.6, ''Debug Server Connection Dialog'' shows the Server Connection dialog.
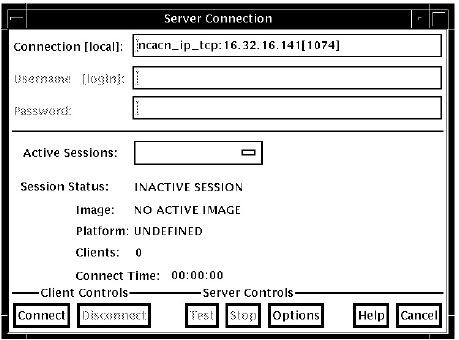
Connect to the selected server to begin and activate a new session
Disconnect from a session
Test whether the session is still available
Stop the server
Cancel the connection operation and dismiss the dialog
In addition, the Options button invokes the Server Options dialog, which allows you to select the network transport to be used (see Section 11.5.1, ''Choosing a Transport'').
The Server Options dialog also allows you to select the number of secondary clients (0-31) allowed for a new session.
Figure 9.7, ''Server Options Dialog'' shows the Server Options dialog.
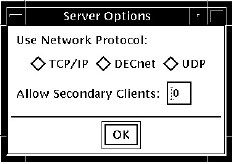
Open the File menu.
Click Server Connection.
Enter the server network binding string in the Connection field, or select the default string.
Click Options.
In the Server Options dialog, click on the network transport: TCP/IP, DECnet, or UDP.
In the Server Options dialog. Select the number of secondary clients (0-31) to be allowed.
Click OK to dismiss the Server Options dialog.
In the Server Connection dialog, click Connect.
You can establish connections to an unlimited number of servers by repeating the sequence above and specifying the new network binding string each time.
9.9.5. Switching Between Sessions
Each time you connect to a server and initiate a session, the session is listed in the Active Sessions list in the Server Connection dialog (see Figure 9.8, ''Active Sessions List''). You can switch back and forth between sessions. Each time you switch to a new session, the debugger updates the contents of any open debugger displays with the new context.
Open the File menu.
Click Server Connection.
Click the Active Sessions list to display the list of active sessions.
Double click the required session in the Active Sessions list. This selects the session as the current session, dismisses the Server Connection dialog, and updates the debugger displays with the current context.
Open the File menu.
Specify the network binding string of the session.
Click Disconnect.
Click Options.
In the Server Options dialog, click on the network transport: TCP/IP, DECnet, or UDP.
In the Server Options dialog, select the number of secondary clients (0-31) to be allowed.
Click OK to dismiss the Server Options dialog.
In the Server Connection dialog, click Connect.
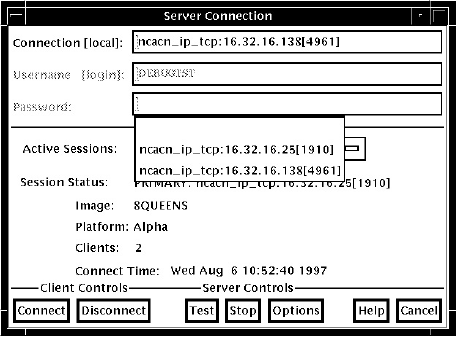
9.9.6. Closing a Client/Server Session
Click on Exit Debug? on the File menu to invoke the Confirm Exit dialog. Figure 9.9, ''Confirm Exit Dialog'' shows the Confirm Exit dialog.
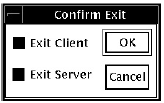
To terminate both the client and the server (default) click OK.
To dismiss the Confirm Exit dialog without taking any action, click Cancel.
- To terminate only the debug client, perform the following steps:
Click Exit Server.
Click OK.
- To terminate only the debug server, perform the following steps:
Click Exit Client.
Click OK.
If you do not terminate the debug server, you can connect to the server from another debug client. If you do not terminate the client, you can connect to another server for which you know the network binding string.
Chapter 10. Using the Debugger
Display the source code of your program (Section 10.1, ''Displaying the Source Code of Your Program'')
Edit your program under debugger control (Section 10.2, ''Editing Your Program'')
Execute your program under debugger control (Section 10.3, ''Executing Your Program'')
Suspend execution with breakpoints (Section 10.4, ''Suspending Execution by Setting Breakpoints'')
Examine and manipulate program variables (Section 10.5, ''Examining and Manipulating Variables'')
Access program variables (Section 10.6, ''Accessing Program Variables'')
Display and modify values stored in registers (Section 10.7, ''Displaying and Modifying Values Stored in Registers'')
Display the decoded instruction stream of your program (Section 10.8, ''Displaying the Decoded Instruction Stream of Your Program'')
Debug tasking programs (Section 10.9, ''Debugging Tasking (Multithread) Programs'')
Customize the debugger's VSI DECwindows Motif for OpenVMS user interface (Section 10.10, ''Customizing the Debugger's VSI DECwindows Motif for OpenVMS Interface'')
The chapter describes window actions and window menu choices, but you can perform most common debugger operations by choosing items from context-sensitive pop-up menus. To access these menus, click MB3 while the mouse pointer is in the window area.
You can also enter commands at the VSI DECwindows Motif for OpenVMS command prompt. For information about entering debugger commands, see Section 8.3, ''Entering Commands at the Prompt''.
For the source code of programs EIGHTQUEENS.EXE and
8QUEENS.EXE, shown in the figures of this chapter, see Appendix E, "EIGHTQUEENS.C".
10.1. Displaying the Source Code of Your Program
The debugger displays the source code of your program in the main window (see Figure 10.1, ''Source Display'').
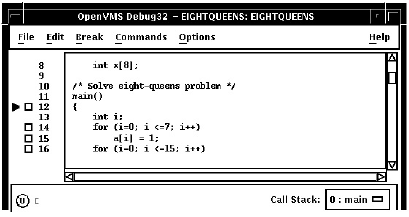
Whenever execution is suspended (for example, at a breakpoint), the debugger updates the source display by displaying the code surrounding the point at which execution is paused. The current-location pointer, to the left of the source code, marks which line of code will execute next. (A source line corresponds to one or more programming-language statements, depending on the language and coding style.)
By default, the debugger displays compiler-generated line numbers to the left of the source code. These numbers help identify breakpoints, which are listed in the breakpoint view (see Section 10.4.4, ''Identifying the Currently Set Breakpoints''). You can choose not to display line numbers so that more of the source code can show in the window. To hide or display line numbers, toggle Display Line Numbers from the File menu on the main window.
The Call Stack menu, between the source view and the push button view, shows the name of the routine whose source code is displayed.
The current-location pointer is normally filled in as shown in Figure 10.1, ''Source Display''. It is cleared if the displayed code is not that of the routine in which execution is paused (see Section 10.1.3, ''Making Source Code Available for Display'' and Section 10.6.2, ''Setting the Current Scope Relative to the Call Stack'').
You can use the scroll bars to show more of the source code. However, you can scroll vertically through only one module of your program at a time. (A module corresponds generally to a compilation unit. With many programming languages, a module corresponds to the contents of a source file. With some languages, such as Ada, a source file might contain one or more modules.)
The following sections explain how to display source code for other parts of your program so that you can set breakpoints in various modules, and so on. Section 10.1.3, ''Making Source Code Available for Display'' explains what to do if the debugger cannot find source code for display. Section 10.6.2, ''Setting the Current Scope Relative to the Call Stack'' explains how to display the source code associated with routines that are currently active on the call stack.
After navigating the main window, you can redisplay the location at which execution is paused by clicking on the Call Stack menu.
If your program was optimized during compilation, the source code displayed might not reflect the actual contents of some program locations (see Section 1.2, ''Preparing an Executable Image for Debugging'').
10.1.1. Displaying the Source Code of Another Routine
Choose Browse Sources from the File menu on the main window (see Figure 10.2, ''Displaying Source Code of Another Routine'').
Select SYMBOLIC display the names of all modules linked in the image. Select ALL to display the names of only those modules for which the debugger has symbolic information.
The Source Browser dialog box displays the name of your executable image, which is highlighted, and the class of shareable images linked with it (SYMBOLIC or ALL). The name of a linked image is dimmed if no symbolic information is available for that image.
Double click on the name of your executable image. The names of the modules in that image are displayed (indented) under the image name.
Double click on the name of the module containing the routine of interest. The names of the routines in that module are displayed (indented) under the module name, and the Display Source button is now highlighted.
Click on the name of the routine whose source code you want to display.
Click on the Display Source push button. The debugger displays in the source view the source code of the target routine, along with an empty breakpoint button to the left of the source code. If the instruction view is open, this display is updated to show the machine code of the target routine.
Section 10.6.2, ''Setting the Current Scope Relative to the Call Stack'' describes an alternative way to display routine source code for routines currently active on the call stack.
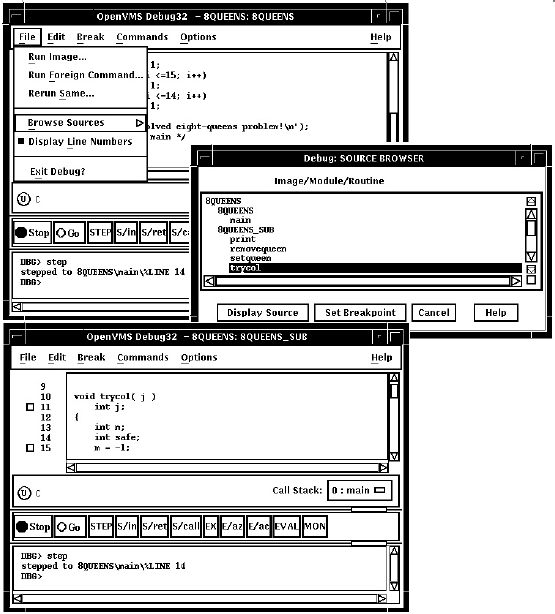
10.1.2. Displaying the Source Code of Another Module
Choose Browse Sources from the File menu on the main window.
Select SYMBOLIC display the names of all modules linked in the image. Select ALL to display the names of only those modules for which the debugger has symbolic information.
The Source Browser dialog box displays the name of your executable image, which is highlighted, and the class of shareable images linked with it (SYMBOLIC or ALL). The names of the shareable images are dimmed if no symbolic information is available for them.
Double click on the name of your executable image. The names of the modules in that image are displayed (indented) under the image name.
Click on the name of the module whose source code you want to display. The Display Source button is now highlighted.
Click on Display Source. The source display in the main window now shows the routine's source code. (If the instruction display in the instruction view is open, this display is updated to show the routine's instruction code.)
10.1.3. Making Source Code Available for Display
Execution might be paused within a module of your program that was compiled or linked without the debug option (see Section 1.2, ''Preparing an Executable Image for Debugging'').
Execution might be paused within a system or library routine for which no symbolic information is intended to be available. In such cases you can quickly return execution to the calling routine by clicking one or more times on the S/ret button in the push button view (see Section 10.3.5, ''Returning from a Called Routine'').
The source file might have been moved to a different directory after it was compiled. Section 10.1.4, ''Specifying the Location of Source Files'' explains how to tell the debugger whereto look for source files.
If the debugger cannot find source code for display, it tries to display the source code for the next routine down on the call stack for which source code is available. If the debugger can display source code for such a routine, the current-location pointer is moved to point to the source line to which execution returns in the calling routine.
10.1.4. Specifying the Location of Source Files
Information about the characteristics and the location of source files
is embedded in the debug symbol table of your program. If a source file has been
moved to a different directory since compile time, the debugger might not find the
file. To direct the debugger to your source files, use the SET
SOURCE command at the DBG> prompt (see Section 6.2, ''Specifying the Location of Source Files'').
10.2. Editing Your Program
The debugger provides a simple text editor you can use to edit your source files while debugging your program (see Figure 10.3, ''Editor Window'').
EDIT command at the DBG> prompt
in the command view (see EDIT in the Command Reference Dictionary of
this manual).Note
When you enter an EDIT command at the command
prompt, the debugger uses the DECterm window that invoked the debugging session
as the user-defined-editor window (as opposed to the debugger's built-in editor,
which is hardwired to the COMMANDS EDIT FILE pull-down menu).
This behavior constitutes a tradeoff that allows a more flexible choice of
editors. If you inadvertently exit this DECterm window using FILE
EXIT or MWM Close, the debugging session terminates abruptly,
having lost its parent window.
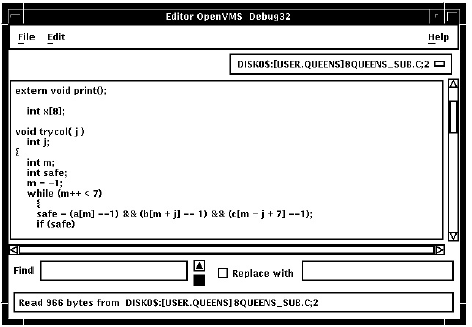
To invoke the editor, choose the Edit File item in the Commands menu on the main window. By default, the editor opens a buffer and displays the module currently displayed in the source view. The buffer is named with the file specification of the file in the buffer. If no file is displayed in the source view, the editor displays an empty text buffer, called main_buffer. The buffer name appears in the buffer menu, which is just under the menu bar of the editor view.
The editor allows you to create any number of text buffers by choosing New (for empty text buffers) or Open (for existing files) from the File menu. The name of each text buffer appears in the buffer menu. You can cut, copy, and paste text from buffer to buffer by choosing items from the Edit menu and selecting buffers from the buffer menu.
You can perform forward and backward search and replace operations by entering strings in the Find and Replace with fields and clicking on a directional arrow. You can perform a repeated search for the string by continuing to press the Return key. You can also continue a search by choosing the Find/Replace Next or Find/Replace Previous items in the Edit menu.
To save the file, choose the Save or Save As... items from the File menu. If you do not save your corrections before closing a modified buffer or exiting the debugger, the debugger displays a warning message.
Select a DECterm window separate from that in which the debugger is running.
Recompile the program.
Relink the program.
Return to the debugging session.
Choose the Run Image... item in the File menu on the main window.
10.3. Executing Your Program
Determine where execution is currently paused within your program
Start or resume program execution
Execute the program one source line at a time, step by step
For information about rerunning your program or running another program from the current debugging session, see Section 9.3, ''Rerunning the Same Program from the Current Debugging Session'' and Section 9.4, ''Running Another Program from the Current Debugging Session''.
10.3.1. Determining Where Execution Is Currently Paused
If the current-location pointer is not visible in the main window, click on the Call Stack menu of that window to display the pointer (see Figure 10.1, ''Source Display'').
- Look at the current-location pointer:
If the pointer is filled in, it marks the source line whose code will execute next (see Section 10.1, ''Displaying the Source Code of Your Program''). The Call Stack menu always shows the routine at scope level 0 (where execution is paused) when the pointer is filled in.
- If the pointer is cleared, the source code displayed is that of a calling routine, and the pointer marks the source line to which execution returns in that routine:
If the Call Stack menu shows level 0, source code is not available for display for the routine in which execution is paused (see Section 10.1.3, ''Making Source Code Available for Display'').
If the Call Stack menu shows a level other than 0, you are displaying the source code for a calling routine (see Section 10.6.2, ''Setting the Current Scope Relative to the Call Stack'').
To list the sequence of routine calls that are currently active on the call stack, click on the Call Stack menu. Level 0 denotes the routine in which execution is paused, level 1 denotes the calling routine, and so on.
10.3.2. Starting or Resuming Program Execution
To start program execution or resume execution from the current location, click on the Go button in the push button view (see Figure 8.3, ''Default Buttons in the Push Button View Table'').
To test for an infinite loop. In this case, you start execution; then, if your program does not terminate and you suspect that it is looping, click on the Stop button. The main window will show where you interrupted program execution, and the Call Stack menu will identify the sequence of routine calls at that point (see Section 10.3.1, ''Determining Where Execution Is Currently Paused'').
To execute your program directly to a particular location. In this case, you first set a breakpoint at the location (see Section 10.4, ''Suspending Execution by Setting Breakpoints'') and then start execution.
The program completes execution.
A breakpoint is reached (including a conditional breakpoint whose condition is true).
A watch point is triggered.
An exception is signaled.
You click on the Stop button on the push button view.
Whenever the debugger suspends execution of the program, the main window display is updated and the current-location pointer marks which line of code will execute next.
10.3.3. Executing Your Program One Source Line at a Time
To execute one source line of your program, click on the STEP button in the push button view or enter the
STEP command in the command view. This debugging technique
(called stepping) is one of the most commonly used.
After the line executes, the source view is updated and the current-location pointer marks which line of code will execute next.
A source line can consist of one or more programming language elements depending on the language and coding style used.
When you click on the STEP button, the debugger executes one executable line and suspends execution at the start of the next executable line, skipping over any intervening non executable lines.
Executable lines are those for which instructions were generated by the compiler (for example, lines with routine call or assignment statements). Executable lines have a button to their left in the main window.
Examples of non executable lines are comment lines or lines with variable declarations without value assignments. Non executable lines do not have a button to their left in the main window.
Keep in mind that if you optimized your code at compilation time, the source code displayed might not reflect the code that is actually executing (see Section 1.2, ''Preparing an Executable Image for Debugging'').
10.3.4. Stepping into a Called Routine
When program execution is paused at a routine call statement, clicking on the STEP button typically executes the called routine in one step (depending on the coding style used), and the debugger suspends execution at the next source line in the calling routine(assuming no breakpoint was set within the called routine). This enables you to step through the code quickly without having to trace execution through any called routines (some of which might be system or library routines). This is called stepping over called routines.
Suspend execution at the routine call statement, for example, by setting a breakpoint (see Section 10.4, ''Suspending Execution by Setting Breakpoints'') and then clicking on the Go button in the push button view.
When execution is paused at the call statement, click on the S/in button in the push button view, or enter the
STEP/INTOcommand at theDBG>prompt. This moves execution just past the start of the called routine.
Once execution is within the called routine, click on the STEP button to execute the routine line by line.
Clicking on the S/in button when execution is not paused at a routine call statement is the same as clicking on the STEP button.
10.3.5. Returning from a Called Routine
When execution is suspended within a called routine, you can execute
your program directly to the end of that routine by clicking on the
S/ret button in the push button view, or enter the
STEP/RETURN command at the DBG>
prompt.
The debugger suspends execution just before the routine's return instruction executes. At that point, the routine's call frame has not been deleted from the call stack, so you can still get the values of variables local to that routine, and so on.
You can also use the S/call button in the push button view (or enter the
STEP/CALL command at the DBG> prompt) to
execute the program directly to the next Return or Call instruction.
The S/ret button is particularly useful if you have inadvertently stepped into a system or library routine (see Section 10.1.3, ''Making Source Code Available for Display'').
10.4. Suspending Execution by Setting Breakpoints
A breakpoint is a location in your program at which you want execution to stop so that you can check the current value of a variable, step into a routine, and so on.
Specific source lines
Specific routines (functions, subprograms, and so on)
Exceptions signaled during the execution of your program
Note
If you are stopped at a breakpoint in a routine that has control of the mouse pointer by a Pointer Grab or a Keyboard Grab, your workstation will hang.
To work around this problem, debug your program using two workstations. For more information, see Section 9.8.3.1, ''Displaying the Debugger's VSI DECwindows Motif for OpenVMS User Interface on Another Workstation''.
You can set a conditional breakpoint.The debugger suspends execution at a conditional breakpoint only when a specified relational expression is evaluated as true.
You can set an action breakpoint. The debugger executes one or more specified system-specific commands when it reaches the breakpoint.
You can set a breakpoint that is both a conditional and action breakpoint.
The following sections explain these breakpoint options.
10.4.1. Setting Breakpoints on Source Lines
You can set a breakpoint on any source line that has a button to its left in the source display. These are the lines for which the compiler has generated executable code (routine declarations, assignment statements, and so on).
Find the source line on which you want to set a breakpoint (see Section 10.1, ''Displaying the Source Code of Your Program'').
Click on the button to the left of that line. (The breakpoint is set when the button is filled in.) The breakpoint is set at the start of the source line - that is, on the first machine-code instruction associated with that line.
Figure 10.4, ''Setting a Breakpoint on a Source Line'' shows that a breakpoint has been set on the start of line 37.
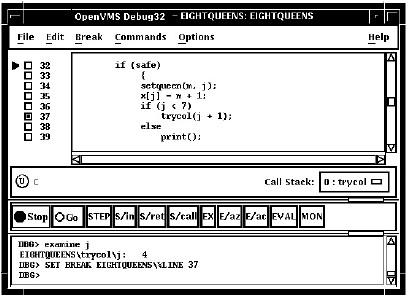
10.4.2. Setting Breakpoints on Routines with Source Browser
Setting a breakpoint on a routine enables you to move execution directly to the routine and inspect the local environment.
Choose Browse Sources from the File menu on the main window (see Figure 10.2, ''Displaying Source Code of Another Routine'').
Select SYMBOLIC to display the names of all modules linked in the image. Select ALL to display the names of only those modules for which the debugger has symbolic information.
The Source Browser dialog box displays the name of your executable image, which is highlighted, and the class of shareable images linked with it (SYMBOLIC or ALL). The name of a linked image is dimmed if no symbolic information is available for that image.
Double click on the name of the executable image. The names of the modules in that image are displayed (indented) under the image name.
Double click on the name of the target module. The names of the routines in that module are displayed (indented) under the module name (see Figure 10.5, ''Setting a Breakpoint on a Routine'').
Double click on the name of the routine on which to set a breakpoint. The debugger echoes the results of your
SET BREAKPOINTcommand on the command line in the command view.Alternatively, click once on the name of the routine, then click the Set Breakpoint button in the Source Browser view. The debugger echoes the results of your
SET BREAKPOINTcommand on the command line in the command view.
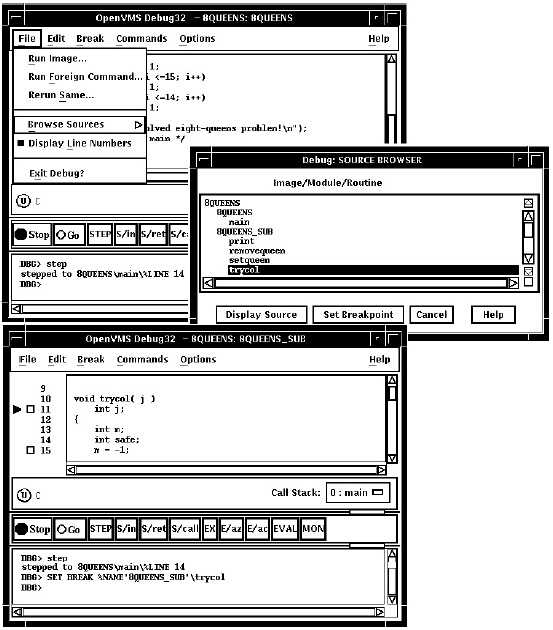
10.4.3. Setting an Exception Breakpoint
An exception breakpoint suspends execution when an exception is signaled and before any exception handler declared by your program executes. This enables you to step into the exception handler (if one is available) to check the flow of control.
To set an exception breakpoint, choose On Exception from the Break menu on the main window or the optional views window.
10.4.4. Identifying the Currently Set Breakpoints
Scroll through your source code and note the lines whose breakpoint button is filled in. This method can be time consuming and also does not show which breakpoints were set and then deactivated (see Section 10.4.5, ''Deactivating, Activating, and Canceling Breakpoints'').
Choose Views... from the Options menu on the main window or the optional views window. When the Views dialog box appears, click on Breakpoint View to display the breakpoint view (see Figure 8.4, ''Debugger Main Window and the Optional Views Window'').
The breakpoint view lists a module name and line number for each breakpoint (see Section 10.1, ''Displaying the Source Code of Your Program''). A filled-in button next to the breakpoint identification indicates that the breakpoint is activated. A cleared button indicates that the breakpoint is deactivated.
Enter the
SHOW BREAKcommand at theDBG>prompt in the command view. The debugger lists all the breakpoints that are currently set, including specifications for conditional breakpoints, and commands to be executed at action breakpoints.
10.4.5. Deactivating, Activating, and Canceling Breakpoints
After a breakpoint is set, you can deactivate, activate, or delete it.
To deactivate a specific breakpoint, clear the button for that breakpoint in the main window or in the breakpoint view.
In the breakpoint view, you can also choose Toggle from the Break menu, if the breakpoint is currently activated.
To deactivate all breakpoints, choose Deactivate All from the Break menu.
To activate a breakpoint, fill in the button for that breakpoint in the main window or in the breakpoint view.
In the breakpoint view, you can also choose Toggle from the Break menu, if the breakpoint is currently deactivated.
To activate all breakpoints, choose Activate All from the Break menu.
To cancel a specific breakpoint, choose Cancel from the Break menu on the optional views window.
To cancel all breakpoints, choose Cancel All from the Break menu.
10.4.6. Setting a Conditional Breakpoint
The debugger suspends execution of the program at a conditional breakpoint only when a specified expression is evaluated as true. The debugger evaluates the conditional expression when program execution reaches the breakpoint and ignores the breakpoint if the expression is not true.
Display the source line on which you want to set the conditional breakpoint (see Section 10.1, ''Displaying the Source Code of Your Program'').
- Do one of the following:
Press Ctrl/MB1 on the button to the left of the source line. This displays the Set/Modify Breakpoint dialog box, showing the source line you selected in the Location: field (see Figure 10.6, ''Setting a Conditional Breakpoint'').
Choose the Set or Set/Modify item from the Break menu. When the Set/Modify Breakpoint dialog box displays, enter the source line in the Location: field.
Enter a relational expression in the Condition: field of the dialog box. The expression must be valid in the source language. For example,
a[3] == 0is a valid relational expression in the C language.Click on OK. The conditional breakpoint is now set. The debugger indicates that a breakpoint is conditional by changing the shape of the breakpoint's button from a square to a diamond.
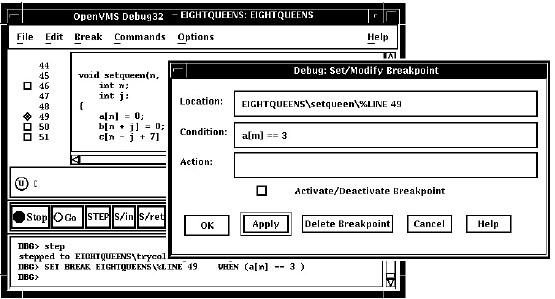
Choose Views... from the Options menu on the main window or optional views window. When the Views dialog box appears, click on Breakpoint View to display the breakpoint view.
- From the breakpoint view, do one of the following:
Press Ctrl/MB1 on the button to the left of the listed breakpoint.
Click on a breakpoint listed in the view, and choose the Set/Modify item from the Break menu.
Follow steps 3 and 4 of the previous procedure, as appropriate.
10.4.7. Setting an Action Breakpoint
When a program reaches an action breakpoint, the debugger suspends execution of the program and executes a specified list of commands.
Display the source line on which you want to set the action breakpoint (see Section 10.1, ''Displaying the Source Code of Your Program'').
- Do one of the following:
Press Ctrl/MB1 on the button to the left of the source line. This displays the Set/Modify Breakpoint dialog box, showing the source line you selected in the Location: field (see Figure 10.6, ''Setting a Conditional Breakpoint'').
Choose the Set or Set/Modify item from the Break menu. When the Set/Modify Breakpoint dialog box displays, enter the source line in the Location: field.
- Enter one or more debugger commands in the Action: field of the dialog box. For example:
DEPOSIT x[j] = 3; STEP; EXAMINE a
Click on OK. The action breakpoint is now set (see Figure 10.7, ''Setting an Action Breakpoint''.)
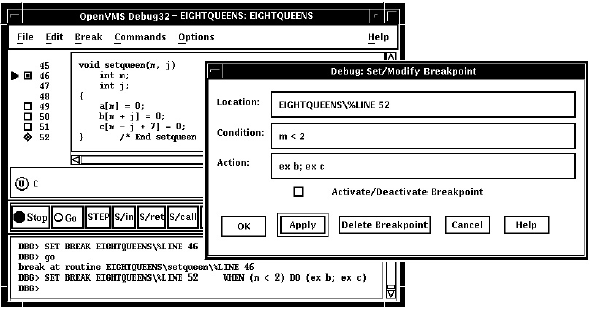
Choose Views... from the Options menu on the main window or optional views window, then click on Breakpoint View when the Views dialog box appears.
- From the breakpoint view, do one of the following:
Press Ctrl/MB1 on the button to the left of the listed breakpoint.
Click on a breakpoint listed in the view, and choose the Set/Modify item in the Break menu.
Follow steps 3 and 4 of the previous procedure, as appropriate.
10.5. Examining and Manipulating Variables
Select variable names from windows
Display the value of a variable
Monitor a variable
Watch a variable
Change the value of a variable
See Section 10.6, ''Accessing Program Variables'', which also applies to all operations on variables.
10.5.1. Selecting Variable Names from Windows
Use the following techniques to select variable names from windows for the operations described in the sections that follow (see Section 10.5.2, ''Displaying the Current Value of a Variable'' for examples).
To specify a scalar (non aggregate) variable, such as an integer, real, Boolean, or enumeration type, select the variable's name.
To specify an entire aggregate, such as an array or structure (record), select the variable's name.
- To specify a single element of an aggregate variable, select the entity using the language syntax. For example:
The string
arr2[7]specifies element 7 of arrayarr2in the C language.The string
employee.addressspecifies componentaddressof record (structure)employeein the Pascal language.
To specify the object designated by a pointer variable, select the entity following the language syntax. For example, in the C language, the string
*int_pointspecifies the object designated by pointerint_point.
In any window, to select a string delimited by blank spaces, use the standard VSI DECwindows Motif for OpenVMS word selection technique: position the pointer on that string and then double click MB1.
In any window, to select an arbitrary character string, use the standard VSI DECwindows Motif for OpenVMS text-selection technique:position the pointer on the first character, press and hold MB1 while dragging the pointer over the string and then release MB1.
In the debugger source display, you also have the option of using language-sensitive text selection. To select a string delimited by language-dependent identifier boundaries, position the pointer on that string and press Ctrl/MB1.
For example, suppose the source display contains the character stringarr2[m], then:To select
arr2, position the pointer onarr2and press Ctrl/MB1.To select
m, position the pointer onmand press Ctrl/MB1.
You can change the key sequence for language-sensitive text selection as explained in Section 10.10.4.2, ''Defining the Key Sequence for Language-Sensitive Text Selection''.
10.5.2. Displaying the Current Value of a Variable
Find and select the variable name in a window as explained in Section 10.5.1, ''Selecting Variable Names from Windows''.
Click on theEX button in the push button view. The debugger displays the variable and its current value in the command view. The debugger displays the value of a variable in the current scope, which might not be the same as the source location you were intending.
Figure 10.8, ''Displaying the Value of an Integer Variable'', Figure 10.9, ''Displaying the Value of an Array Aggregate'', and Figure 10.10, ''Displaying the Value of an Array Element'' show how to display the value of an integer variable, array aggregate, and array element, respectively.
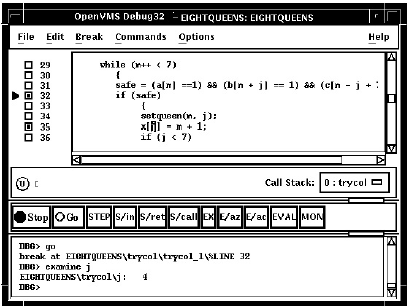
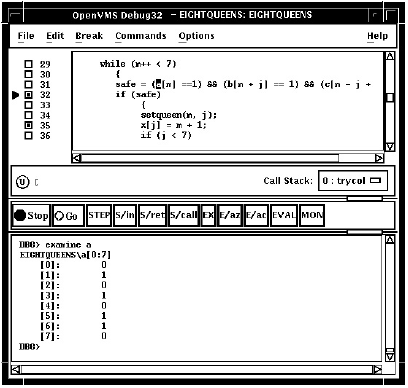
Find and select the variable name in a window as explained in Section 10.5.1, ''Selecting Variable Names from Windows''.
Choose Examine... in the Commands menu in the main window. The Examine dialog box appears with the name selected in the Variable/Expression field.
Choose the default, int, long, quad, short, or char* item from the Typecast menu within the dialog box.
Choose the default, hex, octal, decimal, or binary item from the Output Radix menu within the dialog box.
Click on OK.
The value, altered to your specification, appears in the command view.
Figure 10.11, ''Typecasting the Value of a Variable'' shows that the variable j has been typecast as long.
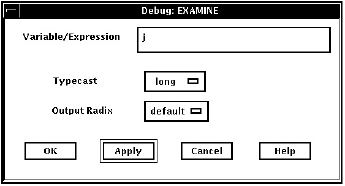
10.5.3. Changing the Current Value of a Variable
Find and select the variable name in a window as explained in Section 10.5.1, ''Selecting Variable Names from Windows''.
Choose Deposit... from the Commands menu in the main window. The Deposit dialog box appears with the name selected in the Variable field.
Enter the new value in the Value field.
Choose the default, hex, octal, decimal, or binary item from the Input Radix menu within the dialog box.
Click on OK.
The new value, altered to your specification, appears in the command view and is assigned to the variable.
Figure 10.12, ''Changing the Value of a Variable'' shows a new value for the variable safe.
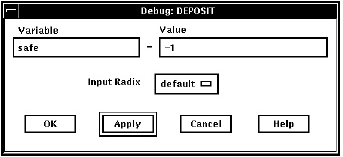
10.5.4. Monitoring a Variable
Find and select the variable name in a window as explained in Section 10.5.1, ''Selecting Variable Names from Windows''.
- Click on the MON button in the push button view. The debugger:
Displays the monitor view (if it is not displayed)
Puts the selected variable's name, along with its qualifying path name, in the Monitor Expression column
Puts the value of the variable in the Value/Deposit column
Puts a cleared button in the Watched column (see Section 10.5.5, ''Watching a Variable'').
You can typecast the output value when monitoring variables by choosing the Typecast item in the Monitor menu.
Choose Change Radix in the Monitor menu to change the output radix for a selected monitored element.
Choose the Change All Radix in the Monitor menu to change the output radix for all subsequently monitored elements.
To remove a monitored element from the monitor view, choose Remove from the Monitor menu.
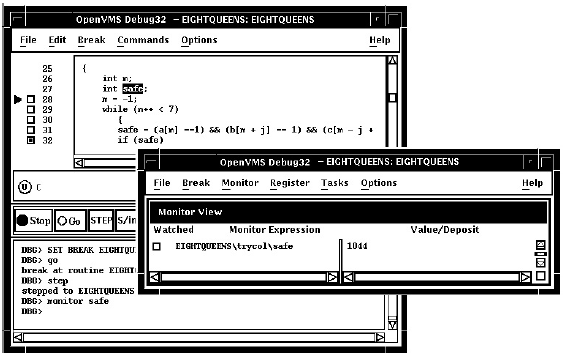
10.5.4.1. Monitoring an Aggregate (Array or Structure) Variable
If you select the name of an aggregate variable, such as an array or structure (record) and click on the MON button, the debugger displays the word Aggregate in the Value/Deposit column of the monitor view. To display the values of all elements (components) of an aggregate variable, double click on the variable name in the Monitor Expression column (or choose Expand in the Monitor menu).The displayed element names are indented relative to the parent name (see Figure 10.14, ''Expanded Aggregate Variable (Array) in Monitor View''). If an element is also an aggregate, you can double click on its name to display its elements, and so on.
-in-monitor-view.png)
To collapse an expanded display so that only the aggregate parent name is shown in the monitor view, double click on the name in the Monitor Expression column (or choose Collapse from the Monitor menu).
If you have selected a component of an aggregate variable, and the component
expression is itself a variable, the debugger monitors the component that was
active when you made the selection. For example, if you select the array
component arr[i] and the current value of
i is 9, the debugger monitors
arr[9] even if the value of i
subsequently changes to 10.
10.5.4.2. Monitoring a Pointer (Access) Variable
If you select the name of a pointer (access) variable and click on the MON button, the debugger displays the address of the referenced object in the Value/Deposit column of the monitor view (see the top entry in Figure 10.15, ''Pointer Variable and Referenced Object in Monitor View'').
To monitor the value of the referenced object (to dereference the pointer variable), double click on the pointer name in the Monitor Expression column. This adds an entry for the referenced object in the monitor view, indented under the pointer entry (see the bottom entry in Figure 10.15, ''Pointer Variable and Referenced Object in Monitor View''). If a referenced object is an aggregate, you can double click on its name to display its elements, and so on.
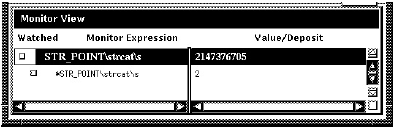
10.5.5. Watching a Variable
Whenever the program changes the value of a watched variable, the debugger suspends execution and displays the old and new values in the command view.
Monitor the variable as explained in Section 10.5.4, ''Monitoring a Variable ''.The debugger puts a button in the Watched column of the monitor view whenever you monitor a variable. See Figure 10.16, ''Watched Variable in Monitor View''.
Click on the button in the Watched column. A filled-in button indicates that the watch point is set.
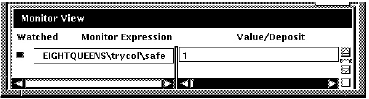
To deactivate a watchpoint, clear its Watched button in the monitor view (by clicking on the button) or choose Toggle Watchpoint in the Monitor menu. To activate a watchpoint, fill in its Watched button or choose Toggle Watchpoint in the Monitor menu.
Section 10.6.1, ''Accessing Static and Nonstatic (Automatic) Variables'' explains static and nonstatic (automatic) variables and how to access them. The debugger deactivates a nonstatic watchpoint when execution moves out of (returns from) the variable's defining routine. When a non static variable is no longer active, its entry is dimmed in the monitor view and its Watched button is cleared.
The debugger does not automatically reactivate non static watchpoints if execution later returns to the variable's defining routine. You must reactivate non static watchpoints explicitly.
10.5.6. Changing the Value of a Monitored Scalar Variable
Monitor the variable as explained in Section 10.5.4, ''Monitoring a Variable ''.
Click on the variable's value in the Value/Deposit column of the monitor view. A small dialog box is displayed over that value, which you can now edit.
Enter the new value in the dialog box.
Click on the check mark (OK) in the dialog box. The dialog box is removed and replaced by the new value, indicating that the variable now has that value. The debugger notifies you if you try to enter a value that is incompatible with the variable's type, range, and so on.
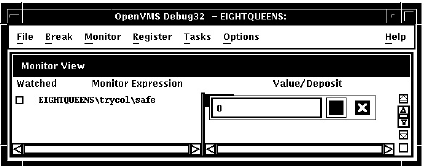
To cancel a text entry and dismiss the dialog box, click on X (Cancel).
Display the value of the component as explained in Section 10.5.4.1, ''Monitoring an Aggregate (Array or Structure) Variable ''.
Click on the variable's value in the Value/Deposit column of the monitor view. A small dialog box is displayed over that value, which you can now edit.
Enter the new value in the dialog box.
Click on the check mark (OK) in the dialog box. The dialog box is removed and replaced by the new value, indicating that the variable now has that value. The debugger notifies you if you try to enter a value that is incompatible with the variable's type, range, and so on.
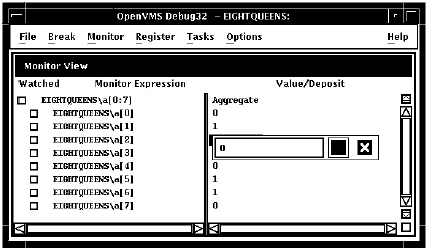
10.6. Accessing Program Variables
This section provides some general information about accessing program variables while debugging.
If your program was optimized during compilation, you might not have access to certain variables while debugging. When you compile a program for debugging, it is best to disable optimization, if possible (see Section 1.2.1, ''Compiling a Program for Debugging'').
Before you check on the value of a variable, always execute the program beyond the point where the variable is declared and initialized. The value contained in any uninitialized variable should be considered invalid.
10.6.1. Accessing Static and Nonstatic (Automatic) Variables
Note
The generic term nonstatic variable is used here to denote what is called an automatic variable in some languages.
A static variable is associated with the same memory address throughout execution of the program. You can always access a static variable.
A nonstatic variable is allocated on the stack or in a register and has a value only when its defining routine or block is active (on the call stack). Therefore, you can access a nonstatic variable only when program execution is paused within the scope of its defining routine or block (which includes any routine called by the defining routine).
A common technique for accessing a nonstatic variable is first to set a breakpoint on the defining routine and then to execute the program to the breakpoint.
If you try to display the value of the variable or monitor the variable (as explained in Section 10.5.2, ''Displaying the Current Value of a Variable'' and Section 10.5.4, ''Monitoring a Variable '', respectively), the debugger issues a message that the variable is not active or not in scope.
If the variable (or an expression that includes the variable) is currently being monitored, its entry becomes dimmed in the monitor view. When the entry is dimmed, the debugger does not check or update the variable's displayed value;also, you cannot change that value as explained in Section 10.5.3, ''Changing the Current Value of a Variable''. The entry is fully displayed whenever the variable becomes accessible again.
If the variable is currently being watched (as explained in Section 10.5.5, ''Watching a Variable''), the watch point is deactivated (its Watched button is cleared) and its entry is dimmed in the monitor view. However, note that the watchpoint is not reactivated automatically when the variable becomes accessible again.
10.6.2. Setting the Current Scope Relative to the Call Stack
Determine where the current routine call originated
Determine the value of a variable declared in a calling routine
Determine the value of a variable during a particular invocation of a routine that is called recursively
Change the value of a variable in the context of a routine call
The Call Stack menu on the main window lists the names of the routines (and, under certain conditions, the images and modules) of your program that are currently active on the stack, up to the maximum number of lines that can be displayed on your screen (see Figure 10.19, ''Current Scope Set to a Calling Routine''). The numbers on the left side of the menu indicate the level of each routine on the stack relative to level 0, which denotes the routine in which execution is paused.
The Call Stack menu, when released, shows the name and relative level of the routine that is now the current scope.
The main window shows that routine's source code.
The instruction view (if displayed) shows that routine's decoded instructions.
The register view (if displayed) shows the register values associated with that routine call.
If the scope is set to a calling routine (a call-stack level other than 0), the debugger clears the current-location pointer, as shown in Figure 10.19, ''Current Scope Set to a Calling Routine''.
The debugger sets the scope for symbol searches to the chosen routine, so that you can examine variables, and so on, in the context of that scope.
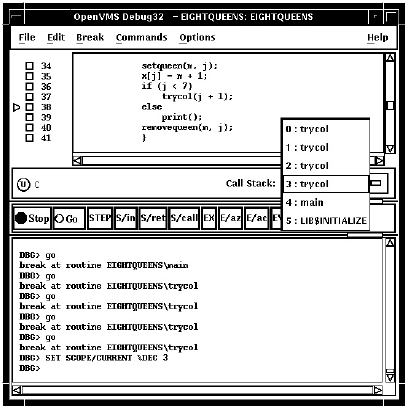
When you set the scope to a calling routine, the current-location pointer (which is cleared) marks the source line to which execution will return in that routine. Depending on the source language and coding style used, this might be the line that contains the call statement or some subsequent line.
10.6.3. How the Debugger Searches for Variables and Other Symbols
Symbol ambiguities can occur when a symbol (for example, a variable name X) is defined in more than one routine or other program unit.
In most cases, the debugger automatically resolves symbol ambiguities. First, it uses the scope and visibility rules of the currently set language. In addition, because the debugger permits you to specify symbols in arbitrary modules (to set breakpoints and so on), the debugger uses the ordering of routine calls on the call stack to resolve symbol ambiguities.
It might issue a "symbol not unique" message because it is not able to determine the particular declaration of the symbol that you intended.
It might reference the symbol declaration that is visible in the current scope, not the one you want.
If the different declarations of the symbol are within routines that are currently active on the call stack, use the Call Stack menu on the main window to reset the current scope (see Section 10.6.2, ''Setting the Current Scope Relative to the Call Stack'').
- Otherwise, enter the appropriate command at the command prompt (EXAMINE or MONITOR, for example), specifying a path name prefix with the symbol. For example, if the variable X is defined in two modules named COUNTER and SWAP, the following command uses the path name SWAP \X to specify the declaration of X that is in module SWAP:
DBG>
EXAMINE SWAP\X
10.7. Displaying and Modifying Values Stored in Registers
The register view displays the current contents of all machine registers (see Figure 10.20, ''Register View'').
To display the register view, choose Views... from the Options menu on the main window or the optional views window, then click on Registers when the Views dialog box appears.
By default, the register view automatically displays the register values associated with the routine in which execution is currently paused. Any values that change as your program executes are highlighted whenever the debugger regains control from your program.
To display the register values associated with any routine on the call stack, choose its name from the Call Stack menu on the main window (see Section 10.6.2, ''Setting the Current Scope Relative to the Call Stack'').
Click on the register value in the register view. A small dialog box is displayed over the current value, which you can now edit.
Enter the new value in the dialog box.
Click on the check mark (OK) in the dialog box. The debugger removes the dialog box and displays the new value, indicating that the register now contains that value. To dismiss the dialog box without changing the value in the register, click on X (Cancel).
Choose Change Radix in the Register menu to change the radix in current and subsequent output for a selected register.
Choose Change All Radix in the Register menu to change the radix in current and subsequent output for all registers.
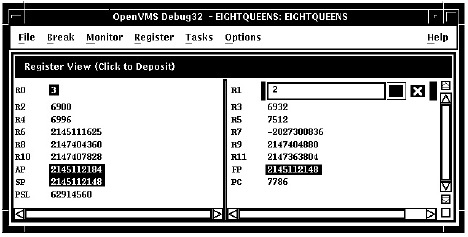
10.8. Displaying the Decoded Instruction Stream of Your Program
The instruction view displays the decoded instruction stream of your program: the code that is actually executing (see Figure 10.21, ''Instruction View''). This is useful if the program you are debugging has been optimized by the compiler so that the information in the main window does not exactly reflect the code that is executing (see Section 1.2, ''Preparing an Executable Image for Debugging'').
To display the instruction view, choose Views... from the Options menu on the main window or the optional views window, then click on Instructions when the Views dialog box appears.
By default, the instruction view automatically displays the decoded instruction stream of the routine in which execution is currently paused. The current-location pointer, to the left of the instructions, marks the instruction that will execute next.
By default, the debugger displays source code line numbers to the left of the instructions with which they are associated. To hide or display line numbers, toggle Display Line Numbers from the File menu in the instruction view.
By default, the debugger displays memory addresses to the left of the instructions. To hide or display addresses, toggle Show Instruction Addresses from the File menu in the instruction view.
After navigating the instruction view, click on the Call Stack menu to redisplay the location at which execution is paused.
To display the instruction stream of any routine on the call stack, choose the routine's name from the Call Stack menu on the main window (see Section 10.6.2, ''Setting the Current Scope Relative to the Call Stack'').
10.9. Debugging Tasking (Multithread) Programs
Programs in any language that use POSIX Threads Library or POSIX 1003.1b services.
Programs that use language-specific tasking services (services provided directly by the language). Currently, Ada is the only language with built-in tasking services that the debugger supports.
Within the debugger, the term task or thread denotes such a flow of control, regardless of the language or implementation. The debugger's tasking support applies to all such programs.
The debugger enables you to display task information and modify task characteristics to control task execution, priority, state transitions, and so on.
The following sections summarize the tasking features of the debugger's VSI DECwindows Motif for OpenVMS user interface. For more information about the debugger's tasking support, see Chapter 16, "Debugging Tasking Programs".
10.9.1. Displaying Information About Tasks (Threads)
To display information about one or more tasks (threads) of your program, choose Views... from the Options menu on the main window or the optional views window, then click on Threads when the Views dialog box appears.
The Threads view gives information about all currently existing(non terminated) tasks of your program. The information is updated whenever the debugger regains control from the program, as shown in Figure 10.22, ''Thread View''.
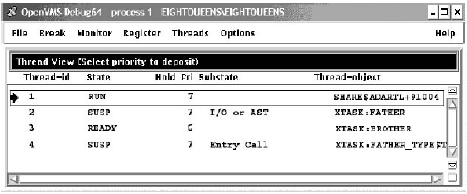
The thread ID. The arrow in the left column marks the active task; i.e., the thread that runs when you click on the Go or STEP button.
The thread priority.
Whether the task (thread) has been put on hold as explained in Section 10.9.2, ''Changing Task (Threads) Characteristics''.
The current state of the task (thread). The task in the RUN (running) state is the active task.
The current substate of the task (thread). The substate helps indicate the possible cause of a task's state.
A debugger path name for the task (thread) object or the address of the task object if the debugger cannot symbolize the task object.
10.9.2. Changing Task (Threads) Characteristics
|
Threads Menu Item |
Description |
|---|---|
|
Abort |
Request that the selected task (thread) be terminated at the next allowed opportunity. The exact effect depends on the current event facility (language dependent).For Ada tasks, this is equivalent to executing an abort statement. |
|
Activate |
Make the selected task (thread) the active task. |
|
Hold |
Place the selected task (thread) on hold. |
|
No hold |
Release the selected task (thread) from hold. |
|
Make Visible |
Make the selected task the visible task (thread). |
|
All |
Use the submenu to abort all tasks (threads) or release all tasks (threads) from hold. |
10.10. Customizing the Debugger's VSI DECwindows Motif for OpenVMS Interface
DECW$SYSTEM_DEFAULTS:VMSDEBUG.DAT) that defines the startup
defaults for the following customizable parameters: Configuration of windows and views
Whether to show or hide line numbers in the main window
Button names and associated debugger commands
Key sequence to display the dialog box for conditional and action break points
Key sequence for language-sensitive text selection in the source view and instruction view
Character fonts for text in the views
Character font for text displayed in specific windows and views
Color of the text foreground and background colors in the source view, instruction view, and editor view
Display of program, module, and routine names in the main window title bar
Whether or not the debugger requires confirmation before exiting
A copy of the system default debugger resource file with explanatory comments is included in Example 10.1, ''System Default Debugger Resource File (DECW$SYSTEM_DEFAULTS:VMSDEBUG.DAT)'' in Section 10.10.4, ''Editing the Debugger Resource File''.
You can modify the first three of these display attributes interactively from the VSI DECwindows Motif for OpenVMS user interface, as explained in Section 10.10.1, ''Defining the Startup Configuration of Debugger Views'', Section 10.10.2, ''Displaying or Hiding Line Numbers inSource View and Instruction View'', and Section 10.10.3, ''Modifying, Adding, Removing, and Resequencing Push Buttons''. In each case, you can save the modified display configuration for future debugging sessions by choosing Save Options from the Options menu.
In addition, you can modify all the listed attributes of the debugger display configuration by editing and saving the debugger resource file, as explained in Section 10.10.4, ''Editing the Debugger Resource File''.
When you choose Save Options from the Options menu or you edit and save the local debugger
resource file, the debugger creates a new version of the local debugger resource file
DECW$USER_DEFAULTS:VMSDEBUG.DAT that contains the definitions
of the display configuration attributes. When you next start the debugger, it uses the
attributes defined in the most recent local resource file to configure the output
display. You can fall back to previous debugger display configurations with appropriate
use of the DCL commands DELETE, RENAME, and
COPY.
To fall back to the system default display configuration, select Restore Default Options from the OpenVMS Debugger Options menu.
10.10.1. Defining the Startup Configuration of Debugger Views
While using the debugger, set up your preferred configuration of views.
Choose Save Options from the Options menu to create a new version of the debugger resource file.
When you next start the debugger, the debugger uses the most recent resource file to create the new display configuration.
You can also define the startup display configuration by editing the definition of these views in the resource file (see Section 10.10.4, ''Editing the Debugger Resource File'').
10.10.2. Displaying or Hiding Line Numbers inSource View and Instruction View
While using the debugger, choose Display Line Numbers from the File menu on the main window (or the instruction view). Line numbers are displayed when a filled-in button appears next to that menu item.
Choose Save Options from the Options menu to create a new version of the debugger's local resource file.
When you next start the debugger, the debugger uses the most recent resource file to create the new display configuration.
DebugSource.StartupShowSourceLineno: True DebugInstruction.StartupShowInstLineno: True
10.10.3. Modifying, Adding, Removing, and Resequencing Push Buttons
Change a button's label or associated command
Add a new button
Remove a button
Resequence a button
Note
You cannot modify or remove the Stop button.
To save these modifications for future debugger sessions, choose Save Options from the Options menu.
Section 10.10.3.1, ''Changing a Button's Label or Associated Command'', Section 10.10.3.2, ''Adding a New Button and Associated Command'', and Section 10.10.3.3, ''Removing a Button''explain how to customize push
buttons interactively through the VSI DECwindows Motif for OpenVMS user interface. You can also
customize push buttons by editing the resource file. Button definitions in the
resource file begin with: DebugControl.Button (See Example 10.1, ''System Default Debugger Resource File
(DECW$SYSTEM_DEFAULTS:VMSDEBUG.DAT)''.)
10.10.3.1. Changing a Button's Label or Associated Command
Choose Customize Buttons... from the Options menu on the main window or the optional views window. The Customize Buttons dialog box is displayed(see Figure 10.23, ''Changing the STEP Button Label to an Icon'').
Within the dialog box, click on the button you are modifying. This fills the Command and Label fields with the parameters for that button. The example in Figure 10.23, ''Changing the STEP Button Label to an Icon''shows that the STEP button was selected.
To change the button icon, pull down the Icon menu within the dialog box and select one of the predefined icons. As Figure 10.23, ''Changing the STEP Button Label to an Icon'' shows, the Label field dims and is filled with the debugger's internal name for the predefined icon. The icon itself appears in the dialog box's push button display.
To change the button label, select None on the Icon menu and enter a new label in the Label field.
To change the command associated with the button, enter the new command in the Command field. For online help about the commands, see Section 8.4.3, ''Displaying Help on Debugger Commands''.
If the command is to operate on a name or language expression selected in a window, specify
%Sas the command parameter. For example, the following command displays the current value of the language expression that is currently selected:EVALUATE %s.If the command is to operate on a debugger built-in symbol or any other name that has a percent sign (%) as the first character, specify two percent signs. For example:EXAMINE %%NEXTLOC
Click on Modify. The button's label or associated command is changed within the dialog box push button display.
Click on Apply. The button's label or associated command is changed within the debugger's push button view.
To save these modifications for future debugger sessions, choose Save Options from the Options menu.
10.10.3.2. Adding a New Button and Associated Command
Choose Customize Buttons... from the Options menu. The Customize Buttons dialog box is displayed (see Figure 10.24, ''Adding a Button'').
Enter the debugger command for the new button in the Command field (see Section 10.10.3.1, ''Changing a Button's Label or Associated Command''). Figure 10.24, ''Adding a Button'' shows the debugger command
RUN MYDISK:[MYDIRECTORY]X.EXEwas entered.Enter a label for that button in the Label field or choose a predefined icon from the Icon menu. Figure 10.24, ''Adding a Button'' shows that the Run-X label was chosen.
Click on Add. The button is added to the dialog box push button display.
Click on Apply. The button is added to the debugger's push button view.
To save these modifications for future debugger sessions, choose Save Options from the Options menu.
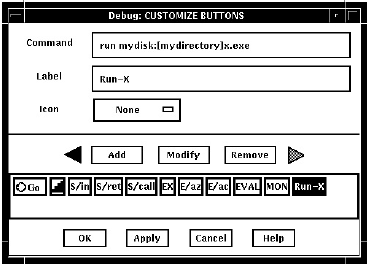
10.10.3.3. Removing a Button
Choose Customize Buttons... from the Options menu on the main or optional views window. The Customize Buttons dialog box is displayed.
Within the dialog box, click on the button you are removing. This fills the Command and Label fields with the parameters for that button.
Click on Remove. The button is removed from the dialog box push button display.
Click on Apply. The button is removed from the debugger's push button view.
To save these modifications for future debugger sessions, choose Save Options from the Options menu.
10.10.3.4. Resequencing a Button
Choose Customize Buttons... from the Options menu on the main or optional views window. The Customize Buttons dialog box is displayed.
Within the dialog box, click on the button you are resequencing. This fills the Command and Label fields with the parameters for that button.
Click on the left or right arrow to move the button one position to the left or right. Continue to click until the button has moved, one position at a time, to its final position.
Click on Apply to transfer this position to the debugger's push button view.
To save these modifications for future debugger sessions, choose Save Options from the Options menu.
10.10.4. Editing the Debugger Resource File
The debugger is installed on your system with a default debugger
resource file (DECW$SYSTEM_DEFAULTS:VMSDEBUG.DAT) that defines
the default display configuration for the debugger. When you modify the display
attributes as described in Section 10.10, ''Customizing the Debugger's
VSI DECwindows Motif for OpenVMS Interface'' and then save the
modifications with the Save Options command in the Options menu, the debugger
creates a local debugger resource file,
DECW$USER_DEFAULTS:VMSDEBUG.DAT. You can edit this file to
further modify the debugger display configuration.
If you do not have a local debugger resource file, you can create one with the Restore Default
Options item in the Options menu. Whenever you start the debugger, it creates the
debugger display configuration as defined in the most recent version of the local
debugger resource file if there is one; otherwise, the debugger uses the definitions
in the system debugger resource file,
DECW$SYSTEM_DEFAULTS:VMSDEBUG.DAT.
You cannot edit the system resource file. You can modify the debugger display configuration either by following the procedures in Section 10.10.1, ''Defining the Startup Configuration of Debugger Views'', Section 10.10.2, ''Displaying or Hiding Line Numbers inSource View and Instruction View'', and Section 10.10.3, ''Modifying, Adding, Removing, and Resequencing Push Buttons'', or by editing and saving your local debugger resource file.
Note
The line in Example 10.1, ''System Default Debugger Resource File
(DECW$SYSTEM_DEFAULTS:VMSDEBUG.DAT)'' that begins with
DebugControl.ButtonList does not completely fit in
this example. This line identifies the button definitions contained in the
file. The full line in the file also contains the following button names:
StepReturnButton, StepCallButton, ExamineButton, ExamineASCIZButton,
ExamineASCICButton, EvalButton, MonitorButton.
! ! OpenVMS Debug32/64 Debugger Resource File ! DebugVersion: 71 ! ! GEOMETRY RESOURCES: ! ! Written when you execute "SAVE OPTIONS" from the Options Menu. ! DebugSource.x: 11 DebugSource.y: 30 DebugSource.width: 620 DebugSource.height: 700 ! DebugControl.x: 650 DebugControl.y: 30 DebugControl.width: 600 DebugControl.height: 700 ! DebugEditor.x: 650 DebugEditor.y: 30 DebugEditor.width: 600 DebugEditor.height: 700 ! DebugInstruction.x: 11 DebugInstruction.y: 769 DebugInstruction.width: 620 DebugInstruction.height: 243 ! *DebugBrowser.x: 650 *DebugBrowser.y: 30 *DebugBrowser.width: 335 *DebugBrowser.height: 300 ! ! LINE NUMBER DISPLAY RESOURCES: ! ! Create the line or address number display in views at startup? ! DebugSource.StartupShowSourceLineno: True DebugInstruction.StartupShowInstLineno: True DebugInstruction.StartupShowInstAddrno: False ! ! WINDOW PANE RESOURCES: ! ! Relative size of panes in main window. ! Main window height is derived from sum of panes. ! DebugSource*SrcView.height: 460 DebugSource*PushbuttonPanel.height: 36 DebugSource*MessageOutputPanel.height: 145 ! DebugControl.BreakpointView.height: 175 DebugControl.MonitorView.height: 150 DebugControl.TaskView.height: 130 DebugControl.RegisterView.height: 250 ! ! CUSTOM BUTTON RESOURCES: ! ! The following resources determine which buttons to put in the button ! panel. ! Buttons will show in the order they are listed here. ! For each button there MUST be a set of associated resources. ! EXAMPLE: ! ButtonCommand - Associates a command with the button. ! ButtonLegend - Button Label or pixmap name if pixmap flag is True. ! ButtonPixmapFlag - If True uses ButtonLegend as predefined pixmap name. ! DebugControl.ButtonList: \ GoButton, StepButton, StepInButton, ... ! DebugControl.ButtonCommand.GoButton: go DebugControl.ButtonLegend.GoButton: go_pixmap DebugControl.ButtonPixmapFlag.GoButton: True ! DebugControl.ButtonCommand.StepButton: step DebugControl.ButtonLegend.StepButton: STEP DebugControl.ButtonPixmapFlag.StepButton: False ! DebugControl.ButtonCommand.StepInButton: step/in DebugControl.ButtonLegend.StepInButton: S/in DebugControl.ButtonPixmapFlag.StepInButton: False ! DebugControl.ButtonCommand.StepReturnButton: step/return DebugControl.ButtonLegend.StepReturnButton: S/ret DebugControl.ButtonPixmapFlag.StepReturnButton: False ! DebugControl.ButtonCommand.StepCallButton: step/call DebugControl.ButtonLegend.StepCallButton: S/call DebugControl.ButtonPixmapFlag.StepCallButton: False ! DebugControl.ButtonCommand.ExamineButton: examine %s DebugControl.ButtonLegend.ExamineButton: EX DebugControl.ButtonPixmapFlag.ExamineButton: False ! DebugControl.ButtonCommand.ExamineASCIZButton: examine/asciz %s DebugControl.ButtonLegend.ExamineASCIZButton: E/az DebugControl.ButtonPixmapFlag.ExamineASCIZButton: False ! DebugControl.ButtonCommand.ExamineASCICButton: examine/ascic %s DebugControl.ButtonLegend.ExamineASCICButton: E/ac DebugControl.ButtonPixmapFlag.ExamineASCICButton: False ! DebugControl.ButtonCommand.EvalButton: evaluate %s DebugControl.ButtonLegend.EvalButton: EVAL DebugControl.ButtonPixmapFlag.EvalButton: False ! DebugControl.ButtonCommand.MonitorButton: monitor %s DebugControl.ButtonLegend.MonitorButton: MON DebugControl.ButtonPixmapFlag.MonitorButton: False ! ! THE FOLLOWING RESOURCES CAN ONLY BE CHANGED BY EDITING THIS FILE. ! - - - - - - - - - - - - - - - - - - - - - -- ! Be sure to trim off any trailing white-spaces. ! ! FONT RESOURCES: ! ! If a font is specified for a view, and the font is available on the ! system, it will be used for that view. ! ! For any views which do not explicitly specify a font, the font ! specified by the resource "DebugDefault.Font" will be used if ! it is available on the system. ! ! If no font resources are specified at all, the debugger will use the ! systems own default font specification. ! ! The "DebugOptions.Font" applies to all optional views. We suggest that ! you select a font with a point size no larger than 14 in the option ! views in order to preserve label alignment. ! ! Using 132 column sources? Try this narrow font: ! -dec-terminal-medium-r-narrow--14-100-100-100-c-60-iso8859-1 ! ! FORMAT: -*-FONTNAM-FACE-T-*--*-PTS-*-*-*-*-CHARSET ! DebugDefault.Font: -*-COURIER-BOLD-R-*--*-120-*-*-*-*-ISO8859-1 DebugSource.Font: -*-COURIER-BOLD-R-*--*-120-*-*-*-*-ISO8859-1 DebugInstruction.Font: -*-COURIER-BOLD-R-*--*-140-*-*-*-*-ISO8859-1 DebugMessage.Font: -*-COURIER-BOLD-R-*--*-120-*-*-*-*-ISO8859-1 DebugOptions.Font: -*-COURIER-BOLD-R-*--*-120-*-*-*-*-ISO8859-1 ! ! STARTUP RESOURCES: 3=Iconified, 0=Visible ! DebugSource.initialState: 0 DebugControl.initialState: 0 DebugEditor.initialState: 0 DebugInstruction.initialState: 0 ! ! COLOR RESOURCES: ! ! Use any of the OSF Motif Named Colors. ! ! Foreground = Text Color, Background = Window Color ! ! Try: Gainsboro, MintCream, Linen, SeaShell, MistyRose, Honeydew ! Cornsilk, Lavender ! ! To use your system default color scheme, comment out all lines! pertaining to color. ! ! Common color scheme (unless overridden for a specific view) ! *background: Gainsboro *borderColor: Red ! ! Source View Colors ! !DebugSource*background: Gainsboro DebugSource*topShadowColor: WindowTopshadow DebugSource*bottomShadowColor: WindowBottomshadow DebugSource*src_txt.foreground: blue DebugSource*src_txt.background: white DebugSource*src_lineno_txtw.foreground: red DebugSource*cnt_msg_txt.foreground: black DebugSource*cnt_msg_txt.background: white ! ! Control View Colors ! !DebugControl*background: Gainsboro DebugControl*topShadowColor: WindowTopshadow DebugControl*bottomShadowColor: WindowBottomshadow ! ! Instruction View Colors ! !DebugInstruction*background: Gainsboro DebugInstruction*topShadowColor: WindowTopshadow DebugInstruction*bottomShadowColor: WindowBottomshadow DebugInstruction*inst_txt.foreground: blue DebugInstruction*inst_txt.background: white DebugInstruction*inst_addrno_txtw.foreground: red ! ! Editor Colors ! !DebugEditor*background: Gainsboro DebugEditor*topShadowColor: WindowTopshadow DebugEditor*bottomShadowColor: WindowBottomshadow DebugEditor*edit_textw.foreground: black DebugEditor*edit_textw.background: white ! ! REGISTER VIEW RESOURCES: ! ! Which Registers to display by default in the Register View? ! CF = Call Frame, GP = General Purpose, FP = Floating Point (Integrity ! server and Alpha Only) ! *Show_CF_Registers.set: True *Show_GP_Registers.set: False *Show_FP_Registers.set: False ! ! SHOW MESSAGE/COMMAND SEPARATOR LINES? ! *Show_Message_Separators.set: True ! ! TRACK LANGUAGE CHANGES? (parser follows module language) ! *Track_Language_Changes.set: False ! ! KEY SEQUENCE RESOURCES: ! ! Key sequence used to activate the dialog box for conditional and action ! breakpoints. ! DebugSource.ModifyBreakpointToggleSequence:Ctrl <Btn1Down>,Ctrl <Btn1Up>! ! GENERAL KEYPAD FUNCTIONS: ! !0xFFB0=KP0,0xFF91,0xFFB0=GOLD-KP0, !0xFF94,0xFFB0=BLUE-KP0,0xFFB1=KP1, !0xFF91,0xFFB1=GOLD-KP1,0xFFAC=KP, DebugSource.*XmText.translations:#override\n\0xFFB0: EnterCmdOnCmdLine("step/line") \n\0xFFB1: EnterCmdOnCmdLine("examine") \n\0xFFAC: EnterCmdOnCmdLine("go") \n\0xFF91,0xFFB0: EnterCmdOnCmdLine("step/into") \n\0xFF94,0xFFB0: EnterCmdOnCmdLine("step/over") \n\0xFF91,0xFFB1: EnterCmdOnCmdLine("examine^") \n\0xFFB5: EnterCmdOnCmdLine("show calls") \n\0xFF91,0xFFB5: EnterCmdOnCmdLine("show calls 3") \n\0xFF8D: activate()\n! ! IDENTIFIER WORD SELECTION: (language-based delimiters) ! NOTE: DO NOT use any double click combination for the following resource ! otherwise normal text selection in the source window will not work. ! DebugSource.IdentifierSelectionSequence:Ctrl<Btn1Down>! ! EXIT CONFIRMATION: ! DebugDisplayExitConfirmDB: True ! ! COMMAND ECHO: ! DebugEchoCommands: True ! ! TITLE FORMAT: Main window and optional view window. ! ! The following title format directives are supported: ! ! %t - The title of the debugger application. ! %p - The name of the user program being debugged. ! %f - The name of the current file displayed in the source window. ! DebugControl.TitleFormat: %t - %p: %f ! ! DRAG AND DROP MESSAGE SUPRESSION: (Dont mess with these) ! *.dragInitiatorProtocolStyle: DRAG_NONE *.dragReceiverProtocolStyle: DRAG_NONE
10.10.4.1. Defining the Key Sequence to Display the Breakpoint Dialog Box
DebugSource.ModifyBreakpointToggleSequence: Ctrl<Btn1Down>(2)10.10.4.2. Defining the Key Sequence for Language-Sensitive Text Selection
DebugSource.IdentifierSelectionSequence: Ctrl<Btn1Down>To avoid conflict with standard VSI DECwindows Motif for OpenVMS word selection, do not use a double-click
combination, such as Ctrl <Btn1Down>(2).
10.10.4.3. Defining the Font for Displayed Text
10.10.4.4. Defining the Key Bindings on the Keypad
0xFFB0: EnterCmdOnCmdLine("step/line 3") \n\To bind a command to a key that is not currently associated with a command, refer to the X and Motif Quick Reference Guide for key designations.
10.11. Debugging Detached Processes
You cannot use the VSI DECwindows Motif for OpenVMS user interface to the debugger to debug detached processes, such as print symbionts, which run without a command line interpreter (CLI).
To debug a detached process that runs without a CLI, use the character-cell (screen mode) interface to the debugger (see Section 1.11, ''Debugging Detached Processes That Run with No CLI'').
Part IV. PC Client Interface
Chapter 11. Using the Debugger PC Client/Server Interface
Note
The OpenVMS Version 7.3 debugger does not support previous versions of the PC client. You must install the Version 1.1 PC client that is found in the kit on the OpenVMS Version 7.3 distribution media, as identified in Section 11.2, ''Installation of PC Client''.
Version 1.1 PC client is compatible with OpenVMS Version 7.3 and prior debugger servers.
11.1. Introduction
The debug server runs on OpenVMS systems. The client is the user interface to the debugger, from which you enter debugger commands that are sent to the server. The server executes the commands and sends the results to the client for display. The client runs on Microsoft Windows 95, Windows 98, Windows NT, Windows 2000, and Windows XP.
[DEBUG_CLIENTS011.KIT]DEBUGX86011.EXE
11.2. Installation of PC Client
There is no special installation procedure for the components that run on OpenVMS. The
system administrator must move the OpenVMS debug client kit listed in the previous
section from the OpenVMS distribution media to a place accessible to PC users, such as a
PATHWORKS share or an FTP server. The client kit is a self-extracting
.EXE file.
Once the appropriate executable file has been transferred to the PC, you can run the file to install the debug client on the PC. The Install Shield installation procedure guides you through the installation.
By default, the debug client is installed in the \Program Files\OpenVMS
Debugger folder. You can also click Browse to select an alternate
location.
Debug client
Debug client Help file
READMEfileUninstall procedure
11.3. Primary Clients and Secondary Clients
The primary client is the first client to connect to the server. A secondary client is an additional client that has connected to the same server. The primary client controls whether or not any secondary clients can connect to the server.
See Section 11.5, ''Establishing a Server Connection'' for details about specifying the number of secondary clients allowed to connect to a debugging session.
11.4. The PC Client Workspace
The PC client workspace is analogous to the workspace of the Motif client (see Chapter 8, "Introduction "). The client workspace contains views to display dynamic information and toolbars to contain shortcuts to debugger commands. You can configure the views and toolbars to suit your personal requirements, create your own shortcuts, and save your personal configurations.
Overview
Getting Started
Views
Toolbars
11.5. Establishing a Server Connection
Note
You must hold the DBG$ENABLE_SERVER identifier in the
rights database to be able to run the debug server. Exercise care when using the
debug server. Once a debug server is running, anyone on the network has the
ability to connect to the debug server.
Before granting the DBG$ENABLE_SERVER identifier, the system
manager must create it by entering the command DEBUG/SERVER from an
account with write access to the rights database. The system manager needs to do this
only once. The system manager can then run the Authorize utility to grant the
DBG$ENABLE_SERVER identifier to the user.
$ DEBUG/SERVERThe server displays its network binding strings. The server port number is enclosed in square brackets ([]). For example:
$ DEBUG/SERVER %DEBUG-I-SPEAK: TCP/IP: YES, DECnet: YES, UDP: YES %DEBUG-I-WATCH: Network Binding: ncacn_ip_tcp:16.32.16.138[1034] %DEBUG-I-WATCH: Network Binding: ncacn_dnet_nsp:19.10[RPC224002690001] %DEBUG-I-WATCH: Network Binding: ncadg_ip_udp:16.32.16.138[1045] %DEBUG-I-AWAIT: Ready for client connection...
Note
You can usually identify the server using only the node name and the port
number. For example, nodnam[1034].
To establish a connection from the PC client, invoke the Connection dialog, either from the File pull-down menu, or by selecting the C/S button on the Main toolbar. The dialog displays the servers already known to this client, and the sessions currently active by this client.
You can specify a server for a new connection, or select a particular session for use.
Connect to the selected (or the default) server
Disconnect from a server
Test the client/server connection
Stop the selected server
In addition, the Advanced button allows you to select the network protocol to be used (see Section 11.5.1, ''Choosing a Transport''), and to select the number of secondary clients (0-30) allowed for the client/server connection to be established (see Section 11.5.2, ''Secondary Connections'').
11.5.1. Choosing a Transport
TCP/IP
DECnet
UDP
11.5.2. Secondary Connections
On the Connection dialog, click Advanced.
Select the number of secondary clients(0-30) to be permitted.
Click Connect on the Connection dialog.
The debugger dismisses the Connection dialog, makes the connection, and indicates success (or failure) in the Command view. You can now begin your debugging procedures.
11.6. Terminating a Server Connection
You can stop a server by entering Ctrl-Y on the node
on which the server is running. If you do so, then enter the DCL STOP
command.
Open the File pull-down menu.
Select Exit.
Click Server to stop only the server, or click Both to stop both the server and the client.
Open the File pull-down menu.
Click Connection to invoke the Connection dialog.
Select the server connection from the Active Sessions list.
Click Stop.
11.6.1. Exiting Both Client and Server
Open the File pull-down menu.
Click Exit.
Click Both.
11.6.2. Exiting the Client Only
Open the File pull-down menu.
Click Exit.
Click Client.
11.6.3. Stopping Only the Server
Open the File pull-down menu.
Click Exit.
Click Server.
11.7. Documentation
Open the Help pull-down menu.
Click Contents.
Click Local Manual.
Part V. Advanced Topics
Chapter 12. Using the Heap Analyzer
The Heap Analyzer, available on OpenVMS Integrity servers and Alpha systems, is a feature of the debugger that provides a graphical representation of memory use in real time. By studying this representation, you can identify areas in your application where memory usage and performance can be improved. For example, you might notice allocations that are made too often, memory blocks that are too large, evidence of fragmentation, or memory leaks.
After you locate an area of interest, you can request an enlarged, more detailed, or altered view. You can also request additional information on the size, contents, or address of the allocations shown.
After you narrow your interest to an individual allocation, you can request trace back information. The analyzer allows you to correlate the trace back entry for an allocation with source code in your application program. By scrolling through the source code display, you can then identify problematic code and decide how to correct it.
Starting a Heap Analyzer session (Section 12.1, ''Starting a Heap Analyzer Session'')
Working with the default display (Section 12.2, ''Working with the Default Display'')
Adjusting type determination and display (Section 12.3, ''Adjusting Type Determination and Display'')
Exiting the Heap Analyzer (Section 12.4, ''Exiting the Heap Analyzer'')
Sample session (Section 12.5, ''Sample Session'')
12.1. Starting a Heap Analyzer Session
The following sections describe how to invoke the Heap Analyzer and run your application.
12.1.1. Invoking the Heap Analyzer
In the debugger main window, choose Run Image or Rerun Same from the File menu. When a dialog box appears, select the program you wish to execute and click the Heap Analyzer toggle button.
At the debugger command entry prompt, enter the
RUN/HEAP_ANALYZERorRERUN/HEAP_ANALYZERcommand.program-image- On Alpha systems: At the DCL prompt ($) in a DECterm window outside the debugger, enter the following command and then execute your program:
$
DEFINE/USER/NAME=CONFINE LIBRTL SYS$LIBRARY:LIBRTL_INSTRUMENTEDTo use the heap analyzer with a protected image, enter the following command and then execute your program:$
DEFINE/EXEC/NAME=CONFINE LIBRTL SYS$LIBRARY:LIBRTL_INSTRUMENTEDThis is necessary if the image was installed with the following command:$
INSTALL ADDimagename/PROTECTEDYou can invoke the Heap Analyzer outside a debugging session by entering the
DEFINE/USER(orDEFINE/SYSTEM) command detailed above, and then the DCL commandRUN/NODEBUG. - On Integrity server systems, at the Debug prompt (
DBG>), enter theSTART HEAP_ANALYZERcommand.Note
The Heap Analyzer startup and the Heap Analyzer
STARTcommand on the Integrity servers kept debugger (START HEAP_ANALYZER) hangs for threaded applications with up calls enabled.In such instances, for threaded or AST-involved applications, HP strongly recommends that you either start the Heap Analyzer before setting up any debug events or after disabling or canceling the debug events. (You can enable/reset events after the Heap Analyzer startup and
STARTreturns you to debugger control.)
After you successfully invoke the Heap Analyzer, the Heap Analyzer startup screen appears.
Note
On OpenVMS Alpha systems, the Heap Analyzer does not work on programs linked with the
/NODEBUG qualifier.
On OpenVMS Integrity server systems, the Heap Analyzer does work on programs linked with the
/NODEBUG qualifier, although the traceback
information displayed is minimal.
12.1.2. Viewing Heap Analyzer Windows
The Heap Analyzer contains a main window, six subsidiary windows, and a control panel (see Figure 12.1, ''Heap Analyzer Windows''.)
The Memory Map, the most important window, displays a representation of your application's dynamic memory use. At startup, the Memory Map shows the images that comprise your application. As your application executes, you can see the relative location and size of individual memory blocks, images, program regions, memory zones, and dynamic strings as they are allocated and deallocated in memory space.
The Message window displays information on your Heap Analyzer session. At startup, the Message window contains the message "Heap Analyzer initialization complete. Press Start button to begin program."As your application executes, informational and error messages appear in this window.
The Push Button Control Panel contains buttons that allow you to control the speed of the Memory Map display. At startup, you click on the Start button to begin executing your application. As your application executes, you can click on other buttons in the panel to pause, slow, or otherwise affect the continuous display.
The Information window displays information on Memory Map segments. As your application executes, you can pause execution at any time to request specific information.
The Source window displays the application source code associated with a segment in the Memory Map.
The Do-not-use Type List allows you to adjust the Memory Map display by redetermining a segment's type, or group name.
The Views-and-Types Display allows you to adjust the Memory Map display by selectively viewing certain segment types.
The Type Histogram displays summary and statistical information on segment types.
As you use the Heap Analyzer, you may need to increase or decrease the size of the window in which you are working. To do this, pull the window pane sashes between windows or resize the screen as a whole.
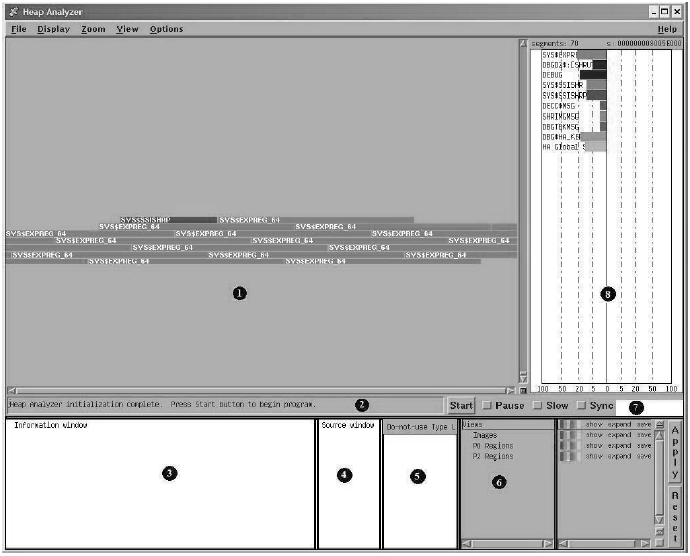
1. Memory Map | Shows the graphical representation of memory, that is, the part of P0-space that is in use. Each allocation appears as a colored strip, or segment. |
2. Message Window | Displays Heap Analyzer informational and error messages and one-line segment descriptions. |
3. Information Window | Shows additional information on segments and segment types that appear in the Memory Map. |
4. Source Window | Shows application source code. |
5. Do-not-use Type List | Lists routines not used as segment types, the name that characterizes segments. |
6. Views-and-Types Display | Lists all segment types known to the Heap Analyzer and allows you to alter the segment display. |
7. Push Button Control Panel | Provides Start/Step, Pause, Slow, and Sync buttons that allow you to control the speed of Memory Map display. |
8. Type Histogram | Shows statistics on segment size and use. |
12.1.3. Viewing Heap Analyzer Pull-Down Menus
The Heap Analyzer provides pull-down menus that are grouped over the Memory Map (see Figure 12.2, ''Heap Analyzer Pull-Down Menus''). This figure is adjusted slightly so that all menu items can be seen.
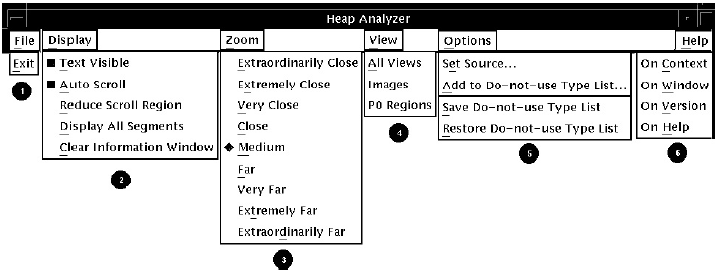
1. File Menu | Allows you to exit from the Heap Analyzer |
2. Display Menu | Allows you to adjust the Memory Map display and to clear the Information window |
3. Zoom Menu | Provides a closer or further view of the Memory Map |
4. View Menu | Lets you select the granularity of the display |
5. Options Menu | Allows you to indicate a search directory list or to adjust the Do-not-use Type List |
6. Help Menu | Provides context-sensitive or task-oriented online help |
12.1.4. Viewing Heap Analyzer Context-Sensitive Menus
Most operations in the Heap Analyzer, however, are accomplished through context-sensitive pop-up menus. Most Heap Analyzer windows contain a pop-up menu listing available tasks (see Figure 12.3, ''Heap Analyzer Context-Sensitive Pop-Up Menus''). To access a window's pop-up menu, position your mouse pointer in the window and click MB3.
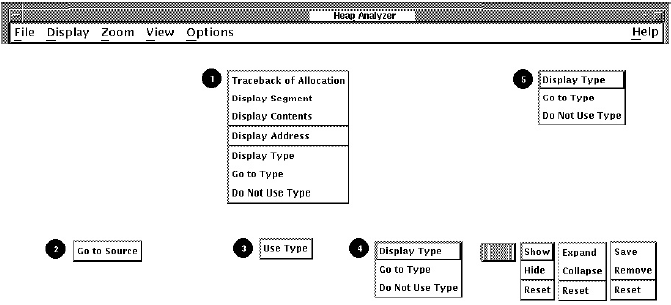
1. Memory Map Pop-Up | Provides additional information on segments displayed in the Memory Map, allows you to jump to a segment's type in the Views-and-Types Display, or adds a segment's type to the Do-not-Use Type List. |
2. Information Window Pop-Up | Allows you to jump from a line of trace back displayed in the Information window to the related source code in the Source window. |
3. Do-not-use Type List Pop-Up | Deletes a segment's type from the Do-not-Use Type List. |
4. Views-and-Types Display Pop-Up | Left side:Provides additional information on segment types listed, highlights a segment type within the Views-and-Types Display, or adds a segment type to the Do-not-Use Type List. Right side: Allows you to adjust display characteristics for the segment type highlighted in the left side of the Views-and-Types Display. |
5. Type Histogram Pop-Up | Provides additional information on segment types listed, highlights a segment type in the Type Histogram, or adds the segment type to the Do-not-Use Type List. |
12.1.5. Setting a Source Directory
If you are invoking the Heap Analyzer from a directory other than the one that stores your application source code, you can set a source directory for the Heap Analyzer as soon as the startup screen appears.
Choose Set Source... from the Options menu on the Heap Analyzer screen.
The Set Source dialog box appears.
Enter the directory specification for your source directory as you would for the debugger
SET SOURCEcommand.For more information on this command, see the SET SOURCE command.
Click on OK.
The Heap Analyzer can now access your application.
12.1.6. Starting Your Application
Click on the Start button in the Push Button Control Panel.
The Message window displays an "application starting" message, and the Start button label changes to Step. The OpenVMS Debugger main window pops forward.
Click on the Go button in the debugger's control panel, and iconize the OpenVMS Debugger window.
Memory events associated with your application begin showing in the Memory Map.
If you invoked the Heap Analyzer outside a debugging session, start your application by performing only step 1 above.
After your application is running, the Memory Map (and other parts of the Heap Analyzer display) are continuously updated to reflect the state of your application.
Unless you intervene (see Section 12.1.7, ''Controlling the Speed of Display''), this updating continues until an occurrence causes memory events to stop. For example, your application might prompt for input, the debugger might prompt for input, or your application might finish execution.
12.1.7. Controlling the Speed of Display
To examine events in the Memory Map as your application is executing, you can use the Heap Analyzer's push buttons to slow, pause, and otherwise affect the speed of the display. Figure 12.4, ''Heap Analyzer Control Panel'' shows these push buttons on the Heap Analyzer window just after the Start button was pushed.
The Slow and Pause push buttons allow you to slow or pause the display.
The Step push button allows you to single-step through memory events.
The Sync histogram (not shown) to the right of the Sync button indicate show far behind your application the Heap Analyzer is running. For performance reasons, the Heap Analyzer displays memory events a few seconds after their occurrence in your application.
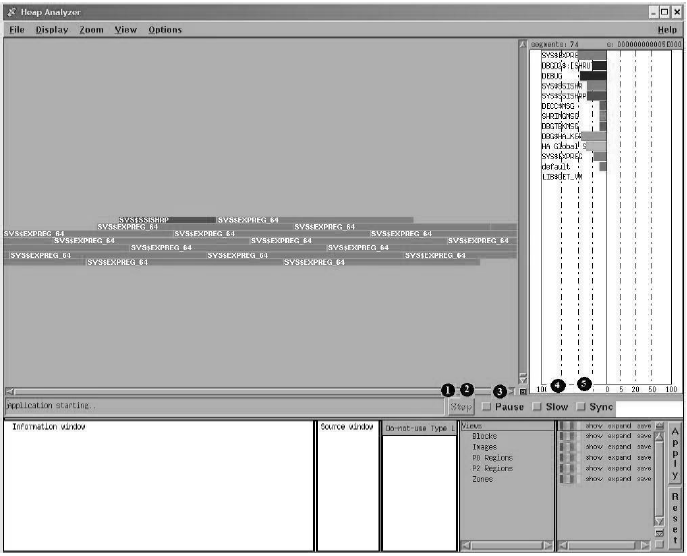
1. Start Button | Click to start executing your application and enable the Memory Map display. Once you do so, the Start button changes to a Step button, which is initially dimmed (inaccessible). |
2. Step Button | Click to single-step through memory events in the Memory Map display. This button is dimmed until you click on the Pause button. |
3. Pause Button | Click to stop (or restart) execution of your application and the dynamic Memory Map display. |
4. Slow Button | Click to slow the dynamic Memory Map display. |
5. Sync Button | Click to force concurrent execution of your application program and display of memory events in the Memory Map. |
The Sync push button allows you to synchronize Heap Analyzer display and application execution, if this is important to you. Your application runs more slowly when you request synchronization.
On OpenVMS Alpha systems, anything that uses system service interception, like the debugger or
the Heap Analyzer, is unable to intercept system service call images activated by
shared linkage. The image activator, therefore, avoids shared linkage for images
linked or run with /DEBUG, and instead activates private image
copies. This affects performance of applications under Heap Analyzer control, as
images activated by shared linkage run faster.
12.2. Working with the Default Display
The following sections describe how to use the Heap Analyzer when memory problems are clearly visible in the default Memory Map display.
Visible problems include allocations that are larger than you expect, that repeat numerous times, that increment at each allocation, and that could occur in a more efficient way.
Examine the Memory Map display.
Set display characteristics in the Memory Map (optional).
Request additional information on individual segments (optional).
Request traceback information on individual segments.
Correlate traceback entries with source code routines.
12.2.1. Memory Map Display
Depending on the size of your application, you may wish to examine the Memory Map display as your application is running (by using the push buttons to slow, pause, or step through events) or after your application completes running (by using the Memory Map's vertical scroll bar to scroll back through the display).
You can identify segments whose size or location are not what you expect by remembering that a segment's location in the Memory Map corresponds to its location in dynamic memory. Lower addresses in dynamic memory are represented in the upper left of the Memory Map display. Addresses increase to the right and wrap at each line of the display.
12.2.2. Options for Memory Map Display
As you examine the Memory Map, you may wish to select display options that allow you to see more clearly those parts of the display you are most interested in.
The Display Menu allows you to control whether you see segment type names within the Memory Map display, whether the display automatically scrolls to show the most recent activity, and whether you can compress the display.
The Zoom Menu allows you to control the degree of magnification with which you see segments in the Memory Map. Choosing the Far menu item, for example, shows an overview of memory. Choosing Extremely Close shows a more detailed view of memory.
Figure 12.5, ''Heap Analyzer Display Menu and Zoom Menu'' shows the display options that appear in the Display pull-down menu. The figure then lists all the display options available in the Memory Map.
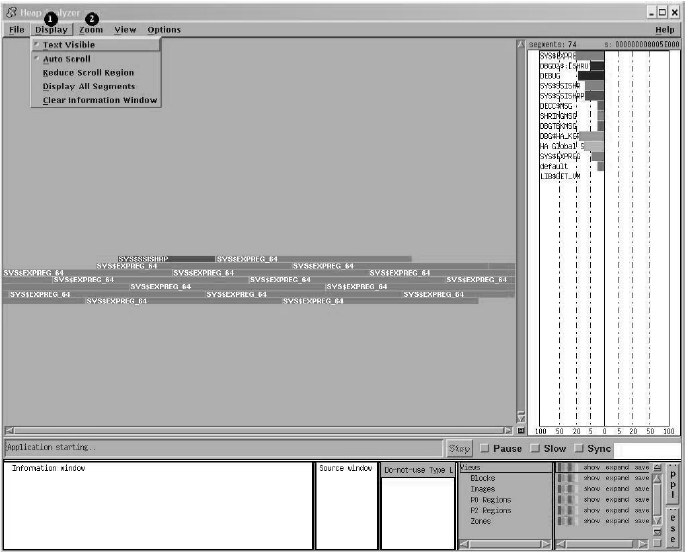
1. Display Menu | Text Visible: (Default.) Labels each segment in the Memory Map with a segment name, provided that the segment is large enough to carry a name label. Auto Scroll: (Default.) Automatically scrolls the Memory Map to the highest memory addresses (lower right) whenever the display is expanded. Reduce Scroll Region: When you request a limited or partial Memory Map display (see Section 12.3.3.2, ''Choosing a Display Option''), compresses the display so that you can see as many segments as possible without scrolling to their location in the original display. Display All Segments: Displays segment definitions for all segments in the Memory Map. Clear Information Window: Clears text and messages from the Information window. |
2. Zoom Menu | Options provide a closer or more distant view of the Memory Map. |
12.2.3. Options for Further Information
As you examine the Memory Map display, you may find that you need more information on those segments that interest you. The Memory Map pop-up menu allows you to request segment, contents, address, and type definitions for an individual segment.
cursor-address n:init-address + length = end-address name ( view )
|
cursor-address |
The address beneath your cursor when you click MB3. |
|
n |
The number of your segment within the sequence of total segments. |
|
init-address |
The initial address of your segment. |
|
length |
The length (in bytes) of your segment. |
|
end-address |
The last address of your segment. |
|
name |
The segment type name of your segment. |
|
view |
The view of your segment: block, image, region, or zone. (See Section 12.3.3.2, ''Choosing a Display Option'' for more information on views.) |
0004ECA5 15: 00040000+0001CA00=0005CA00 LIBRTL (Image)
contents of: 38: 001C7000+000000C0=001C70C0
LIBTRL\LIB$VM\LIB$GET_VM (Block)
[ASCII representation]001C710B is read and write accessible by the user
LIBRTL\LIB$VM\LIB$GET_VM (Block) has 39 segments using 00002160 bytes
Figure 12.6, ''Heap Analyzer Memory Map Context-Sensitive Pop-Up Menu'' shows the Memory Map context-sensitive pop-up menu. The figure then lists all the mouse and pop-up menu item choices available in the Memory Map.
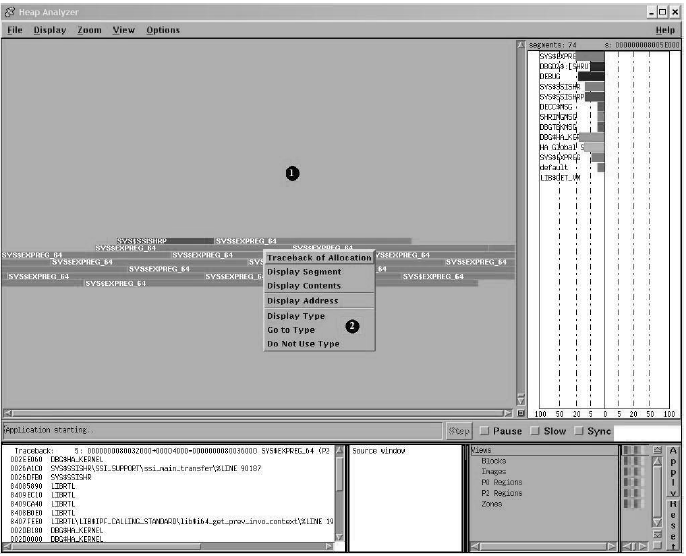
1. Memory Map | Click MB1: Displays the segment definition in the Message window. |
2. Map Pop-Up | Traceback of Allocation: Displays the traceback information associated with a segment in the Information window (see Section 12.2.4, ''Requesting Traceback Information''). Display Segment: Displays the segment definition in the Information window. Display Contents: Displays the segment definition and contents of each address in the Information window. Display Address: Displays the position (address) under your cursor and the type of user access in the Information window. Display Type: Displays the segment type definition in the Information window. Go to Type: Allows you to jump from a segment type listed in the Type Histogram to the same segment type listed in the Views-and-Types Display. Do Not Use Type: Adds a segment type to the Do-not-use Type List. |
12.2.4. Requesting Traceback Information
After you identify an individual segment of interest, choose the Traceback of Allocation menu item in the Memory Map pop-up menu. Traceback information can help you understand why your segment was created. Viewing traceback is also a preliminary step to displaying application code.
traceback: 8:000BA800+00065C00=00120400 DECC$SHR (Image) 00066EDE DBG$HA_KERNEL 00005864 CRL$MAIN_DB\CRL_LIBRARY\crl__initialize_libraries\%LINE 5592
12.2.5. Correlating Traceback Information with Source Code
When the traceback display appears, you identify the traceback entry most closely associated with the segment you are investigating. Most often, you can do this by comparing segment type names and traceback routine names.
When you double click MB1 on this traceback entry, the source code associated with the entry appears (highlighted) in the Source window. You can then scroll through the source code display, identify problematic code, and decide how to correct it.
If you cannot identify any problems in the displayed source code, return to the Information window and double click MB1 on the routine immediately above or below your previous choice.
If you double click MB1 on a traceback entry, and 'Source Not Available' messages appear in the Source window, you may have forgotten to set a source directory at the beginning of your Heap Analyzer session. See Section 12.1.5, ''Setting a Source Directory'' for information on setting a search directory.
Figure 12.7, ''Heap Analyzer Information and Source Windows'' shows the source code that appears when you double click MB1 on the traceback entry highlighted in the Information window. The figure then lists all the mouse and menu item choices available for the Source and Information windows.
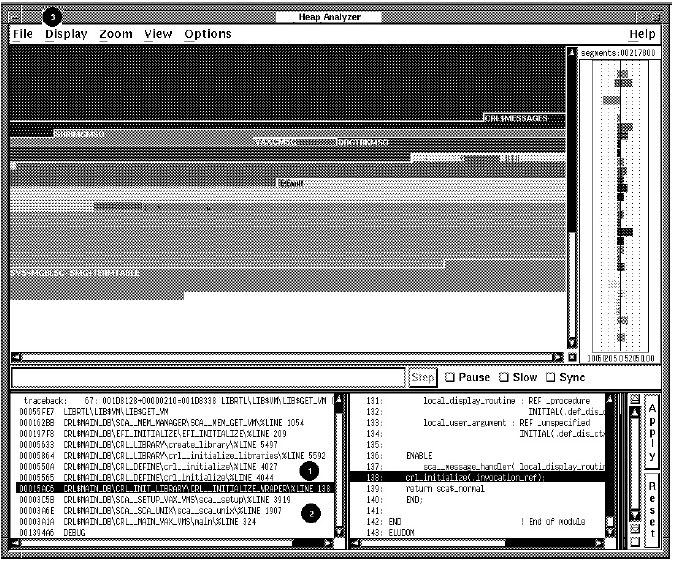
1. Information Window | Double click MB1: Allows you to jump from a line of traceback displayed in the Information window to the related source code in the Source window. |
2. Information Window Pop-Up | Go to Source: Allows you to jump from a line of traceback displayed in the Information window to the related source code in the Source window. |
3. Display Menu | Clear Information window: Clears text and messages from the Information window. |
12.3. Adjusting Type Determination and Display
The following sections describe the steps to perform when the memory events represented in the default Memory Map are not clear; that is, you cannot tell whether a problem exists or not.
This circumstance can occur when the segment type names chosen by the Heap Analyzer are too broad to be useful for your application, or when the Memory Map is so full that you cannot easily see the segment of interest.
Review the type summary in the Type Histogram (to see a summary, in total segments and total bytes, of each segment type's use)
Adjust the type determination in the Memory Map (directing the Heap Analyzer to select type names that are more meaningful to you)
Adjust the type display in the Memory Map (directing the Heap Analyzer to suppress some types and highlight others)
If, by adjusting the type determination or display, you then identify visible problems, you can resolve them in the same way you would if you were working with the default Memory Map display. (For more information, see Section 12.2, ''Working with the Default Display''.)
12.3.1. Options for Further Information
As you examine the Memory Map, you may wish to see a summary of Memory Map activity in the Type Histogram. The Type Histogram, which is two histograms back-to-back, shows the percentage of total segments and the percentage of total bytes devoted to each segment type in the Memory Map.
To see these graphical representations in numeric form, click MB1 on the segment type of interest.
To see the total number of segments or total number of bytes, check the top of each histogram.
Figure 12.8, ''Heap Analyzer Type Histogram'' shows the types listed in the Type Histogram. (This window has been resized so all types appear.) The figure then lists all the mouse and menu item choices available in the Type Histogram.
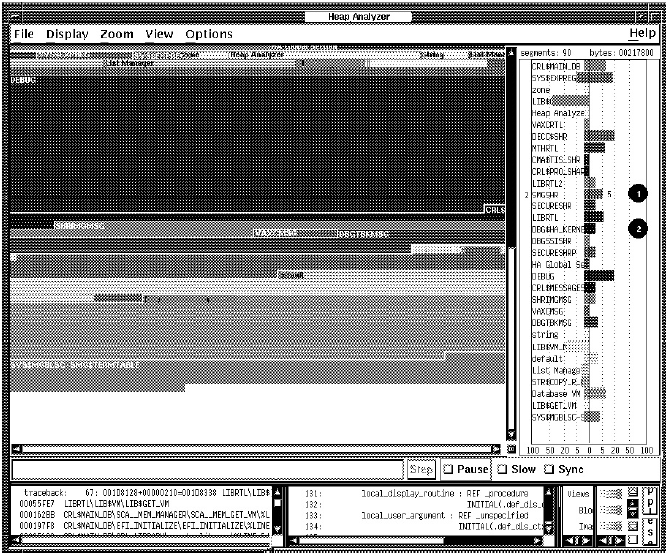
1. Type Histogram | Click MB1: Displays the percentage of total segments and the percentage of total bytes represented by a segment. |
2. Type Histogram Pop-Up | Display Type:Displays a type definition in the Information window. Go To Type: Allows you to jump from a segment type listed in the Type Histogram to the same segment type listed in the Views-and-Types Display. Do Not Use Type: Adds a segment type to the Do-not-use Type List. |
12.3.2. Altering Type Determination
As you examine the Memory Map, you may find that some segment type names are not meaningful to you. By adding these names to the Do-not-use Type List, you direct the Heap Analyzer to rename segments and, if necessary, regenerate the Memory Map display.
By default, the analyzer assigns segment type names at the creation of a segment. In some cases, the analyzer assigns an element name (for example, LIBRTL). In most cases, however, the analyzer searches down the call stack to find a routine name that then serves as a segment type name.
The analyzer chooses the first routine name on the call stack that is not prohibited by the Do-not-use Type List. If the first routine is prohibited, the analyzer examines the next routine down, and so on.
The same few type names appear repeatedly in the Memory Map display.
This occurs when the first routines on the call stack are low-level memory management or utility routines. Since most of the allocation events in your application use these routines, you see unrelated allocations grouped together with the same type name.
To prevent this problem, add any application-specific memory management or utility routine names to the Do-not-use Type List before you run your application.
The type names assigned provide a higher level of abstraction than you require.
This can occur when the first routine on the call stack is less application-bound than your level of examination. If you need to see type names that reflect application functions, it is not helpful to see type names derived from intermediary memory management routines instead.
This can also occur when the first routine on the call stack focuses on a part of your application you are not interested in examining. If you need to see type names that reflect subsystem functions (for example, initialize_death_star), it is not helpful to see only one type name for all subsystem functions (for example, initialize_star).
To correct this problem, add the current type name to the Do-not-use Type List until the Memory Map display reflects the level of abstraction you desire.
To add a segment type name to the Do-not-use Type List, you can select the Add to Do-not-use Type List pull-down menu item in the Options menu, or you can choose the Do Not Use Type pop-up menu item in the Memory Map, Type Histogram, or Views-and-Types Display. To delete a segment type from this list, choose the Use Type pop-up menu item in the Do-not-use Type List.
To save the contents of a Do-not-use Type List, you can choose the Save Do-not-use Type List menu item in the Options menu. This saves the list for future Heap Analyzer sessions. The Restore Do-not-use Type List menu item removes recent additions to the list since the last time the list was saved.
Figure 12.9, ''Heap Analyzer Do-Not-Use Type List'' shows a LIBRTL\*\* entry in the Add to Do-not-use Type List dialog box you can choose from the Options menu. The figure then lists all the mouse and menu item choices available for the Do-not-Use Type List.
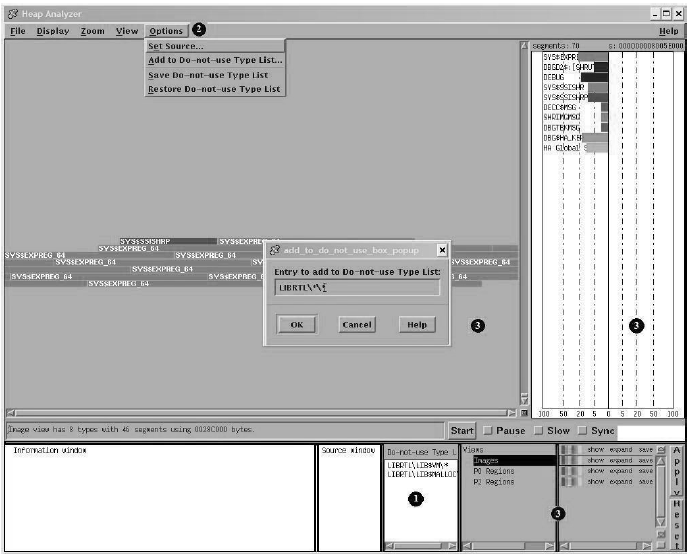
1. Do-not-use Type List Pop-Up | Use Type: Deletes a segment type from the Do-not-use Type List. |
2. Options Menu | Add to Do-not-use Type List: Adds a segment type to the Do-not-use Type List. Save Do-not-use Type List: Allows you to save the segment types listed in your Do-not-use Type List between Heap Analyzer sessions. Restore Do-not-use Type List: Deletes additions to the Do-not-use Type List since the list was last saved. |
3. Memory Map Pop-Up, Histogram Pop-Up, Views-and-Types Display Pop-Up | Do Not Use Type: Adds a segment type to the Do-not-use Type List. |
12.3.3. Altering the Views-and-Types Display
As you examine the Memory Map, you may find that you need to adjust the type display to focus more clearly on your area of interest. The Views-and-Types Display allows you to specify changes to multiple or individual segments of the same type.
The Views-and-Types Display is actually two windows separated by a window sash. You can expand the left window to show all the known types in your application. The right window contains the display options (color, show status, expand status, and save status).
12.3.3.1. Selecting the Scope of Your Change
The Heap Analyzer receives information about segments from four OpenVMS memory managers that perform allocations and deallocations in memory space. Each memory manager has a slightly different view, or overall picture, of dynamic memory.
Each memory manager recognizes a different set of segment types. This means that, within the Heap Analyzer, where views from the memory managers are layered on each other, a single memory location can be associated with one or more segment types.
Views (integrates all four views)
Blocks (block view from LIB$VM memory manager)
Images (image view from SYS$IMAGE memory manager)
Regions (system services view from SYS$SERVICES memory manager)
Zones (zone view from LIB$VM_ZONE memory manager)
To see the individual segment types recognized by each memory manager, expand the default display by double clicking MB1 on Blocks, Images, Regions, or Zones keywords. To collapse an individual listing, click MB3 on the keyword you previously selected.
To affect all segment types in all views: Click MB1 on the Views keyword.
To affect all segment types in one view: Click MB1 on the Blocks, Images, Regions, or Zones keywords.
To affect individual segment types: Double click MB1 on the view of your choice, and click MB1 on one or more single segment types.
Figure 12.10, ''Heap Analyzer Views-and-Types Hierarchy'' shows the Block hierarchy item that is highlighted when you click MB1 to choose all blocks. The figure then lists all the mouse and menu item choices available in the hierarchy side of the Views-and-Types Display.
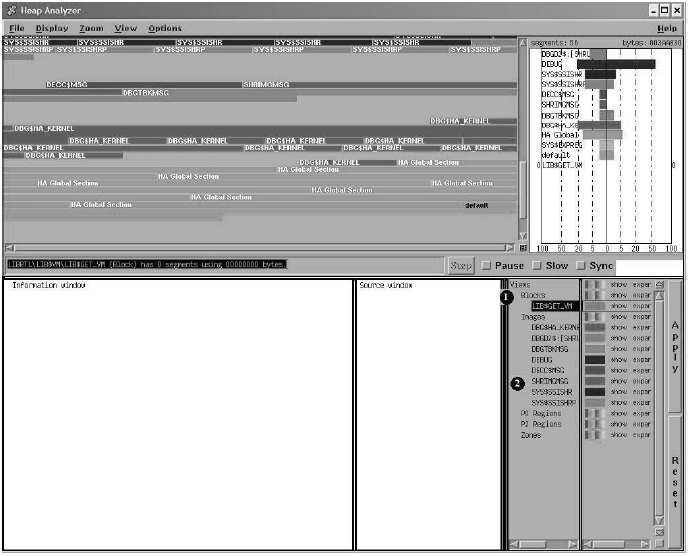
1. Double click MB1 | Allows you to expand (or collapse) the Views-and-Types hierarchy. |
2. Views Hierarchy Pop-Up | Display Type:Displays a type definition in the Information window. Go to Type: Highlights the type you have selected in the Views-and-Types Display. Do Not Use Type: Adds a segment type to the Do-not-use Type List. |
12.3.3.2. Choosing a Display Option
Color
To change the color of all segment types, all segment types in a particular view, or individual segment types, click MB3 on the color button in the display. When the vertical color strip appears, click MB1on the color of your choice. Then, click the Apply button to apply your change.
Show (or hide) status
To suppress (or restore) the display of all segment types, all segment types in a particular view, or individual segment types, toggle the Show button to the Hide (or Show) setting and click MB1. (Alternatively, you can choose the appropriate menu item from the Show pop-up menu.) Then, click the Apply button to apply your change.
Use this option to clear the Memory Map of segments you are not examining. You can also use this option to find all segments of a particular type(by hiding every other segment).
Expand (or collapse) status
To collapse (or expand) the display of segment types contained within all segment types, all segment types in a particular view, or individual segment types, toggle the Expand button to the Collapse (or Expand) setting and click MB1. (Alternatively, you can choose the appropriate menu item from the Expand pop-up menu.) Then, click the Apply button to apply your change.
Use this option to clear the Memory Map of nested segments you are not examining. Depending on your application, Heap Analyzer performance may also improve.
Save (or remove) status
To destroy (or save) information on all segment types, all segment types in a particular view, or individual segment types, toggle the Save button to the Remove (or Save) setting and click MB1. (Alternatively, you can choose the appropriate menu item from the Save pop-up menu.) Then, click the Apply button to apply your change.
Use this option to clear the Memory Map completely, and then resume Memory Map display. See Section 12.5, ''Sample Session'' to see how this can be valuable when you examine interactive commands.
To cancel a choice, click the Reset button, or choose the Reset menu item from the Show, Expand, or Save pop-up menus.
Figure 12.11, ''Heap Analyzer Views-and-Types Display Options'' shows the Show pop-up menu that appears when you click MB3 on the options side of the Views-and-Types Display (the scope of your change, Blocks, has been previously highlighted). The figure then lists the mouse and menu item choices available in the options side of the Views-and-Types Display.
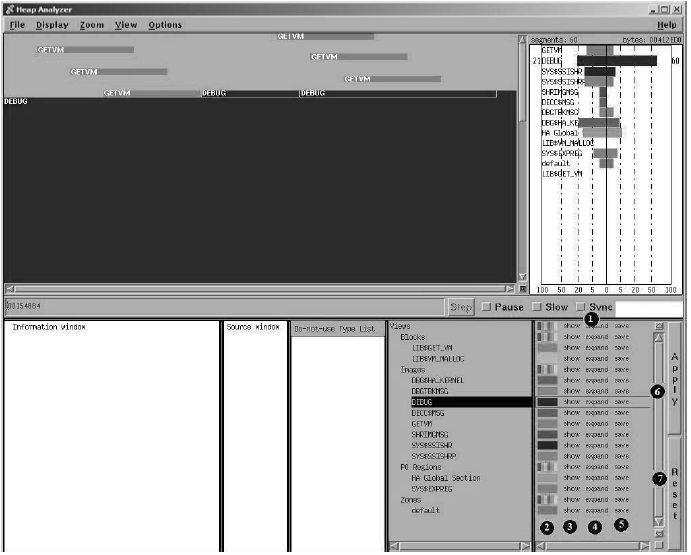
1. Click MB1 | Toggles the Show, Expand, and Save toggle buttons. |
2. Color Pop-Up | Controls the color display for individual types or groups of types. |
3. Show Pop-Up | Controls the display of segment types you have chosen. Show and Hide menu items allow you to restore or suppress display; Reset cancels your choice. |
4. Expand Pop-Up | Controls the display of segments within segment types you have chosen. Expand and Collapse menu items allow you to restore or suppress display; Reset cancels your choice. |
5. Save Pop-Up | Controls the Heap Analyzer's ability to show and store information on the segment types you have selected. The Remove menu item destroys all information;Save restores the ability to show and store information; and Reset cancels your choice. |
6. Apply Button | Applies your selections to the Memory Map display. |
7. Reset Button | Cancels your selections. |
12.4. Exiting the Heap Analyzer
To exit the Heap Analyzer, choose Exit from the File menu on the Heap Analyzer screen.
12.5. Sample Session
This section contains an example that shows how to combine information from Heap Analyzer windows and menus to locate a particular memory leak in your application.
The example assumes that you have invoked the Heap Analyzer and run your application. As you scroll back through the Memory Map display, you focus your attention on segments that appear when your application calls for an interactive command.
12.5.1. Isolating Display of Interactive Command
You suspect that the leak occurs when you enter an interactive SHOW UNITS
command, so your first step is to clear the Memory Map and reenter the command.
Click on Remove for the Views item within the Views-and-Types Display. Then click on the Apply button.
The Heap Analyzer clears all previous output from the Memory Map.
Click on Save for the Views item. Then click on the Apply button.
The Heap Analyzer will save all subsequent output to the Memory Map.
In another DECterm window, at your application's prompt, enter several
SHOW UNITScommands.The Heap Analyzer shows a small series of segments that appear to be incrementing, but the scale is too small for you to be sure.
Choose the Extremely Close menu item in the Zoom menu.
The Heap Analyzer provides a closer view of the segments.
The memory space allocated to each SCA__MEM_GET_VM segment is slightly larger with each
SHOW UNITS command (see Figure 12.12, ''Incrementing Memory Allocation Indicates a Memory Leak''). This
growth in what should be a same-size allocation indicates a memory leak.
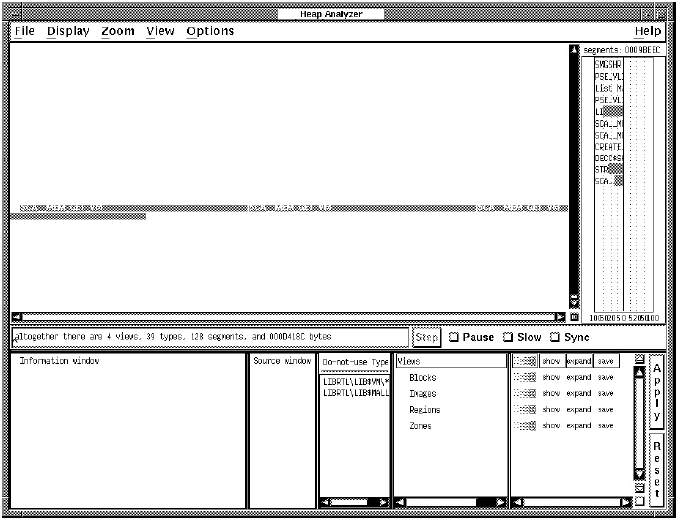
12.5.2. Adjusting Type Determination
The Heap Analyzer labels the segment type associated with your segments as SCA__MEM_GET_VM. This is a fairly low-level memory management routine that many segments might share. Your next step is to redefine the segment type to a more meaningful level of abstraction, perhaps one corresponding to the name of an application routine.
Position your mouse pointer over one of the segments, and click MB3.
The Heap Analyzer displays the Memory Map's context-sensitive pop-up menu.
Choose Do Not Use Type from the pop-up menu.
The segment type associated with your segment changes from SCA__MEM_GET_VM to the more meaningful crl_begin_unit_query (see Figure 12.13, ''The Do-Not-Use Type Menu Item Redefines Segment Type'').
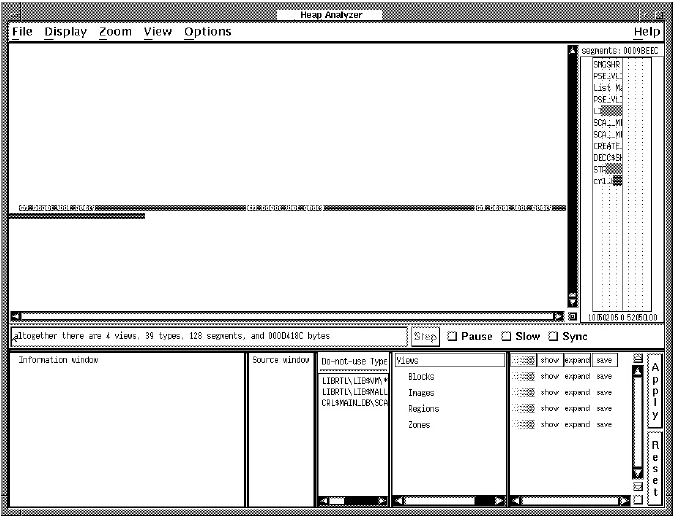
12.5.3. Requesting Traceback Information
After you determine the level of abstraction at which you want to view your segment, the next step is to examine the state of the call stack when the segment was allocated. Reviewing the traceback associated with a segment can reveal when and why it was created, and why a memory problem is occurring.
Position your mouse pointer over your segment, and click MB3.
The Heap Analyzer displays the Memory Map's context-sensitive pop-up menu.
Choose the Traceback of Allocation menu item from the pop-up menu.
Traceback information for your segment appears in the Information window.
12.5.4. Correlating Traceback with Source Code
The traceback for your segment indicates that the crl_begin_unit_query routine sets up the
environment for the SHOW UNITS command. To examine this event
further, you can request to see the source code associated with it.
To request source code, double click MB1 on the traceback line that refers to crl_begin_unit_query.
Source code appears in the Source window. The routine call that placed crl_begin_unit_query on the call stack is highlighted (see Figure 12.14, ''The Click on Traceback Entry Shows Associated Source Code'').
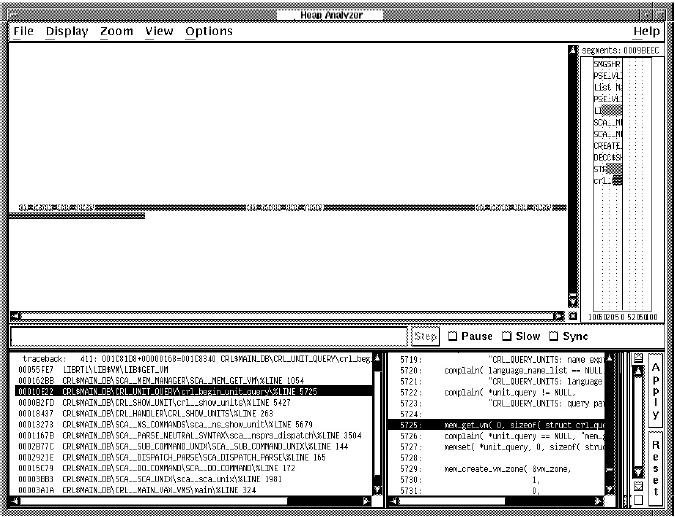
12.5.5. Locating an Allocation Error in Source Code
After you connect a traceback entry to a routine in your application source code, you can enlarge the Source window and search for allocation errors in that source code location.
For example, the highlighted line 5725 in Figure 12.15, ''Review of Source Code Shows Double Allocation'' makes an allocation to unit_query. This allocation is not deallocated before line 5740, where an additional allocation occurs. This coding error is the cause of your memory leak.
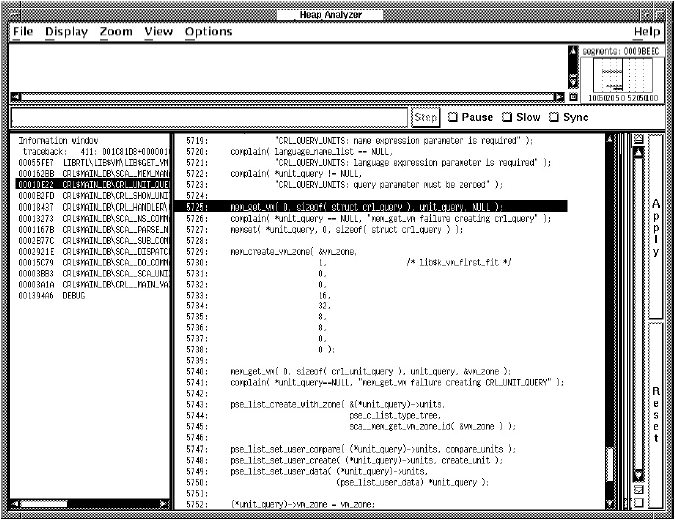
Chapter 13. Additional Convenience Features
Using debugger command procedures
Using an initialization file for a debugging session
Logging a debugging session into a file
Defining symbols to represent commands, address expressions, or values
Assigning debugger commands to function keys
Using control structures to enter commands
Calling arbitrary routines linked with your program
13.1. Using Debugger Command Procedures
A debugger command procedure is a sequence of commands contained in a file. You can direct the debugger to execute a command procedure to re-create a debugging session, to continue a previous session, or to avoid typing the same debugger commands many times during a debugging session. You can pass parameters to command procedures.
As with DCL command procedures, you execute a debugger command procedure by preceding its file
specification with an at sign (@). The @ is the
execute procedure command.
Debugger command procedures are especially useful when you regularly perform a number of standard setup debugger commands, as specified in a debugger initialization file (see Section 13.2, ''Using a Debugger Initialization File''). You can also use a debugger log file as a command procedure (see Section 13.3, ''Logging a Debugging Session into a File'').
13.1.1. Basic Conventions
BREAK7.COM:! ***** Debugger Command Procedure BREAK7.COM ***** SET BREAK/AFTER:3 %LINE 120 DO (EXAMINE K, N, J, X(K); GO) SET BREAK/AFTER:3 %LINE 160 DO (EXAMINE K, N, J, X(K), S; GO) SET BREAK %LINE 90
When you execute this command procedure with the execute procedure (@) command, the commands listed in the procedure are executed in the order they appear.
The rules for entering commands in command procedures are listed in the debugger's online help
(type HELP Command_Format).
You can pass parameters to a command procedure. See Section 13.1.2, ''Passing Parameters to Command Procedures'' for conventions on passing parameters.
You can enter the execute procedure (@) command like any other debugger
command:directly from the terminal, from within another command procedure, from
within a DO clause in a command such as SET
BREAK, or from within a DO clause in a screen
display definition.
SYS$DISK:[]DEBUG.COM as the
default file specification for command procedures. For example, enter the following
command line to execute command procedure BREAK7.COM, located
in your current default
directory:DBG> @BREAK7
The SET ATSIGN command enables you to change any or
all fields of the default file specification,
SYS$DISK:[]DEBUG.COM. The SHOW ATSIGN
command identifies the default file specification for command procedures.
By default, commands read from a command procedure are not echoed. If
you enter the SET OUTPUT VERIFY command, all commands read from a
command procedure are echoed on the current output device, as specified by
DBG$OUTPUT (the default output device is SYS$OUTPUT). Use the
SHOW OUTPUT command to determine whether commands read from a
command procedure are echoed or not.
If the execution of a command in a command procedure results in a diagnostic of severity warning or greater, the command is aborted but execution of the command procedure continues at the next command line.
13.1.2. Passing Parameters to Command Procedures
As with DCL command procedures, you can pass parameters to debugger command procedures. However, the technique is different in several respects.
Subject to the conventions described here, you can pass as many parameters as you want to a debugger command procedure. The parameters can be address expressions, commands, or value expressions in the current language. You must surround command strings in quotation marks ("), and you must separate parameters by commas (, ).
A debugger command procedure to which you pass parameters must contain a
DECLARE command line that binds each actual (passed)
parameter to a formal parameter (a symbol) declared within the command procedure.
DECLARE command is valid only within a command procedure. Its syntax is
as follows:
DECLAREp-name:p-kind[,p-name:p-kind[, …]]
p-name: p-kind pair associates a formal parameter
(p-name) with a parameter kind
(p-kind). The valid p-kind
keywords are as follows: |
ADDRESS |
Causes the actual parameter to be interpreted as an address expression |
|
COMMAND |
Causes the actual parameter to be interpreted as a command |
|
VALUE |
Causes the actual parameter to be interpreted as a value expression in the current language |
DECLARE DBG:ADDRESS, within command procedure
EXAM.COM, declares the formal parameter DBG. The actual
parameter passed to EXAM.COM is interpreted as an address
expression. The command EXAMINE DBG displays the value of that
address expression. The command SET OUTPUT VERIFY causes the
commands to echo when they are read by the
debugger.! ***** Debugger Command Procedure EXAM.COM ***** SET OUTPUT VERIFY DECLARE DBG:ADDRESS EXAMINE DBG
EXAM.COM by passing the actual parameter
ARR24. Within EXAM.COM, ARR24 is interpreted as an address
expression (an array variable, in this case).
DBG> @EXAM ARR24
%DEBUG-I-VERIFYIC, entering command procedure EXAM
DECLARE DBG:ADDRESS
EXAMINE DBG
PROG_8\ARR24
(1): Mark A. Hopper
(2): Rudy B. Hopper
(3): Tim B. Hopper
(4): Don C. Hopper
(5): Mary D. Hopper
(6): Jeff D. Hopper
(7): Nancy G. Hopper
(8): Barbara H. Hopper
(9): Lon H. Hopper
(10): Dave H. Hopper
(11): Andy J. Hopper
(12): Will K. Hopper
(13): Art L. Hopper
(14): Jack M. Hopper
(15): Karen M. Hopper
(16): Tracy M. Hopper
(17): Wanfang M. Hopper
(18): Jeff N. Hopper
(19): Nancy O. Hopper
(20): Mike R. Hopper
(21): Rick T. Hopper
(22): Dave W. Hopper
(23): Jim W. Hopper
(24): Robert Z. Hopper
%DEBUG-I-VERIFYIC, exiting command procedure EXAM
DBG>Each p-name: p-kind pair specified by a
DECLARE command binds one parameter. For example, if you want
to pass five parameters to a command procedure, you need five corresponding
p-name: p-kind pairs. The
pairs are always processed in the order in which you specify them.
EXAM_GO.COM, accepts two
parameters: an address expression (L) and a command string (M). The address
expression is then examined and the command is
executed:! ***** Debugger Command Procedure EXAM_GO.COM ***** DECLARE L:ADDRESS, M:COMMAND EXAMINE L; M
EXAM_GO.COM by passing a
variable X to be examined and a command @DUMP.COM to be
executed:DBG> @EXAM_GO X, "@DUMP"The %PARCNT built-in symbol, which can be used only within a command procedure, enables you to pass a variable number of parameters to a command procedure. The value of %PARCNT is the number of actual parameters passed to the command procedure.
VAR.DBG, contains the following
lines:! ***** Debugger Command Procedure VAR.DBG ***** SET OUTPUT VERIFY ! Display the number of parameters passed: EVALUATE %PARCNT ! Loop as needed to bind all passed parameters and obtain their values: FOR I = 1 TO %PARCNT DO (DECLARE X:VALUE; EVALUATE X)
VAR.DBG, passing the parameters 12,
37, and 45:
DBG> @VAR.DBG 12, 37, 45
%DEBUG-I-VERIFYIC, entering command procedure VAR.DBG
! Display the number of parameters passed:
EVALUATE %PARCNT3
! Loop as needed to bind all passed parameters! and get their values:
FOR I = 1 TO %PARCNT DO (DECLARE X:VALUE; EVALUATE X)
12
37
45
%DEBUG-I-VERIFYIC, exiting command procedure VAR.DBG
DBG>When VAR.DBG is executed, %PARCNT has the value 3. Therefore, the FOR
loop within VAR.DBG is repeated 3 times. The FOR loop causes
the DECLARE command to bind each of the three actual parameters
(starting with 12) to a new declaration of X. Each actual parameter is interpreted
as a value expression in the current language, and the EVALUATE X
command displays that value.
13.2. Using a Debugger Initialization File
A debugger initialization file is a command procedure, assigned the logical name
DBG$INIT, that the debugger automatically executes at debugger
startup. Every time you start the debugger, the commands contained in the file are
automatically executed.
An initialization file contains any command lines you might always enter at the start of a debugging session to either tailor your debugging environment or control the execution of your program in a predetermined way from run to run.
DEBUG_START4.COM containing the
following commands:
! ***** Debugger Initialization File DEBUG_START4.COM ***** ! Log debugging session into default log file (SYS$DISK:[]DEBUG.LOG) SET OUTPUT LOG ! ! Echo commands as they are read from command procedures: SET OUTPUT VERIFY ! ! If source files are not in current default directory, use [SMITH.SHARE] SET SOURCE [], [SMITH.SHARE] ! ! Invoke screen mode: SET MODE SCREEN ! ! Define the symbol SB as the SET BREAK command: DEFINE/COMMAND SB = "SET BREAK" ! ! Assign the SHOW MODULE * command to KP7: DEFINE/KEY/TERMINATE KP7 "SHOW MODULE *"
DEFINE. For example:
$ DEFINE DBG$INIT WORK:[JONES.DBGCOMFILES]DEBUG_START4.COM13.3. Logging a Debugging Session into a File
SHOW OUTPUT !noverify, terminal, noscreen_log, logging to DSK2:[JONES.P7]DEBUG.LOG;1 SET STEP NOSOURCE SET TRACE %LINE 30 SET BREAK %LINE 60 SHOW TRACE !tracepoint at PROG4\%LINE 30 GO !trace at PROG4\%LINE 30 !break at PROG4\%LINE 60 ⋮
The DBG> prompt is not recorded, and the debugger output is commented
outwith exclamation points so the file can be used as a debugger command procedure
without modification. Thus, if a lengthy debugging session is interrupted, you can
execute the log file as you would any other debugger command procedure. Executing the
log file restores the debugging session to the point at which it was previously
terminated.
SET OUTPUT LOG
command. By default, the debugger writes the log to
SYS$DISK:[]DEBUG.LOG. To name a debugger log file, use the
SET LOG command. You can override any field of the default file
specification. For example, after you enter the following commands, the debugger logs
the session to the file [JONES.WORK2]MONITOR.LOG:
DBG>SET LOG [JONES.WORK2]MONITORDBG>SET OUTPUT LOG
You might want to enter the SET OUTPUT LOG command in your debugger
initialization file (see Section 13.2, ''Using a Debugger Initialization File'').
The SHOW LOG command reports whether the debugger is
writing to a log file and identifies the current log file. The SHOW
OUTPUT command identifies all current output options.
If you are debugging in screen mode, the SET OUTPUT
SCREEN_LOG command enables you to log the screen contents as the screen is
updated. To use this command, you must already be logging your debugging session - that
is, the SET OUTPUT SCREEN_LOG command is valid only after you enter
the SET OUTPUT LOG command. Using SET OUTPUT
SCREEN_LOG is not desirable for a long debugging session, because storing
screen information in this manner results in a large log file. For other techniques on
saving screen-mode information, see the SAVE and
EXTRACT command descriptions.
To use a log file as a command procedure, first enter the SET OUTPUT VERIFY
command so that debugger commands are echoed as they are read.
13.4. Defining Symbols for Commands, Address Expressions, and Values
The DEFINE command enables you both to create a symbol for a lengthy or
often-repeated command sequence or address expression and to store the value of a
language expression in a symbol.
You specify the kind of symbol you want to define by the command qualifier you use with the
DEFINE command (/COMMAND,
/ADDRESS, or /VALUE). The default qualifier is
/ADDRESS. If you plan to enter several DEFINE
commands with the same qualifier, you can first use the SET DEFINE
command to establish a new default qualifier (for example, SET DEFINE
COMMAND makes the DEFINE command behave like
DEFINE/COMMAND). The SHOW DEFINE command
identifies the default qualifier currently in effect.
Use the SHOW SYMBOL/DEFINED command to identify symbols
you have defined with the DEFINE command. Note that the SHOW
SYMBOL command without the /DEFINED qualifier
identifies only the symbols that are defined in your program, such as the names of
routines and variables.
Use the DELETE command to delete symbol definitions
created with the DEFINE command.
When defining a symbol within a command procedure, use the
/LOCAL qualifier to confine the symbol definition to that command
procedure.
13.4.1. Defining Symbols for Commands
DEFINE/COMMAND command to equate one or more command strings to a
shorter symbol. The basic syntax is shown in the following
example:DBG>DEFINE/COMMAND SB = "SET BREAK"DBG>SB PARSER
In the example, the DEFINE/COMMAND command equates the symbol SB to the
string SET BREAK (note the use of the quotation marks to delimit
the command string). When the command line SB PARSER is executed,
the debugger substitutes the string SET BREAK for the symbol SB
and then executes the SET BREAK command.
DEFINE/COMMAND command equates the symbol BT
to the string consisting of the SHOW BREAK command followed by
the SHOW TRACE command (use semicolons to separate multiple
command
strings):DBG> DEFINE/COMMAND BT = "SHOW BREAK;SHOW TRACE"SHOW SYMBOL/DEFINED command identifies the symbol BT as
follows:DBG> SHOW SYM/DEFINED BT
defined BT
bound to: "SHOW BREAK;SHOW TRACE"
was defined /command
DBG>DBG> DEFINE/COMMAND DUMP = "@DUMP_PROG2.COM"13.4.2. Defining Symbols for Address Expressions
Use the DEFINE/ADDRESS command to equate an address expression to a symbol.
/ADDRESS is the default qualifier for the
DEFINE command, but it is used in the following examples for
emphasis.
SET
BREAK B1 command then sets a breakpoint on line 378:
DBG>DEFINE/ADDRESS B1 = %LINE 378DBG>SET BREAK B1
DEFINE/ADDRESS command is useful when you need to specify a long
pathname repeatedly to reference the name of a variable or routine that is defined
multiple times. In the next example, the symbol UX is equated to the path name
SCREEN_IO \UPDATE \X; the abbreviated command line EXAMINE UX can
then be used to obtain the value of X in routine UPDATE of module SCREEN_IO:
DBG>DEFINE UX = SCREEN_IO\UPDATE\XDBG>EXAMINE UX
13.4.3. Defining Symbols for Values
Use the DEFINE/VALUE command to equate the current value of a language
expression to a symbol (the current value is the value at the time the
DEFINE/VALUE command was entered).
DEFINE/VALUE command to
count the number of calls to a
routine:DBG>DEFINE/VALUE COUNT = 0DBG>SET TRACE/SILENT ROUT DO (DEFINE/VALUE COUNT = COUNT + 1)DBG>GO⋮ DBG>EVALUATE COUNT14 DBG>
In the example, the first DEFINE/VALUE command initializes the value of the
symbol COUNT to 0. The SET TRACE command sets a silent tracepoint
on routine ROUT and (through the DO clause)
increments the value of COUNT by 1 every time ROUT is called.
After execution is resumed and eventually suspended, the EVALUATE
command obtains the current value of COUNT (the number of times that
ROUT was called).
13.5. Assigning Commands to Function Keys
To facilitate entering commonly used commands, the function keys on the keypad have predefined
debugger functions that are established when you start the debugger. These predefined
functions are identified in Appendix A, " Predefined Key Functions" and the debugger's online help
(type HELP Keypad). You can modify the functions of the keypad
keys to suit your individual needs. If you have a VT200- or VT300-series terminal or a
workstation, you can also bind commands to the additional function keys on the LK201
keyboard.
The debugger commands DEFINE/KEY, SHOW KEY, and
DELETE/KEY enable you to assign, identify, and delete key
definitions, respectively. Before you can use this feature, keypad mode must be enabled
with the SET MODE KEYPAD command (keypad mode is enabled by default).
Keypad mode also enables you to use the predefined functions of the keypad keys.
To use the keypad keys to enter numbers rather than debugger commands, enter the SET
MODE NOKEYPAD command.
13.5.1. Basic Conventions
DEFINE/KEY command, which is similar to the DCL command
DEFINE/KEY, enables you to assign a string to a function key.
In the following example, the DEFINE/KEY command defines KP7
(keypad key 7) to enter and execute the SHOW MODULE *
command:DBG> DEFINE/KEY/TERMINATE KP7 "SHOW MODULE *"
%DEBUG-I-DEFKEY, DEFAULT key KP7 has been defined
DBG>You must use a valid key name (such as KP7) with the commands DEFINE/KEY,
SHOW KEY, and DELETE/KEY. See the DEFINE/KEY command for the valid key names that you can use with these
commands for VT52 and VT100-series terminals and for LK201 keyboards.
In the previous example, the /TERMINATE qualifier
indicates that pressing KP7 executes the command. You do not have to press Return
after pressing KP7.
You can assign any number of definitions to the same function key as
long as each definition is associated with a different state. The predefined states
(DEFAULT, GOLD, BLUE, and so on) are identified in Appendix A, " Predefined Key Functions" and
the debugger's online help (type HELP Keypad). In the
preceding example, the informational message indicates that KP7 has been defined for
the DEFAULT state (which is the default key state).
You can enter key definitions in a debugger initialization file (see Section 13.2, ''Using a Debugger Initialization File'') so that these definitions are available whenever you start the debugger.
SHOW KEY command. For
example:DBG> SHOW KEY KP7
DEFAULT keypad definitions:
KP7 = "SHOW MODULE *" (echo, terminate, nolock)
DBG>To display a key definition in a state other than the current state, specify that state with
the /STATE qualifier when entering the SHOW
KEY command. To see all key definitions in the current state, enter the SHOW
KEY/ALL command.
13.5.2. Advanced Techniques
This section shows more advanced techniques for defining keys, particularly techniques related to the use of state keys.
DBG> DEFINE/KEY/IF_STATE=BLUE KP9 "SET BREAK %LINE"The predefined DEFAULT key state is established by default. The predefined
BLUE key state is established by pressing the PF4 key. Enter the command line
assigned in the preceding example (SET BREAK %LINE …) by pressing PF4,
pressing KP9, entering a line number, and then pressing the Return
key to terminate and process the command line.
The SET KEY command enables you to change the default
state for key definitions. For example, after entering the SET
KEY/STATE=BLUE command, you do not need to press PF4 to enter the
command line in the previous example. Also, the SHOW KEY command
will show key definitions in the BLUE state, by default, and the
DELETE/KEY command will delete key definitions in the BLUE
state by default.
DBG>SET KEY/STATE=DEFAULTDBG>DEFINE/KEY/SET_STATE=RED/LOCK_STATE F12 ""
In this example, the SET KEY command establishes DEFAULT as the current
state. The DEFINE/KEY command makes F12 (LK201 keyboard) a state
key. As a result, pressing F12 while in the DEFAULT state causes the current state
to become RED. The key definition is not terminated and has no other effect (a null
string is assigned to F12). After pressing F12, you can enter RED
commands by pressing keys that have definitions associated with the
RED state.
13.6. Using Control Structures to Enter Commands
The FOR, IF, REPEAT, and
WHILE commands enable you to create looping and conditional
constructs for entering debugger commands. The associated command EXIT
LOOP is used to exit a FOR, REPEAT,
or WHILE loop. The following sections describe these commands.
See Section 4.1.6, ''Evaluating Language Expressions'' and Section 14.3.2.2, ''Evaluating Language Expressions'' for information about evaluating language expressions.
13.6.1. FOR Command
FOR command executes a sequence of commands while incrementing a
variable a specified number of times. It has the following
syntax:FORname=expression1TOexpression2[BYexpression3] DO(command[; …])
DBG> FOR I = 1 TO 10 DO (DEPOSIT A(I) = 0)13.6.2. IF Command
IF command executes a sequence of commands if a language expression
(Boolean expression) is evaluated as true. It has the following
syntax:IFboolean-expressionTHEN (command[; …]) [ELSE (command[;…])]
EXAMINE
X2 if X1 is not equal to −9.9, and issues the command EXAMINE Y1
otherwise:
DBG> IF X1 .NE. -9.9 THEN (EXAMINE X2) ELSE (EXAMINE Y1)FOR loop and a condition test. The
STEP command is issued if X1 is not equal to −9.9. The testis made four
times:DBG> FOR COUNT = 1 TO 4 DO (IF X1 <> -9.9 THEN (STEP))13.6.3. REPEAT Command
REPEAT command executes a sequence of commands a specified number of
times. It has the following
syntax:REPEATlanguage-expressionDO (command[; …])
EXAMINE Y then STEP) 10 times:
DBG> REPEAT 10 DO (EXAMINE Y; STEP)13.6.4. WHILE Command
WHILE command executes a sequence of commands while the language
expression (Boolean expression) you have specified evaluates as true. It has the
following syntax:
WHILEboolean-expressionDO (command[; …])
EXAMINE X2 and STEP if X2 is less
than X1:
DBG> WHILE X2 < X1 DO (EX X2;STEP)13.6.5. EXITLOOP Command
EXIT LOOP command exits one or more enclosing FOR, REPEAT,
or WHILE loops. It has the following syntax:
EXITLOOP [integer]The integer n specifies the number of nested loops to exit
from.
STEP command with each iteration. After each step, the value
of X is tested. If X is greater than 3, the EXIT LOOP command
terminates the
loop.DBG> WHILE TRUE DO (STEP; IF X > 3 THEN EXITLOOP)13.7. Calling Routines Independently of Program Execution
The CALL command enables you to execute a routine independently of the normal execution of
your program. It is one of the four debugger commands that you can use to execute your
program (the others are GO, STEP, and
EXIT).
The CALL command executes a routine whether or not your program actually
includes a call to that routine, as long as the routine was linked with your program.
Thus, you can use the CALL command to execute routines for any
purpose (for example, to debug a routine out of the context of program execution, call a
run-time library procedure, call a routine that dumps debugging information, and so on).
You can debug unrelated routines by linking them with a dummy main program that has a transfer
address, and then using the CALL command to execute them.
CALL command to display
some process statistics without having to include the necessary code in your program.
The example consists of calls to run-time library routines that initialize a timer
(LIB$INIT_TIMER) and display the elapsed time and various
statistics (LIB$SHOW_TIMER). (Note that the presence of the debugger
affects the timings and counts.)
DBG>SET MODULE SHARE$LIBRTLCALL LIB$INIT_TIMERCALL LIB$SHOW_TIMER
| The routines |
| This |
| The value returned message indicates the value returned in register R0
after the By convention, after a called routine has executed, register R0 contains the function return value (if the routine is a function) or the procedure completion status (if the routine is a procedure that returns a status value). If a called procedure does not return a status value or function value, the value in R0 might be meaningless, and the value returned message can be ignored. |
| This |
LIB$SHOW_VM (also in LIBRTL) to
display memory statistics. Again, note that the presence of the debugger affects the
counts.DBG>SET MODULE SHARE$LIBRTLDBG>CALL LIB$SHOW_VM1785 calls to LIB$GET_VM, 284 calls to LIB$FREE_VM, 122216 bytes still allocated value returned is 1 DBG>
You can pass parameters to routines with the CALL command. See the
CALL command description for details and examples.
Chapter 14. Debugging Special Cases
Optimized code
Screen-oriented programs
Multi language programs
Stack corruption
Exceptions and condition handlers
Exit handlers
AST-driven programs
Translated images
14.1. Debugging Optimized Code
By default, many compilers optimize the code they produce so that the program executes faster. With optimization, invariant expressions are removed from DO loops so that they are evaluated only once at run time; some memory locations might be allocated to different variables at different points in the program, and some variables might be eliminated so that you no longer have access to them while debugging.
The net result is that the code that is executing as you debug might not match the source code displayed in a screen-mode source display (see Section 7.4.1, ''Predefined Source Display (SRC)'') or in a source listing file.
To avoid the problems of debugging optimized code, many compilers allow you to specify
the /NOOPTIMIZE (or equivalent) command qualifier at compile time.
Specifying this qualifier inhibits most compiler optimization and thereby reduces
discrepancies between the source code and executable code caused by optimization.
If this option is not available to you, or if you have a definite need to debug optimized code, read this section. It describes the techniques for debugging optimized code and gives some typical examples of optimized code to show the potential causes of confusion. It also describes some features you can use to reduce the confusion inherent in debugging optimized code.
In order to take advantage of the features that improve the ability to debug optimized code, you need an up-to-date version of your language compiler. For definitive information about the necessary version of your compiler, please see your compiler release notes or other compiler documentation.
Note that about one-third more disk space is needed for debugging optimized code, to accommodate the increased image size.
When debugging optimized code, use a screen-mode instruction display, such as the
predefined display INST, to show the decoded instruction stream of
your program (see Section 7.4.4, ''Predefined Instruction Display (INST)''). An instruction
display shows the exact code that is executing.
In screen mode, pressing KP7 places the SRC and INST displays side by side for easy comparison. Alternatively, you can inspect a compiler-generated machine-code listing.
In addition, to execute the program at the instruction level and examine instructions, use the techniques described in Section 4.3, ''Examining and Depositing Instructions''.
Using these methods, you should be able to determine what is happening at the executable code level and be able to resolve the discrepancy between source display and program behavior.
14.1.1. Eliminated Variables
%DEBUG-W-UNALLOCATED, entity X was not allocated in memory
(was optimized away)
%DEBUG-W-NOVALATPC, entity X does not have a value at the
current PC PROGRAM DOC(OUTPUT);
VAR
X, Y: INTEGER;
BEGIN
X := 5;
Y := 2;
WRITELN(X*Y);
END./NOOPTIMIZE (or
equivalent) qualifier, you obtain the following (normal) behavior when
debugging:$ PASCAL/DEBUG/NOOPTIMIZE DOC
$ LINK/DEBUG DOC
$ DEBUG/KEEP
⋮
DBG> RUN DOC
⋮
DBG> STEP
stepped to DOC\%LINE 5
5: X := 5;
DBG> STEP
stepped to DOC\%LINE 6
6: Y := 2;
DBG> STEP
stepped to DOC\%LINE 7
7: WRITELN(X*Y);
DBG> EXAMINE X, Y
DOC\X: 5
DOC\Y: 2
DBG>/OPTIMIZE (or equivalent)
qualifier, because the values of X and Y are not changed after the initial
assignment, the compiler calculates X*Y, stores that value (10), and does not
allocate storage for X or Y. Therefore, after you start debugging, a
STEP command takes you directly to line 7 rather than line 5.
Moreover, you cannot examine X or
Y:$ PASCAL/DEBUG/OPTIMIZE DOC
$ LINK/DEBUG DOC
$ DEBUG/KEEP
⋮
DBG> RUN DOC
⋮
DBG> EXAMINE X, Y
%DEBUG-W-UNALLOCATED, entity X was not allocated in memory
(was optimized away)
DBG> STEP
stepped to DOC\%LINE 7
7: WRITELN(X*Y);
DBG>WRITELN
statement:DBG> STEP
stepped to DOC\%LINE 7
7: WRITELN(X*Y);
DBG> EXAMINE/OPERAND .%PC
DOC\%LINE 7: MOVL S^#10, B^-4(FP)
B^-4(FP) 2146279292 contains 62914576
DBG>14.1.2. Changes in Coding Order
Several methods of optimizing consist of performing operations in a sequence different from the sequence specified in the source code. Sometimes code is eliminated altogether.
As a result, the source code displayed by the debugger does not correspond exactly to the actual code being executed.
Line Source Code ---- ----------- 5 DO 100 I=1, 10 6 A(I) = 1/X 7 100 CONTINUE
Line Optimized Code Equivalent
---- -------------------------
5 TEMP = 1/X
DO 100 I=1, 10
6 A(I) = TEMP
7 100 CONTINUEDepending on the compiler implementation, the moved code maybe associated with the first line of the loop or may retain its original line number (common on Alpha systems).
If a discrepancy occurs, it is not obvious from looking at the displayed source line. Furthermore, if the computation of 1/X were to fail because X is 0, it would appear from inspecting the source display that a division by 0 had occurred on a source line that contains no division at all.
This kind of apparent mismatch between source code and executable code should be expected from time to time when you debug optimized programs. It can be caused not only by code motions out of loops, as in the previous example, but by a number of other optimization methods as well.
14.1.3. Semantic Stepping (Alpha Only)
Semantic stepping (available only on Alpha systems) makes stepping through
optimized code less confusing. The semantic-stepping mode complements the
traditional step-by-line and step-by-instruction modes. There are two commands for
semantic stepping: SET STEP SEMANTIC_EVENT and
STEP/SEMANTIC_EVENT.
Semantic Events
One problem of stepping through optimized code is that the apparent source program
location "bounces" back and forth with the same line often appearing again and
again. Indeed, sometimes the forward progress in STEP LINE mode
averages barely more than one instruction per STEP
command.
They represent the points in the program where the effects of the program actually happen.
These effects tend to happen in an order that remains close to the source order of events in the program.
Data event - An assignment to a user variable
Control event - A control flow decision, with a conditional or unconditional transfer of control, other than a call
Call event - A call (to a routine that is not stepped over)or a return from a call
When two instructions are required to assign to a complex or X_floating value, only the first instruction is treated as a semantic event.
When there are multiple branches that are part of a single higher-level construct, such as a decision tree of branches that implement a case or select construct, then only the first is treated as a semantic event.
When a call is made to a routine that is a compiler-specific helper routine, such as a call to OTS$MOVE, which handles certain kinds of string or storage copy operations, the call is not considered a semantic event. This means that control will not stop at the call.
To step into such a routine, you must do either of the following:Set a breakpoint at the routine entry point
Use a series of
STEP/INSTRUCTIONcommands to reach the call of interest and then useSTEP/INSTRUCTION/INTOto enter the called routine.
When there is more than one semantic event in a row with the same line number, then only the first is used.
SET STEP SEMANTIC_EVENT Command
The SET STEP SEMANTIC_EVENT command establishes the default
stepping mode as semantic.
STEP/SEMANTIC_EVENT Command
STEP/SEMANTIC_EVENT, or simply STEP when
semantic mode is in effect, causes a breakpoint to be set at the next semantic
event, whether an assignment, a transfer of control, or a call. Execution proceeds
to that next event. Parts of any number of different lines/statements may be
executed along the way without interfering with progress. When the semantic event is
reached (that is, when the instruction associated with that event is reached but not
yet executed), execution is suspended (similar to reaching the next line when
STEP/LINE is used).
Example of Semantic Stepping
#include <stdio.h>
#include <stdlib.h>
int main(unsigned argc, char **argv) {
int w, x, y, z=0;
x = atoi(argv[1]);
printf("%d\n", x);
x = 5;
y = x;
if (y > 2) { /* always true */
printf("y > 2");
}
else {
printf("y <= 2");
}
if (z) { /* always false */
printf("z");
}
else {
printf("not z");
}
printf("\n");
}- Stepping by line:
$ doct2:=$sys$disk:[]doct2 $ doct2 6 Debugger Banner and Version Number Language:: Module: Doct2: GO to reach DBG> go break at routine DOCT2\main 654: x = atoi(argv[1]); DBG> step stepped to DOCT2\main\%LINE 651 651: int main(unsigned argc, char **argv) { DBG> step stepped to DOCT2\main\%LINE 654 654: x = atoi(argv[1]); DBG> step stepped to DOCT2\main\%LINE 651 651: int main(unsigned argc, char **argv) { DBG> step stepped to DOCT2\main\%LINE 654 654: x = atoi(argv[1]); DBG> step stepped to DOCT2\main\%LINE 655 655: printf("%d\n", x); DBG> step stepped to DOCT2\main\%LINE 654 654: x = atoi(argv[1]); DBG> step stepped to DOCT2\main\%LINE 655 655: printf("%d\n", x); DBG> step 6 stepped to DOCT2\main\%LINE 661 661: printf("y > 2"); DBG> step y > 2 stepped to DOCT2\main\%LINE 671 671: printf("not z"); DBG> step not z stepped to DOCT2\main\%LINE 674 674: printf("\n"); DBG> step stepped to DOCT2\main\%LINE 675 675: } DBG> step 'Normal successful completion' DBG> - Stepping by semantic event:
$ doct2:=$sys$disk:[]doct2 $ doct2 6 Debugger Banner and Version Number Language:: Module: Doct2: GO to reach DBG> set step semantic_event DBG> go break at routine DOCT2\main 654: x = atoi(argv[1]); DBG> step stepped to DOCT2\main\%LINE 654+8 654: x = atoi(argv[1]); DBG> step stepped to DOCT2\main\%LINE 655+12 655: printf("%d\n", x); DBG> step 6 stepped to DOCT2\main\%LINE 661+16 661: printf("y > 2"); DBG> step y > 2 stepped to DOCT2\main\%LINE 671+16 671: printf("not z"); DBG> step not z stepped to DOCT2\main\%LINE 674+16 674: printf("\n"); DBG> step stepped to DOCT2\main\%LINE 675+24 675: } DBG> step stepped to DOCT2\__main+104 DBG> step 'Normal successful completion' DBG>
Notice that the semantic stepping behavior is much smoother and more straightforward than the stepping-by-line example. Further, semantic stepping results in stopping at significant points of the program. In general, semantic stepping significantly reduces or eliminates the confusion of "bouncing" around the code non sequentially, which characteristically happens with stepping by line through optimized code. Although some reordering of the source program may be done to take advantage of better execution characteristics, generally the flow is from top to bottom.
The granularity of stepping is different between stepping by line and stepping semantically. Sometimes it is greater, sometimes smaller. For example, a statement that would by its semantic nature constitute a semantic event will not show up with semantic stepping if it has been optimized away. Thus, the semantic region will span across several lines, skipping the line that has been optimized away.
14.1.4. Use of Registers
A compiler might determine that the value of an expression does not change between two given occurrences and might save the value in a register. In such cases, the compiler does not recompute the value for the next occurrence, but assumes the value saved in the register is valid.
If, while debugging a program, you use the DEPOSIT command to
change the value of the variable in the expression, the corresponding value stored
in the register might not be changed. Thus, when execution continues, the value in
the register might be used instead of the changed value in the expression, which
will cause unexpected results.
In addition, when the value of a non static variable (see Section 3.4.3, ''Watching Nonstatic Variables'') is held in a register, its value in memory is
generally invalid; therefore, a spurious value might be displayed if you enter the
EXAMINE command for a variable under these
circumstances.
14.1.5. Split-Lifetime Variables
In compiling with optimization, the compiler sometimes performs split-lifetime analysis on a variable, "splitting"it into several independent subvariables that can be independently allocated. The effect is that the original variable can be thought to reside in different locations at different points in time - sometimes in a register, sometimes in memory, and sometimes nowhere. It is even possible for the different subvariables to be simultaneously active.
On Alpha systems, in response to the EXAMINE command, the debugger tells
you at which locations in the program the variable was defined. When the variable
has an inappropriate value, this location information can help you determine where
the value of the variable was assigned. (The /DEFINITIONS
qualifier enables you to specify more or fewer than the default five
locations.)
Split-lifetime analysis applies only to scalar variables and parameters. It does not apply to arrays, records, structures, or other aggregates.
Examples of Split-Lifetime Processing
385 doct8 () {
386
387 int i, j, k;
388
389 i = 1;
390 j = 2;
391 k = 3;
392
393 if (foo(i)) {
394 j = 17;
395 }
396 else {
397 k = 18;
398 }
399
400 printf("%d, %d, %d\n", i, j, k);
401
402 }$ run doct8
⋮
DBG> step/into
stepped to DOCT8\doct8\%LINE 391
391: k = 3;
DBG> examine i
%W, entity 'i' was not allocated in memory (was optimized away)
DBG> examine j
%W, entity 'j' does not have a value at the current PC
DBG> examine k
%W, entity 'k' does not have a value at the current PCNote the difference in the message for the variable i compared to j or k. The variable i was not allocated in memory (registers, core, or otherwise) at all, so there is no point in ever trying to examine its value again. By contrast, j and k do not have a value "at the current PC" here; somewhere later in the program they will.
DBG> step
stepped to DOCT8\doct8\%LINE 385
385: doct8 () { DBG> step 5
stepped to DOCT8\doct8\%LINE 391
391: k = 3;
DBG> examine k
%W, entity 'k' does not have a value at the current PC
DBG> step
stepped to DOCT8\doct8\%LINE 393
393: if (foo(i)) {
DBG> examine j
%W, entity 'j' does not have a value at the current PC
DBG> examine k
DOCT8\doct8\k: 3
value defined at DOCT8\doct8\%LINE 391Here j is still undefined, but k now has a value, namely 3. That value was assigned at line 391.
DBG> step
stepped to DOCT8\doct8\%LINE 390
390: j = 2; DBG> examine j
%W, entity 'j' does not have a value at the current PC
DBG> step stepped to DOCT8\doct8\%LINE 393
393: if (foo(i)) {
DBG> examine j
DOCT8\doct8\j: 2
value defined at DOCT8\doct8\%LINE 390 DBG> set break %line 400
DBG> g break at DOCT8\doct8\%LINE 400
400: printf("%d, %d, %d\n", i, j, k);
DBG> examine j DOCT8\doct8\j: 2
value defined at DOCT8\doct8\%LINE 390
value defined at DOCT8\doct8\%LINE 394Here there is more than one definition location given for j. Which applies depends on which path was taken in the IF clause. If a variable has an apparently inappropriate value, this mechanism provides a means to take a closer look at those places, and only those, where that value might have come from.
SHOW SYMBOL/ADDRESS command to display the
split-lifetime information for a symbol, as in the following example:
DBG> show symbol/address j
data DOCT8\doct8\j
between PC 131128 and 131140
PC definition locations are at: 131124
address: %R3
between PC 131144 and 131148
PC definition locations are at: 131140
address: %R3
between PC 131152 and 131156
PC definition locations are at: 131124
address: %R3
between PC 131160 and 131208
PC definition locations are at: 131124, 131140
address: %R3The first segment starts at the assignment of 2 to j and extends through the test to just before the assignment of 17 to j.
The second segment starts at the assignment of 17 to j and extends up to the ELSE part of the IF statement.
The third segment corresponds to the ELSE clause. There is no assignment to j in this range of PCs. Note that the definition of j that applies here is from the first segment.
The fourth segment starts at the join point following the IF clause and extends to the end of the program. The definition of j comes from either line 390 or line 394 depending on which path was taken through the IF statement.
On Alpha systems, the debugger tracks and reports which assignments and definitions might have provided the displayed value of a variable. This additional information can help you cope with some of the effects of code motion and other optimizations - effects that cause a variable to have a value coming from an unexpected place in the program.
EXAMINE/DEFINITIONS Command (Alpha Only)
For a split-lifetime variable, the EXAMINE command not only
displays the value of the active lifetime, it also displays the lifetime's
definition points. The definition points are places where the lifetime could have
received an initial value (if there is only one definition point, then that is the
only place.)
DBG> examine j
DOCT8\doct8\j: 2
value defined at DOCT8\doct8\%LINE 390
value defined at DOCT8\doct8\%LINE 394Here, the lifetime of j has two definition points, because the value could have come from either line 390 or line 394, depending on whether or not the expression at line 393 was TRUE.
/DEFINITIONS= n qualifier, as
in the following
example:DBG> EXAMINE/DEFINITIONS=74 FOO
Note that the minimum abbreviation is /DEFI.
DBG> DEFINE/COMMAND E = "EXAMINE/DEFINITIONS=100"
/DEFINITIONS qualifier is set to 100, and the
split-lifetime variable examined has 120 definition points, the debugger displays
the 100 as specified, and then
reports:there are 20 more definition points
14.2. Debugging Screen-Oriented Programs
The debugger uses the terminal screen for input and output (I/O) during a debugging session. If you use a single terminal to debug a screen-oriented program that uses most or all of the screen, debugger I/O can overwrite, or can be overwritten by, program I/O.
Using one terminal for both program I/O and debugger I/O is even more complicated if you are debugging in screen mode and your screen-oriented program calls any Run-Time Library (RTL) Screen Management (SMG$) routines. This is because the debugger's screen mode also calls SMG routines. In such cases, the debugger and your program share the same SMG pasteboard, which causes further interference.
If you are at a workstation running VWS, start your debugging session and then enter the debugger command
SET MODE SEPARATE. It creates a separate terminal-emulator window for debugger I/O. Program I/O continues to be displayed in the window from which you started the debugger.- If you are at a workstation running HPE DECwindows Motif:
To display the debugger's DECwindows Motif interface on a separate workstation (also running DECwindows Motif), see Section 9.8.3.1, ''Displaying the Debugger's VSI DECwindows Motif for OpenVMS User Interface on Another Workstation''.
To use the debugger's command interface rather than the DECwindows Motif interface, see Section 9.8.3.3, ''Displaying the Command Interface and Program Input/Output in Separate DECterm Windows''. It explains how to create a separate DECterm window for debugger I/O. The effect is similar to using the command
SET MODE SEPARATEon a workstation running VWS.
If you do not have a workstation, use two terminals - one for program I/O and another for debugger I/O. This technique is described in the rest of this section.
Assume that TTD1: is your current terminal from which you plan to start the debugger. You want to display debugger I/O on terminal TTD2: so that TTD1: is devoted exclusively to program I/O.
Provide the necessary protection to TTD2: so that you can allocate that terminal from TTD1: (see Section 14.2.1, ''Setting the Protection to Allocate a Terminal'').
The remaining steps are all performed from TTD1:.
- Assign the debugger logical names
DBG$INPUTandDBG$OUTPUTto TTD2:as follows:$ DEFINE DBG$INPUT TTD2: $ DEFINE DBG$OUTPUT TTD2:
DBG$INPUTandDBG$OUTPUTspecify the debugger input device and output device, respectively. By default, these logical names are equated toSYS$INPUTandSYS$OUTPUT, respectively. AssigningDBG$INPUTandDBG$OUTPUTto TTD2: enables you to display debugger commands and debugger output on TTD2:. - Make sure that the terminal type is known to the system. Enter the following command:
$ SHOW DEVICE/FULL TTD2:
If the device type is unknown, your system manager (or a user with LOG_IO or PHY_IO privilege) must make it known to the system as shown in the following example. In the example, the terminal is assumed to be a VT200:$ SET TERMINAL/PERMANENT/DEVICE=VT200 TTD2:
- Run the program to be debugged:
$ DEBUG/KEEP ⋮ DBG> RUN prog-name
You can now observe debugger I/O on TTD2:.
- When finished with the debugging session, deallocate TTD2: as follows (or log out):
$ DEALLOCATE TTD2:
14.2.1. Setting the Protection to Allocate a Terminal
On a properly secured system, terminals are protected so that you cannot allocate a terminal from another terminal.
To set the necessary protection, your system manager (or a user with the privileges indicated) should follow the steps shown in the following example.
If both TTD1: and TTD2: are hardwired to the system, go to Step 4.
If TTD1: and TTD2: are connected to the system over a LAT (local area transport), go to Step 2.
Log in to TTD2:.
- Enter these commands (you need LOG_IO or PHY_IO privilege):
$ SET PROCESS/PRIV=LOG_IO $ SET TERMINAL/NOHANG/PERMANENT $ LOGOUT/NOHANG
- Enter one of the following commands (you need OPER privilege):
$ SET ACL/OBJECT_TYPE=DEVICE/ACL=(IDENT=[PROJ, JONES], ACCESS=READ+WRITE) TTD2:
$ SET PROTECTION=WORLD:RW/DEVICE TTD2: The
SET ACLcommand line is preferred because it uses an access control list (ACL). In the example, access is restricted to user identification code (UIC) [PROJ, JONES]. The SET PROTECTION command line provides world read/write access, which allows any user to allocate and perform I/O to TTD2:.
14.3. Debugging Multilanguage Programs
The debugger enables you to debug modules whose source code is written indifferent languages within the same debugging session. This section highlights some language-specific behavior that you should be aware of to minimize possible confusion.
The debugger's online help (type HELP Language)
The documentation supplied with that language
14.3.1. Controlling the Current Debugger Language
$ DEBUG/KEEP
Debugger Banner and Version Number
DBG> RUN prog-name
Language: PASCAL, Module: FORMS
DBG>The current language setting determines how the debugger parses and interprets the names, operators, and expressions you specify in debugger commands, including things like the typing of variables, array and record syntax, the default radix for integer data, case sensitivity, and so on. The language setting also determines how the debugger displays data associated with your program.
Many programs include modules that are written in languages other than that of the main program. To minimize confusion, by default the debugger language remains set to the language of the main program throughout a debugging session, even if execution is paused within a module written in another language.
SET LANGUAGE command to set the debugging context to that of
another language. For example, the following command causes the debugger to
interpret any symbols, expressions, and so on according to the rules of the COBOL
language:DBG> SET LANGUAGE COBOL
In addition, when debugging a program that is written in an unsupported language,
you can specify the SET LANGUAGE UNKNOWN command. To maximize the
usability of the debugger with unsupported languages, the SET LANGUAGE
UNKNOWN command causes the debugger to accept a large set of data
formats and operators, including some that might be specific to only a few supported
languages. The operators and constructs that are recognized when the language is set
to UNKNOWN are identified in the debugger's online help (type HELP
Language).
14.3.2. Specific Differences Among Languages
This section lists some of the differences you should keep in mind when debugging
in various languages. Included are differences that are affected by the SET
LANGUAGE command and other differences (for example, language-specific
initialization code and predefined breakpoints).
This section is not intended to be complete. Seethe debugger's online help (type HELP Language) and your language documentation for complete details.
14.3.2.1. Default Radix
The default radix for entering and displaying integer data is decimalfor most languages.
On Alpha systems, the exceptions are BLISS, MACRO--32, and MACRO--64, which have a hexadecimal default radix.
Use the SET RADIX command to establish a new default
radix.
14.3.2.2. Evaluating Language Expressions
The
EVALUATE,DEPOSIT,IF,FOR,REPEAT, andWHILEcommandsWHENclauses, which are used with theSET BREAK,SET TRACE, andSET WATCHcommands
When processing these commands, the debugger evaluates language expressions in the syntax of the current language and in the current radix as discussed in Section 4.1.6, ''Evaluating Language Expressions''. At each execution (not when you enter the command), the debugger checks the syntax of any expressions in WHEN or DO clauses, and then evaluates them.
DBG> SET WATCH X WHEN (Y < 5) ! Pascal DBG> SET WATCH X WHEN (Y .LT. 5) ! FORTRAN
Assume that the language is set to Pascal and you have entered the first (Pascal) command. You now step into a Fortran routine, set the language to Fortran, and resume execution. While the language is set to Fortran, the debugger is not able to evaluate the expression (Y < 5). As a result, it sets an unconditional watchpoint and, when the watchpoint is triggered, returns a syntax error for the < operator.
This type of discrepancy can also occur if you use commands that evaluate language expressions in debugger command procedures and initialization files.
When the language is set to BLISS, the debugger processes language expressions that contain variable names (or other address expressions) differently than when it is set to another language. See Section 4.1.6, ''Evaluating Language Expressions'' for details.
14.3.2.3. Arrays and Records
The syntax for denoting array elements and record components (if applicable) varies among languages.
For example, some languages use brackets ([]), and others use parentheses
(( )), to delimit array elements.
DBG> EXAMINE INTEGER_ARRAY PROG2\INTEGER_ARRA Y (1, 1): 27 (1, 2): 31 (1, 3): 12 (2, 1): 15 (2, 2): 22 (2, 3): 18 DBG>
For some languages (like Pascal and Ada) the specific array declaration determines how the array is based.
14.3.2.4. Case Sensitivity
DBG> SET BREAK SCREEN_IO\%LINE 10 DBG> SET BREAK screen_io\%LINE 10
14.3.2.5. Initialization Code
NOTATMAIN message when a program is
brought under debugger control. For
example:$ DEBUG/KEEP
Debugger Banner and Version Number
DBG> RUN prog-name
Language: ADA, Module: MONITOR
Type GO to reach main program
DBG>The NOTATMAIN message indicates that execution is paused
before the beginning of the main program. This enables you to execute and check
some initialization code under debugger control.
The initialization code is created by the compiler and is placed in a special
PSECT named LIB$INITIALIZE. For example, in the case of an
Ada package, the initialization code belongs to the package body (which might
contain statements to initialize variables, and so on). In the case of a Fortran
program, the initialization code declares the handler that is needed if you
specify the /CHECK=UNDERFLOW or /CHECK=ALL
qualifier.
The NOTATMAIN message indicates that, if you do not want to
debug the initialization code, you can execute immediately to the beginning of
the main program by entering a GO command. You are then at
the same point as when you start debugging any other program. Entering the
GO command again starts program execution.
14.3.2.6. Predefined Breakpoints
If your program is a tasking program, two breakpoints that are associated with
tasking exception events are automatically established when the program is
brought under debugger control. These breakpoints are not affected by a
SET LANGUAGE command. They are established automatically
during debugger initialization when appropriate run-time libraries are
present.
SHOW
BREAK command. For
example:DBG> SHOW BREAK Predefined breakpoint on ADA event "EXCEPTION_TERMINATED" for any value Predefined breakpoint on ADA event "DEPENDENTS_EXCEPTION" for any value DBG>
14.4. Recovering from Stack Corruption
The debugger allocates a certain amount of memory at startup and shares the stack with the user's program. If a user process exception results in exhaustion of resources or corruption of the stack, the debugger may be incapable of regaining control, and the debug session may terminate.
Be aware of this potential behavior after the occurrence of stack corruption messages or warnings about continuing from a severe error. In either case, the integrity of the debug session cannot be guaranteed.
Change your source code, temporarily or permanently, to reduce resource consumption or lessen the use of stack space
Increase quotas
Specify a larger stack size when linking your program
14.5. Debugging Exceptions and Condition Handlers
A condition handler is a procedure that the operating system executes when an exception occurs.
Exceptions include hardware conditions (such as an arithmetic overflow or a memory access violation) or signaled software exceptions (for example, an exception signaled because a file could not be found).
Operating system conventions specify how, and in what order, various condition handlers established by the operating system, the debugger, or your own program are invoked - for example, the primary handler, call frame (application-declared) handlers, and so on. Section 14.5.3, ''Effect of the Debugger on Condition Handling''describes condition handling when you are using the debugger. See the VMS Run-Time Library Routines Volume for additional general information about condition handling.
The
SET BREAK/EXCEPTIONandSET TRACE/EXCEPTIONcommands, which direct the debugger to treat any exception generated by your program as a breakpoint or tracepoint, respectively (see Section 14.5.1, ''Setting Breakpoints or Tracepoints on Exceptions'' and Section 14.5.2, ''Resuming Execution at an Exception Breakpoint'').Several built-in symbols (such as %EXC_NAME), which enable you to qualify exception breakpoints and tracepoints (see Section 14.5.4, ''Exception-Related Built-In Symbols'').
The
SET BREAK/EVENTandSET TRACE/EVENTcommands, which enable you to break on or trace exception events that are specific to Ada, SCAN, or multithread programs (see the corresponding documentation for more information).
14.5.1. Setting Breakpoints or Tracepoints on Exceptions
SET BREAK/EXCEPTION or SET
TRACE/EXCEPTION command, you direct the debugger to treat any
exception generated by your program as a breakpoint or tracepoint. As a result of a
SET BREAK/EXCEPTION command, if your program generates an
exception, the debugger suspends execution, reports the exception and the line where
execution is paused, and prompts for commands. The following example shows the
effect:DBG> SET BREAK/EXCEPTION
DBG> GO
⋮
%SYSTEM-F-INTDIV, arithmetic trap, integer divide by zero at PC=0000066C, PSL=03C00022
break on exception preceding TEST\%LINE 13
6: X := 3/Y;
DBG>Note that an exception breakpoint (or tracepoint) is triggered even if your
program has a condition handler to handle the exception. The SET
BREAK/EXCEPTION command causes a breakpoint to occur before any
handler can execute (and possibly dismiss the exception). Without the exception
breakpoint, the handler will be executed, and the debugger would get control only if
no handler dismissed the exception (see Section 14.5.2, ''Resuming Execution at an Exception Breakpoint'' and
Section 14.5.3, ''Effect of the Debugger on Condition Handling'').
DBG> SET BREAK/EXCEPTION DO (SET MODULE/CALLS; SHOW CALLS)
DO display that issues a
SHOW CALLS command whenever the debugger interrupts
execution. For example:
DBG> DISPLAY CALLS DO (SET MODULE/CALLS; SHOW CALLS)
An exception tracepoint (established with the SET
TRACE/EXCEPTION command) is like an exception breakpoint followed by a
GO command without an address expression specified.
An exception breakpoint cancels an exception tracepoint, and vice versa.
To cancel exception breakpoints or tracepoints, use the CANCEL
BREAK/EXCEPTION or CANCEL TRACE/EXCEPTION command,
respectively.
14.5.2. Resuming Execution at an Exception Breakpoint
GO, STEP, or
CALL commands, the behavior is as follows: Entering a
GOcommand without anaddress-expressionparameter, or entering aSTEPcommand, causes the debugger to resignal the exception. TheGOcommand enables you to observe which application-declared handler, if any, next handles the exception. TheSTEPcommand causes you to step into that handler (see the next example).Entering a
GOcommand with an address-expression parameter causes execution to resume at the specified location, which inhibits the execution of any application-declared handlers.A common debugging technique at an exception breakpoint is to call a dump routine with the
CALLcommand (see Chapter 13, "Additional Convenience Features"). When you enter theCALLcommand at an exception breakpoint, no breakpoints, tracepoints, or watchpoints that were previously set within the called routine are active, so that the debugger does not lose the exception context. After the routine has executed, the debugger prompts for input. Entering aGOorSTEPcommand at this point causes the debugger to resignal the exception.
The following Fortran example shows how to determine the presence of a condition
handler at an exception breakpoint and how a STEP command,
entered at the breakpoint, enables you to step into the handler.
SHOW CALLS command indicates
that the exception was generated during a call to routine SYS$QIOW:
DBG> SET BREAK/EXCEPTION
DBG> GO
⋮
%SYSTEM-F-SSFAIL, system service failure exception, status=0000013C, PC=7FFEDE06, PSL=03C00000
break on exception preceding SYS$QIOW+6
DBG> SHOW CALLS
module name routine name line rel PC abs PC
SYS$QIOW 00000006 7FFEDE06
*EXC$MAIN EXC$MAIN 23 0000003B 0000063B
DBG>SHOW STACK command indicates that no
handler is declared in routine SYS$QIOW. However, one level down the call stack,
routine EXC$MAIN has declared a handler named SSHAND:
DBG> SHOW STACK
stack frame 0 (2146296644)
condition handler: 0
SPA: 0
S: 0
mask: ^M<R2, R3, R4, R5, R6, R7, R8, R9, R10, R11>
PSW: 0020 (hexadecimal)
saved AP: 2146296780
saved FP: 2146296704
saved PC: EXC$MAIN\%LINE 25
⋮
stack frame 1 (2146296704)
condition handler: SSHAND
SPA: 0
S: 0
mask: ^M<R11>
PSW: 0000 (hexadecimal)
saved AP: 2146296780
saved FP: 2146296760
saved PC: SHARE$DEBUG+2217
⋮STEP command enables
you to step directly into condition handler SSHAND:
DBG> STEP
stepped to routine SSHAND
2: INTEGER*4 FUNCTION SSHAND (SIGARGS, MECHARGS)
DBG> SHOW CALLS
module name routine name line rel PC abs PC
*SSHAND SSHAND 2 00000002 00000642
----- above condition handler called with exception 0000045C:
%SYSTEM-F-SSFAIL, system service failure exception, status=0000013C, PC=7FFEDE06, PSL=03C00000
----- end of exception message
SYS$QIOW 00000006 7FFEDE06
*EXC$MAIN EXC$MAIN 23 0000003B 0000063B
DBG>The debugger symbolizes the addresses of condition handlers into names if that is possible. However, note that with some languages, exceptions are first handled by a Run-Time Library (RTL) routine, before any application-declared condition handler is invoked. In such cases, the address of the first condition handler might be symbolized to an offset from an RTL shareable image address.
14.5.3. Effect of the Debugger on Condition Handling
Primary handler
Secondary handler
Call-frame handlers (application-declared) - also known as stack handlers
Final handler
Last-chance handler
Catchall handler
SS$_RESIGNAL - The operating system searches for the next handler.
SS$_CONTINUE - The condition is assumed to be corrected and execution continues.
SS$_UNWIND - The call stack is unwound some number of frames, if necessary, and the signal is dismissed.
For more information about condition handling, see the OpenVMS Programming Concepts Manual.
14.5.3.1. Primary Handler
When you run your program with the debugger, the primary handler is the debugger. Therefore, the debugger has the first opportunity to handle an exception, whether or not the exception is caused by the debugger.
If you enter a SET BREAK/EXCEPTION or SET
TRACE/EXCEPTION command, the debugger breaks on (or traces) any
exceptions caused by your program. The break (or trace) action occurs before any
application-declared handler is invoked.
If you do not enter a SET BREAK/EXCEPTION or SET
TRACE/EXCEPTION command, the primary handler resignals any
exceptions caused by your program.
14.5.3.2. Secondary Handler
The secondary handler is used for special purposes and does not apply to the types of programs covered in this manual.
14.5.3.3. Call-Frame Handlers (Application-Declared)
Each routine of your program can establish a condition handler, also known as a call-frame handler. The operating system searches for these handlers starting with the routine that is currently executing. If no handler was established for that routine, the system searches for a handler established by the next routine down the call stack, and so on back to the main program, if necessary.
It handles the exception, which allows the program to continue execution.
It resignals the exception. The operating system then searches for another handler down the call stack.
It encounters a breakpoint or watchpoint, which suspends execution at the breakpoint or watchpoint.
It generates its own exception. In this case, the primary handler is invoked again.
It exits, which terminates program execution.
14.5.3.4. Final and Last-Chance Handlers
These handlers are controlled by the debugger. They enable the debugger to
regain control and display the DBG > prompt if no
application-declared handler has handled an exception. Otherwise, the debugging
session will terminate and control will pass to the DCL command
interpreter.
DBG> SET BREAK/EXCEPTION
DBG> GO
⋮
%SYSTEM-F-INTDIV, arithmetic trap, integer divide by zero at PC=0000066C, PSL=03C00022
break on exception preceding TEST\%LINE 13
6: X := 3/Y;
DBG> GO
%SYSTEM-F-INTDIV, arithmetic trap, integer divide by zero at PC=0000066C, PSL=03C00022
DBG>In this example, the first INTDIV message is issued by the primary handler,
and the second is issued by the final handler, which then displays the
DBG > prompt.
DBG> DEPOSIT %FP = 10 DBG> GO ⋮ %SYSTEM-F-ACCVIO, access violation, reason mask=00, virtual address=0000000A, PC=0000319C, PSL=03C00000 %DEBUG-E-LASTCHANCE, stack exception handlers lost, re-initializing stack DBG>
The catchall handler, which is part of the operating system, is invoked if the last-chance handler cannot gain control. The catchall handler produces a register dump. This should never occur if the debugger has control of your program, but it can occur if your program encounters an error when running without the debugger.
If, during a debugging session, you observe a register dump and are returned to DCL level ($), contact your VSI support representative.
14.5.4. Exception-Related Built-In Symbols
|
Symbol |
Description |
|---|---|
|
%EXC_FACILITY |
Name of facility that issued the current exception |
|
%EXC_NAME |
Name of current exception |
|
%ADAEXC_NAME |
Ada exception name of current exception (for Ada programs only) |
|
%EXC_NUMBER |
Number of current exception |
|
%EXC_SEVERITY |
Severity code of current exception |
To obtain information about the fields of the condition code of the current exception.
To qualify exception breakpoints or tracepoints so that they trigger only on certain kinds of exceptions.
DBG> EVALUATE %EXC_NAME 'ACCVIO' DBG> SET TRACE/EXCEPTION WHEN (%EXC_NAME = "ACCVIO") DBG> EVALUATE %EXC_FACILITY 'SYSTEM' DBG> EVALUATE %EXC_NUMBER 12 DBG> EVALUATE/CONDITION_VALUE %EXC_NUMBER %SYSTEM-F-ACCVIO, access violation, reason mask=01, virtual address=FFFFFF30, PC=00007552, PSL=03C00000 DBG> SET BREAK/EXCEPTION WHEN (%EXC_NUMBER = 12) DBG> SET BREAK/EXCEPTION WHEN (%EXC_SEVERITY .NE. "I" .AND. %EXC_SEVERITY .NE. "S")
14.6. Debugging Exit Handlers
Exit handlers are procedures that are called whenever an image requests the $EXIT system service or runs to completion. A user program can declare one or more exit handlers. The debugger always declares its own exit handler.
At program termination, the debugger exit handler executes after all application-declared exit handlers have executed.
Set a breakpoint in that exit handler.
- Cause the exit handler to execute by using one of the following techniques:
When the exit handler executes, the breakpoint is activated and control is then returned to the debugger, which prompts for commands.
SHOW EXIT_HANDLERS command gives a display of the exit handlers that
your program has declared. The exit handler routines are displayed in the order that
they are called. A routine name is displayed symbolically, if possible. Otherwise, its
address is displayed. The debugger's exit handlers are not displayed. For example:
DBG> SHOW EXIT_HANDLERS exit handler at STACKS\CLEANUP exit handler at BLIHANDLER\HANDLER1 DBG>
14.7. Debugging AST-Driven Programs
A program can use asynchronous system traps (ASTs) either explicitly or implicitly by calling system services or Run-Time Library (RTL) routines that call application-defined AST routines. Section 14.7.1, ''Disabling and Enabling the Delivery of ASTs'' explains how to facilitate debugging by disabling and enabling the delivery of ASTs originating with your program.
14.7.1. Disabling and Enabling the Delivery of ASTs
Debugging AST-driven programs can be confusing because interrupts originating from the program being debugged can occur, but are not processed, while the debugger is running (processing commands, tracing execution, displaying information, and so on).
By default, the delivery of ASTs is enabled while the program is running. The
DISABLE AST command disables the delivery of ASTs while the
program is running and causes any such potential interrupts to be queued.
The delivery of ASTs is always disabled when the debugger is running.
If a static watchpoint is in effect, the debugger deactivates the static
watchpoint, ASTs, and thread switching, just before a system service call. The
debugger reactivates them just after the system service call completes. (For more
information, see the SET WATCH command description.)
The ENABLE AST command reenables the delivery of ASTs,
including any pending ASTs. The SHOW AST command indicates
whether the delivery of ASTs is enabled or disabled.
To control the delivery of ASTs during the execution of a routine called
with the CALL command, use the /[NO]AST
qualifiers. The command CALL/AST enables the delivery of ASTs in
the called routine. The command CALL/NOAST disables the delivery
of ASTs in the called routine. If you do not specify /AST or
/NOAST with the CALL command, the delivery of ASTs is enabled
unless you have previously entered the DISABLE AST
command.
14.8. Debugging Translated Images (Alpha and Integrity servers Only)
On OpenVMS Alpha and Integrity server systems, the debugger does not support attempts to debug translated images. If you must debug a translated image, use the Delta/XDelta Debugger. For more information on this debugger, see the VSI OpenVMS Delta/XDelta Debugger Manual.
14.9. Debugging Programs That Perform Synchronization or Communication Functions
Some programs that perform synchronization or communication can pose problems for debugging. For example, an application being debugged includes the LCK$M_DEQALL modifier in a $DEQ system service call (this modifier breaks communication links between the portion of the debugger in the user process (the kernel) and the debugger main process).
14.10. Debugging Inlined Routines
%DEBUG-E-ACCESSR, no read access to address 00000000
To work around this problem, compile your program with the /NOOPTIMIZE
qualifier.
Chapter 15. Debugging Multiprocess Programs
This chapter describes features of the debugger that are specific to multiprocess programs (programs that run in more than one process). With these features, you can display process information and control the execution of specific processes. You can use these features in addition to those explained in other chapters.
Images discussed in this chapter are debuggable images - that is, images that can be
controlled by debugger. An image that is linked with the /NOTRACEBACK
qualifier cannot be brought under control of the debugger. As explained in Section 1.2, ''Preparing an Executable Image for Debugging'', you get full symbolic information when debugging an image only
for modules that are compiled and linked with the /DEBUG
qualifier.
15.1. Basic Multiprocess Debugging Techniques
This section introduces basic concepts of multiprocess debugging. Refer to subsequent sections for complete details.
15.1.1. Starting a Multiprocess Debugging Session
This section explains the easiest way to start a multiprocess debugging session. Section 15.16.4, ''Interrupting the Execution of an Image to Connect It to the Debugger'' describes additional ways to start the debugger.
$ debug/keep
OpenVMS Integrity server Debug64
Version T8.2-008
DBG>DBG> SHOW PROCESS
Number Name State Current PC
* 1 DBGK$$2727282C activated SERVER\__main
DBG> RUN/NEW CLIENT
process 2
%DEBUG-I-INITIAL, Language: C, Module: CLIENT
%DEBUG-I-NOTATMAIN, Type GO to reach MAIN program
predefined trace on activation at CLIENT\__main
all> SHOW PROCESS
Number Name State Current PC
* 1 DBGK$$2727282C activated SERVER\__main
2 USER_2 activated CLIENT\__mainall>The RUN/NEW CLIENT command in Example 15.1, ''RUN/NEW Command'' starts the program
CLIENT in a new process. The first time (in a debugging
session) that the debugger has more than one process under its control, it changes
its prompt to all> to identify the set of all processes under its
control.
Processes and Process Sets
Once the debugger is aware of more than one process, the debugger prompt changes to the identifier of the current process set, followed by a right angle bracket (>).
Conceptually, each process belongs to a set of one, identified by default by the unique decimal number assigned to it when the debugger takes control of the process. A process can belong to more than one set. All processes under debugger control are grouped by default into a set named all.
You can group processes into user-named sets with the DEFINE /PROCESS_SET
command.
Current Process Set
Debugger commands apply by default to the current process set. By
default, the current process set is the set named all. You can change the current
process set with the SET PROCESS command.
Command Process Set
The set of processes at which a command is directed is called the command process set. The default command process set is the current process set.
Process Set Prefix
all> 1,2,5> GO
1,2,5> is a process set prefix. This syntax allows
you to cut and paste commands from a previous command line.
Visible Process
SHOW
PROCESS display. You can change the visible process with the
SET PROCESS/VISIBLE command. For
example:all> SHOW PROCESS
Number Name State Current PC
* 1 DBGK$$2727282C activated SERVER\__main
2 USER_2 activated CLIENT\__main
all>In the above example, process number 1 is the visible process.
15.2. Obtaining Information About Processes
SHOW PROCESS command to obtain information about processes that are
currently under control of your debugging session. By default, SHOW
PROCESS displays information about all processes under control of the
debugger. (These are the processes in process set all.) Example 15.2, ''SHOW PROCESS Command''
shows the type of information displayed immediately after you start the debugger.DBG> SHOW PROCESS/BRIEF/ALL
Number Name State Current PC
* 1 JONES activated MAIN_PROG\%LINE 2
DBG>/BRIEF and /ALL are the
default. Note also that the debugger displays its default prompt, because the debugger
still has only one process under its control. The SHOW PROCESS
command provides the following information about each process specified: The process number assigned by the debugger. In Example 15.2, ''SHOW PROCESS Command'', the process number is 1 because this is the first process known to the debugger. The asterisk in the leftmost column (*) marks the visible process.
The process name. In this case, the process name is JONES.
The current debugging state for that process. A process is in the activated state when it is first brought under debugger control (that is, before it has executed any part of the program under debugger control). Table 15.1, ''Debugging States'' summarizes the possible debugging states of a process under debugger control.
The location (symbolized, if possible) where execution of the image is paused in that process. In Example 15.2, ''SHOW PROCESS Command'', the image has not yet started execution.
|
State |
Description | |
|---|---|---|
|
Running |
Executing under control of the debugger. | |
|
Stopped | ||
|
Activated |
The image and its process have just been brought under debugger control. | |
|
Break ? |
A breakpoint was triggered. | |
|
Interrupted |
Execution was interrupted in that process, in one of the
following ways:
| |
|
Step ? |
A | |
|
Trace ? |
A tracepoint was triggered. | |
|
Unhandled exception |
An unhandled exception was encountered. | |
|
Watch of |
A watchpoint was triggered. | |
|
Terminated |
The image has terminated execution but the process is still under debugger control. Therefore, you can obtain information about the image and its process. | |
STEP command
followed by a SHOW PROCESS command, the state column in the
SHOW PROCESS display indicates that execution is paused at the
completion of a step. For
example:DBG>STEPDBG>SHOW PROCESSNumber Name State Current PC * 1 JONES step MAIN_PROG\%LINE 3 DBG>
Similarly, if you were to set a breakpoint and then enter a GO command, a
SHOW PROCESS command entered once the breakpoint has triggered
identifies the state as break.
15.3. Process Specification
Each new process to which the debugger connects is identified by a process-number. The first process is process-number 1, the second process is process-number 2, and so on. When a process stops, its process number is recycled and is available to the debugger for assignment to a subsequent process.
Processes are referred to using the process-spec.The most simple process-spec is either a process-name created by OpenVMS when the process is created, or a process-number created by the debugger when the debugger gains control of the process. A process-spec that consists of only numbers is interpreted as a process number. Within debugger commands, you can use process-numbers to specify individual processes (for example, "2, 3, 4, 5").
A process-spec-item can be a name, in which case it can refer to a process-name or a process-set-name. The debugger tries first to find a process-set with that name. If unsuccessful, the debugger then tries to match a process to the name. You can explicitly specify the process-name by using the %PROCESS_NAME lexical function.
process-spec ::= process-spec-item [, process-spec-item]
process-spec-item ::= named-item |
numbered-item |
pid-item |
process-set-name |
special-item
named-item ::= [%PROCESS_NAME] wildcard-name
numbered-item ::= numbered-process
numbered-process ::= [%PROCESS_NUMBER] decimal-number
pid-item ::= %PROCESS_ID VMS-process-identifier
process-set-name ::= name
special-item ::= %NEXT_PROCESS |
%PREVIOUS_PROCESS |
%VISIBLE_PROCESS15.4. Process Sets
DEFINE PROCESS_SET command followed by a list of processes
separated by commas (,). For
example:all> DEFINE/PROCESS CLIENTS = 2,3
all> SET PROCESS CLIENTS
clients> STEP
process 2,3
stepped to CLIENT\main\%LINE 18796
18796: status = sys$crembx (0, &mbxchan, 0, 0, 0,
0, &mbxname_dsc, CMB$M_READONLY, 0);
clients> SHOW PROCESS CLIENTS
Number Name State Current PC
2 USER1_2 step CLIENT\main\%LINE 18796
3 USER1_3 step CLIENT\main\%LINE 18796
clients>There is a predefined process set named all, which is the default process set when the debugger is first invoked. You cannot redefine this process set.
Current Process Set
At any time during a debugging session, there is a current process set in effect. The current process set is the group of processes to which debugger process-sensitive commands apply by default. See Section 15.6, ''Process-Sensitive Commands'' for a list of debugger commands that are process-sensitive.
By default, the current process set is the set of all processes, with the process set name
all. You can change the current process set with the SET PROCESS
command.
SET PROCESS command does three things:It specifies the current process set.
It controls the visible process with the
/VISIBLEqualifier.It turns dynamic process setting on or off with the
/[NO]DYNAMICqualifier.
SET PROCESS command takes a single
parameter, a process-spec, which specifies the current process set. For
example:all> SET PROCESS 1 1> STEP process 1 stepped to SERVER\main\%LINE 18800 18800: if (!(status & 1)) 1> SET PROCESS ALL all>
SET PROCESS/DYNAMIC command directs the debugger to change the visible
process when a debugger event occurs, such as the completion of a
STEP command, or the triggering of a breakpoint. The visible
process becomes the process that triggered the event. For
example:all> SET PROCESS/DYNAMIC all> 1> STEP process 1 stepped to SERVER\main\%LINE 18808 18808: df_p = fopen (datafile, "r+"); all> SHOW PROCESS/VISIBLE Number Name State Current PC * 1 DBGK$$2727282C step SERVER\main\%LINE 18808 all>
Command Process Set
all> 2,3> STEP processes 2,3 stepped to CLIENT\main\%LINE 18797 18797: if (!(status & 1)) all> clients> STEP processes 2,3 stepped to CLIENT\main\%LINE 18805 18805: memset (&myiosb, 0, sizeof(myiosb)); all>
Process-independent commands ignore any process set prefix, just as they ignore the current process set.
15.5. Debugger Prompts
all> ! by default, current process set is all processes
all>
all> SET PROCESS 2,3,4,5
2,3,4,5> DEFINE /PROCESS_SET interesting 1,2,3,7
2,3,4,5> SET PROCESS interesting
interesting> SET PROCESS *
all> SET PROCESS 3
3>Note
The debugger does not use the process-spec format for the debugger prompt until the debugger becomes aware of more than one process.
15.6. Process-Sensitive Commands
There are two types of commands, process-sensitive and process-independent.
Process-sensitive commands are those that depend on the state of a process, such as
GO, STEP, CALL, and
SET BREAK.
Process-independent commands are those that depend on and affect the state of the debugger and
ignore the state of processes, such as SET DISPLAY,
WAIT, ATTACH, and
SPAWN.
15.7. Visible Process and Process-Sensitive Commands
The visible process is the process shown by default in the source display (and other such
process-oriented displays). When the current process set is changed with the
SET PROCESS command, the visible process is set to be the first
process specified in that command. You can use the SET
PROCESS/VISIBLE command to specify a particular process as the visible one
without changing the current process set.
15.8. Controlling Process Execution
When debugging an application with multiple processes, it is common to have some process stopped while other processes are still running. It can be useful to be able to give commands only to those processes that are stopped without waiting for all processes to stop. Wait mode provides that capability.
15.8.1. WAIT Mode
With regard to executing processes, the debugger has two modes: wait and
nowait. You can control whether or not the debugger waits for all running processes
to stop before the debugger accepts and executes another command by toggling wait
mode with the SET MODE [NO]WAIT command. Wait mode is the
default.
When the debugger is in wait mode and you enter the GO,
STEP, or CALL command, the debugger
executes the command in all processes in the command process set, and waits until
all those processes stop (for example, at breakpoints) before displaying a prompt
and accepting another command.
When the debugger is in nowait mode and you enter the GO,
STEP, or CALL command, the debugger
executes the command in all processes in the command process set, and immediately
displays a prompt. You can enter a new command immediately, regardless of whether
any or all processes have stopped. This provides great flexibility, especially when
debugging multiprocess programs.
While the program is running, you can use the debugger as a source browser. Because the source view is process-independent, you can change its focus while processes are executing.
You can control separate processes one at a time.
You can control more than one process at a time.
SET MODE [NO]WAIT command remains in effect until the next SET
MODE [NO]WAIT command. For
example:all> SET MODE NOWAIT
all> clients> STEP
all> SHOW PROCESS
Number Name State Current PC
1 DBGK$$2727282C step SERVER\main\%LINE 18819
2 USER1_2 running not available
* 3 USER1_3 running not available
all>WAIT command to override nowait mode for the duration of
one command, to direct the debugger to wait until all processes in the command
process set stop before prompting for another command. Nowait mode remains in effect
when the command completes. For
example:all> GO;WAIT
processes 2,3
break at CLIENT\main\%LINE 18814
18814: status = sys$qiow (EFN$C_ENF, mbxchan,
IO$_READVBLK|IO$M_WRITERCHECK, &myiosb,
process 1
break at SERVER\main\%LINE 18834
18834: if ((myiosb.iosb$w_status ==
SS$_NOREADER) && (pos_status != -1))
all>When commands are processed in a non-interactive manner (within debugger command sequences
within FOR, REPEAT, WHILE,
IF, and @ commands, and within
WHEN clauses), WAIT mode is enabled by
default during the execution of the command sequence.
During NOWAIT mode, an EXAMINE command (similar to all
process-independent commands) displays results for those processes in its command
process set that are stopped. If all processes in its command process set are
running, the EXAMINE command reports that condition and the
debugger displays a prompt and accepts a new command. Similarly, a
GO command during NOWAIT mode starts all
stopped processes in the command process set.
15.8.2. Interrupt Mode
Use the SET MODE [NO]INTERRUPT command to toggle the state of interrupt
mode. When interrupt mode is toggled on, the debugger stops all processes when one
process stops. This can be a disadvantage if an interrupted process is deep into a
RTL or system service call because it can leave many irrelevant non-symbolic frames
on top of the process stack.
When interrupt mode is toggled off, the debugger does not stop any other process unless you
enter a STOP command. This is the default mode.
15.8.3. STOP Command
Use the STOP command to interrupt running processes.
The STOP command interrupts all of the running processes in its
command process set.
STOP command completes as soon as it sends a stop request to every
running process in the command set. For example:
all> SHOW PROCESS
Number Name State Current PC
1 DBGK$$2727282C break SERVER\main\%LINE 18834
2 USER1_2 running not available
* 3 USER1_3 running not available
all> clients> STOP
all> SHOW PROCESS
Number Name State Current PC
1 DBGK$$2727282C break SERVER\main\%LINE 18834
2 USER1_2 interrupted 0FFFFFFFF800F7A20
* 3 USER1_3 interrupted 0FFFFFFFF800F7A20
all>15.9. Connecting to Another Program
SHOW PROCESS command. Enter the CONNECT
command and specify the process name of the client program with the debugger
%PROCESS_NAME lexical function. For example:
all> CONNECT %PROCESS_NAME CLIENT2
process 3
predefined trace on activation at 0FFFFFFFF800F7A20
all> SHOW PROCESS
Number Name State Current PC
* 1 DBGK$$2727282C activated SERVER\__main
2 USER1_2 activated CLIENT\__main
3 CLIENT2 interrupted 0FFFFFFFF800F7A20
activated
all>Unexpected results can occur if you enter the CONNECT command if any of the
debugger logicals (DEBUG, DEBUGSHR,
DEBUGUISHR, DBGTBKMSG,
DBG$HELP, DBG$UIHELP,
DEBUGAPPCLASS, and VMSDEBUGUIL) differ between
the debugger main process and the process in which the client runs.
15.10. Connecting to a Spawned Process
SHOW PROCESS command. You can bring the newly spawned
process under debugger control using either of the following methods:Enter a command, such as
STEP, that starts execution (if, as in the following example, your program is of the hierarchical model).Enter the
CONNECTcommand without specifying a parameter. TheCONNECTcommand is useful in cases when you do not want the process to execute further.
CONNECT
command:1>STEPstepped to MAIN_PROG\%LINE 18 in %PROCESS_NUMBER 1 18: LIB$SPAWN("RUN/DEBUG TEST",,,1) 1>STEPstepped to MAIN_PROG\%LINE 21 in %PROCESS_NUMBER 1 21: X = 7 1>CONNECTpredefined trace on activation at routine TEST in %PROCESS_NUMBER 2 all>
In this example, the second STEP command takes you past the
LIB$SPAWN call that spawns the process. The
CONNECT command brings the waiting process under debugger
control. After entering the CONNECT command, you might need to wait a
moment for the process to connect. The "predefined trace on …" message indicates
that the debugger has taken control of a new process which is identified as process
2.
SHOW PROCESS command, entered at this point, identifies the debugging
state for each process and the location at which execution is
paused:all> SHOW PROCESS
Number Name State Current PC
* 1 JONES step MAIN_PROG\%LINE 21
2 JONES_1 activated TEST\%LINE 1+2
all>Note that the CONNECT command brings all processes that are waiting to be
connected to the debugger under debugger control. If no processes are waiting, you can
press Ctrl/C to abort the CONNECT
command and display the debugger prompt.
Unexpected results can occur if you enter the CONNECT command if any of the
debugger logicals (DEBUG, DEBUGSHR,
DEBUGUISHR, DBGTBKMSG,
DBG$HELP, DBG$UIHELP,
DEBUGAPPCLASS, and VMSDEBUGUIL) differ between
the debugger process and the spawned process.
15.11. Monitoring the Termination of Images
When the main image of a process runs to completion, the process goes into the terminated
debugging state (not to be confused with process termination in the operating system
sense). This condition is traced by default, as if you had entered the SET
TRACE/TERMINATING command.
When a process is in the terminated debugging state, it is still known to the debugger and
appears in a SHOW PROCESS display. You can enter commands to examine
variables, and so
on.
15.12. Releasing a Process From Debugger Control
DISCONNECT command. (In contrast, when you specify a process with
the EXIT or QUIT command, the process is
terminated.) This command is required for programs of the client/server model. For
example:
all> SHOW PROCESS
Number Name State Current PC
* 1 DBGK$$2727282C step SERVER\main\%LINE 18823
2 USER1_2 step CLIENT\main\%LINE 18805
3 USER1_3 step CLIENT\main\%LINE 18805
all> DISCONNECT 3all> SHOW PROCESS
Number Name State Current PC
* 1 DBGK$$2727282C step SERVER\main\%LINE 18823
2 USER1_2 step CLIENT\main\%LINE 18805
all> QUIT 1,2
DBG> SHOW PROCESS
%DEBUG-W-NOPROCDEBUG, there are currently no processes being debugged
DBG> EXIT
$Bear in mind that the debugger kernel runs in the same process as the image being debugged. If
you issue the DISCONNECT command for this process,you release your
process, but the kernel remains activated. This activation continues until the program
image finishes running. If you install a new version of the debugger while one or more
disconnected but activated kernels inhabit user program space, you can experience
problems with debugger behavior if you try to reconnect to that program image.
15.13. Terminating Specified Processes
EXIT or QUIT command, specifying one or more
process specifications as parameters. For
example:all> SHOW PROCESS
Number Name State Current PC
* 1 DBGK$$2727282C step SERVER\main\%LINE 18823
2 USER1_2 step CLIENT\main\%LINE 18805
all> QUIT 1,2
DBG> SHOW PROCESS
%DEBUG-W-NOPROCDEBUG, there are currently no processes being debugged
DBG> EXIT
$ 15.14. Interrupting Program Execution
Pressing Ctrl/C (or the abort-key sequence established with
the SETABORT_KEY command) interrupts execution in every process that
is currently running an image. This is indicated as an interrupted state in a
SHOW PROCESS display.
Note that you can also use Ctrl/C to abort a debugger command.
You can also stop a process with the debugger STOP command.
15.15. Ending the Debugging Session
To end the entire debugging session, use the EXIT or
QUIT command without specifying any parameters.
EXIT executes any exit handlers that are declared in the program.
QUIT does not.
QUIT Command
QUIT command to terminate running processes. The
QUIT command terminates all of the running processes in its
command process set without allowing any exit handlers to run. A process set prefix is
ignored before a QUIT command. For
example:all> SHOW PROCESS
Number Name State Current PC
* 1 DBGK$$2727282C step SERVER\main\%LINE 18823
2 USER1_2 step CLIENT\main\%LINE 18805
all> QUIT 1,2
DBG> SHOW PROCESS
%DEBUG-W-NOPROCDEBUG, there are currently no processes being debugged
DBG> EXIT
$ The QUIT command ignores the current process set. If you do not specify a
process, the QUIT command terminates all processes and then
terminates the debugging session.
EXIT Command
EXIT command to terminate running processes. The
EXIT command terminates all of the running processes in its
command process set without allowing any exit handlers to run. A process set prefix is
ignored before an EXIT command. For
example:all> SHOW PROCESS
Number Name State Current PC
* 1 DBGK$$2727282C step SERVER\main\%LINE 18823
2 USER1_2 step CLIENT\main\%LINE 18805
all> EXIT 1,2
DBG> SHOW PROCESS
%DEBUG-W-NOPROCDEBUG, there are currently no processes being debugged
DBG> EXIT
$ The EXIT command ignores the current process set. If you do not specify a
process, the EXIT command terminates all processes and then
terminates the debugging session.
15.16. Supplemental Information
This section provides additional details or more advanced concepts and usages than those covered in Section 15.1, ''Basic Multiprocess Debugging Techniques''.
15.16.1. Process Relationships When Debugging
The debugger consists of two parts: a main debugger image
(DEBUGSHR.EXE) that contains most of the debugger code and
a smaller kernel debugger image
(DEBUG.EXE). This separation reduces potential interference
between the debugger and the program being debugged and also makes it possible to
have a multiprocess debugging
configuration.
When you bring a program under control of the kept debugger, the main debugger spawns a subprocess to run the program along with the kernel debugger.
An application being debugged might run in several processes. Each process under debugger control is running a local copy of the kernel debugger. The main debugger, which is running in its own process, communicates with the other processes through their kernel debuggers.
Although all processes must be in the same UIC group, they do not have to be related in a particular process/subprocess hierarchy. Moreover, the program images running in separate processes do not have to communicate with each other.
See Section 15.16.7, ''System Requirements for Debugging'' for system requirements related to multiprocess debugging.
15.16.2. Specifying Processes in Debugger Commands
When specifying processes in debugger commands, you can use any of the forms listed in Table 15.2, ''Process Specifications'', except when specifying processes with the
CONNECT command (see Section 15.9, ''Connecting to Another Program'').
CONNECT command to bring a process that is not yet known to the
debugger under debugger control. Until you bring a new process under control of the
debugger, the process does not have a debugger-assigned process number, nor can you
reference it with any of the built-in process symbols (for example, %NEXT_PROCESS).
Therefore, when specifying a process with CONNECT, you can use
only its process name or process identifier (PID).|
Format |
Usage |
|---|---|
|
[%PROCESS_NAME] |
The process name, if that name does not contain spaces or lowercase characters. The process name can include the asterisk (*) wildcard character. |
|
[%PROCESS_NAME] " |
The process name, if that name contains spaces or lowercase characters. You can also use apostrophes (') instead of quotation marks ("). |
|
%PROCESS_PID |
The process identifier (PID, a hexadecimal number). |
|
[%PROCESS_NUMBER] |
The number assigned to a process when it comes under
debugger control. A new number is assigned sequentially,
starting with 1, to each process. If a process is terminated
with the |
|
|
A symbol defined with the
|
|
%NEXT_PROCESS |
The next process after the visible process in the debugger's circular process list. |
|
%PREVIOUS_PROCESS |
The process previous to the visible process in the debugger's circular process list. |
|
%VISIBLE_PROCESS |
The process whose stack, register set, and images are the current context for looking up symbols, register values, routine calls, breakpoints, and so on. |
2> SHOW PROCESS 2, JONES_3The built-in symbols %VISIBLE_PROCESS, %NEXT_PROCESS, and %PREVIOUS_PROCESS are useful in
control structures based on the IF, WHILE, or
REPEAT commands and in command procedures.
15.16.3. Monitoring Process Activation and Termination
By default, a tracepoint is triggered when a process comes under debugger control and when it
performs an image exit. These predefined tracepoints are equivalent to those
resulting from entering the SET TRACE/ACTIVATING and SET
TRACE/TERMINATING commands, respectively. You can set breakpoints on
these events with the SET BREAK/ACTIVATING and SET
BREAK/TERMINATING commands.
To cancel the predefined tracepoints, use the CANCEL TRACE/PREDEFINED
command with the /ACTIVATING and /TERMINATING
qualifiers. To cancel any user-defined activation and termination breakpoints, use
the CANCEL BREAK command with the /ACTIVATING
and /TERMINATING qualifiers (the /USER
qualifier is the default when canceling breakpoints or tracepoints).
The debugger prompt is displayed when the first process comes under debugger control. This enables you to enter commands before the main image has started execution, as with a one-process program.
Similarly, the debugger prompt is displayed when the last process performs an image exit. This enables you to enter commands after the program has completed execution, as with a one-process program.
15.16.4. Interrupting the Execution of an Image to Connect It to the Debugger
To start a new debugging session, use the Ctrl/Y -
DEBUGsequence from DCL level. Note that this starts the unkept debugger, which you cannot use for debugging multiprocess programs.To interrupt an image and connect it to an existing multiprocess debugging session, use the debugger
CONNECTcommand.
15.16.5. Screen Mode Features for Multiprocess Debugging
By default, the source, instruction, and register displays show information about the visible process.
/PROCESS qualifier with the
DISPLAY command, you can create process-specific displays or
make existing displays process specific,respectively. The contents of a
process-specific display are generated and modified in the context of that process.
You can make any display process specific except for the PROMPT display. For
example, the following command creates the automatically updated source display
SRC_3, which shows the source code where execution is suspended in process
3:2>DISPLAY/PROCESS=(3) SRC_3 AT RS23 -2>SOURCE (EXAM/SOURCE .%SOURCE_SCOPE\%PC)
SCROLL,
TYPE, and EXAMINE/SOURCE commands are then
directed at
SRC_3:2> SELECT/SCROLL/SOURCE SRC_3DISPLAY/PROCESS command without specifying a process, the
specified display is then specific to the process that was the visible process when
you entered the command. For example, the following command makes display OUT_X
specific to process
2:2> DISPLAY/PROCESS OUT_XIn a multiprocess configuration, the predefined tracepoint on process activation automatically
creates a new source display and a new instruction display for each new process that
comes under debugger control. The displays have the names SRC_ n
and INST_ n, respectively, where n is the
process number. These displays are initially marked as removed. They are
automatically deleted on process termination.
Several predefined keypad key sequences enable you to configure your
screen with the process-specific source and instruction displays that are created
automatically when a process is activated. Key sequences that are specific to
multiprocess programs are as follows: PF1 KP9, PF4 KP9, PF4 KP7, PF4 KP3,PF4 KP1.
See Section A.5, ''Debugger Key Definitions'' for the general effect of these
sequences. Use the SHOW KEY command to determine the exact
commands.
15.16.6. Setting Watchpoints in Global Sections (Alpha and Integrity servers Only)
On Alpha and Integrity servers, you can set watchpoints in global sections. A global section is a region of memory that is shared among all processes of a multiprocess program. A watchpoint that is set on a location in a global section (a global section watchpoint) triggers when any process modifies the contents of that location.
When setting watchpoints on arrays or records, note that performance is improved if you
specify individual elements rather than the entire structure with the SET
WATCH command.
1>SET WATCH ARR(1)1>SHOW WATCHwatchpoint of PPL3\ARR(1)
1> GO
%DEBUG-I-WATVARNOWGBL, watched variable PPL3\ARR(1) has
been remapped to a global section
predefined trace on activation at routine PPL3 in %PROCESS_NUMBER 2
predefined trace on activation at routine PPL3 in %PROCESS_NUMBER 3
watch of PPL3\ARR(1) at PPL3\%LINE 93 in %PROCESS_NUMBER 2
93: ARR(1) = INDEX
old value: 0
new value: 1
break at PPL3\%LINE 94 in %PROCESS_NUMBER 2
94: ARR(I) = Iall> SHOW WATCH
For %PROCESS_NUMBER 1
watchpoint of PPL3\ARR(1) [global-section watchpoint]
For %PROCESS_NUMBER 2
watchpoint of PPL3\ARR(1) [global-section watchpoint]
For %PROCESS_NUMBER 3
watchpoint of PPL3\ARR(1) [global-section watchpoint]
all>15.16.7. System Requirements for Debugging
Several users debugging programs simultaneously can place a load on a system. This section describes the resources used by the debugger, so that you or your system manager can tune your system for this activity.
Note that the discussion covers only the resources used by the debugger. You might also have to tune your system to support the programs themselves.
15.16.7.1. User Quotas
Each user needs a PRCLM quota sufficient to create an additional process for the debugger, beyond the number of processes needed by the program.
Each user's ENQLM quota should be increased by at least the number of processes being debugged.
Each user's PGFLQUOTA might need to be increased. If a user has an insufficient PGFLQUOTA, the debugger might fail to activate or might cause "virtual memory exceeded" errors during execution.
Each user's BYTLM and FILLM quotas might need to be increased. The debugger requires BYTLM and FILLM quotas sufficient to open each image file being debugged, the corresponding source files, and the debugger input,output, and log files.
15.16.7.2. System Resources
The kernel debugger and main debugger communicate through global sections. Each main debugger, regardless of platform, uses at least one64-Kbyte global section. On Alpha, the main debugger can communicate with up to six kernel debuggers. On Integrity servers, it can only communicate with up to2 kernel debuggers.
15.17. Examples
#include <stdio.h>
#include <starlet.h>
#include <cmbdef.h>
#include <types.h>
#include <descrip.h>
#include <efndef.h>
#include <iodef.h>
#include <iosbdef.h>
#include <ssdef.h>
#include <string.h>
#include "mbxtest.h"
int main (int argc, char **argv)
{
unsigned int status, write_ef;
char line_buf [LINE_MAX_LEN + 1];
iosb myiosb; short mbxchan;
/* Get event flag. Look for or create the mailbox.
*/
status = lib$get_ef (&write_ef);
if (!(status & 1))
{
fprintf (stderr, "Server unable to get eventflag,
status = %x", status);
return 0;
}
status = sys$crembx (0, &mbxchan, 0, 0, 0, 0, &mbxname_dsc,
CMB$M_WRITEONLY, 0);
if (!(status & 1))
{
fprintf (stderr, "Server unable to open mailbox,
status = %x", status);
return 0;
}
/* Open for business. Loop looking for and processing requests.
*/
while (TRUE)
{
printf ("Input command: ");
gets (&line_buf);
status = sys$clref (write_ef);
if (!(status & 1))
{
fprintf (stderr, "Client unable to clear read event flag,
status = %x", status);
return 0;
}
status = sys$qiow (write_ef, mbxchan,
IO$_SETMODE | IO$M_READERWAIT, &myiosb,
0, 0, 0, 0, 0, 0, 0, 0);
if ((status) && (myiosb.iosb$w_status))
{
status = sys$clref (write_ef);
if (!(status & 1))
{
fprintf (stderr, "Client unable to clear read event flag,
status = %x", status);
return 0;
}
if (strlen (line_buf) == 0)
status = sys$qio (write_ef, mbxchan, IO$_WRITEOF | IO$M_READERCHECK, &myiosb,
0, 0, 0, 0, 0, 0, 0, 0);
else
status = sys$qio (write_ef, mbxchan, IO$_WRITEVBLK | IO$M_READERCHECK, &myiosb,
0, 0, line_buf, strlen (line_buf), 0, 0, 0, 0);
if (status)
{
status = sys$waitfr (write_ef);
if ((myiosb.iosb$w_status & 1) && (status & 1))
{
if (strlen (line_buf) == 0)
break;
}
else
fprintf (stderr, "Server failure during write,
status = %x, iosb$w_status = %x\n",
status, myiosb.iosb$w_status);
}
else
fprintf (stderr, "Server failure for write request,
status = %x\n", status);
}
else
fprintf (stderr, "Server failure during wait for reader,
status = %x, iosb$w_status = %x\n",
status, myiosb.iosb$w_status);
}
printf ("\n\nServer done...exiting\n");
return 1;}#include <stdio.h>
#include <starlet.h>
#include <cmbdef.h>
#include <types.h>
#include <descrip.h>
#include <efndef.h>
#include <iodef.h>
#include <iosbdef.h>
#include <ssdef.h>
#include <string.h>
#include "mbxtest.h"
int main (int argc, char **argv)
{
unsigned int status, read_ef;
iosb myiosb;
short mbxchan;
char line_buf [LINE_MAX_LEN];
/* Get event flag. Look for or create the mailbox.
*/
status = lib$get_ef (&read_ef);
if (!(status & 1))
{
fprintf (stderr, "Client unable to get eventflag, status = %x", status);
return 0;
}
status = sys$crembx (0, &mbxchan, 0, 0, 0, 0, &mbxname_dsc, CMB$M_READONLY, 0);
if (!(status & 1))
{
fprintf (stderr, "Client unable to open mailbox, status = %x", status);
return 0;
}
/* Loop requesting, receiving, and processing new data.
*/
memset (&myiosb, 0, sizeof(myiosb));
while (myiosb.iosb$w_status != SS$_ENDOFFILE)
{
status = sys$qiow (read_ef, mbxchan, IO$_SETMODE | IO$M_WRITERWAIT, &myiosb,
0, 0, 0, 0, 0, 0, 0, 0);
if ((status) && (myiosb.iosb$w_status))
{
status = sys$clref (read_ef);
if (!(status & 1))
{
fprintf (stderr, "Client unable to clear read event flag, status = %x", status);
return 0;
}
status = sys$qio (read_ef, mbxchan, IO$_READVBLK | IO$M_WRITERCHECK, &myiosb,
0, 0, line_buf, sizeof(line_buf), 0, 0, 0, 0);
if (status)
{
status = sys$waitfr (read_ef);
if ((myiosb.iosb$w_status & 1) && (status & 1))
puts (line_buf);
else if ((myiosb.iosb$w_status != SS$_NOWRITER) &&
(myiosb.iosb$w_status != SS$_ENDOFFILE))
fprintf (stderr, "Client failure during read,
status = %x, iosb$w_status = %x\n",
status, myiosb.iosb$w_status);
}
else
fprintf (stderr, "Client failure for read request, status = %x\n", status);
}
else
fprintf (stderr, "Client failure during wait for writer,
status = %x, iosb$w_status = %x\n",
status, myiosb.iosb$w_status);
status = sys$clref (read_ef);
if (!(status & 1))
{
fprintf (stderr, "Client unable to clear read event flag,
status = %x", status);
return 0;
}
}
printf ("\nClient done...exiting\n");
return 1;
}$DESCRIPTOR(mbxname_dsc, "dbg$mptest_mbx"); #define LINE_MAX_LEN 255
Chapter 16. Debugging Tasking Programs
Programs written in any language that use POSIX Threads or POSIX1003.1b services. When debugging these programs, the debugger default event facility is THREADS. Alpha and Integrity servers makes use of POSIX Threads services.
Programs that use language-specific tasking services (services provided directly by the language). Currently, Ada is the only language with built-in tasking services that the debugger supports. When debugging Ada programs, the debugger default event facility is ADA.
Note
Within the debugger, the terms task and thread are synonyms.
When you are debugging programs linked with PTHREAD$RTL Version 7.1 or greater, you can directly access the HPE POSIX Threads debugger with the PTHREAD command.
In this chapter, any language-specific information or information specific to POSIX Threads is identified as such. Section 16.1, ''Comparison of POSIX Threads and Ada Terminology'' provides a cross-reference between POSIX Threads terminology and Ada tasking terminology.
Displaying task information
Modifying task characteristics to control task execution, priority, state transitions, and so on
Monitoring task-specific events and state transitions
When using these features, remember that the debugger might alter the behavior of a tasking program from run to run. For example, while you are suspending execution of the currently active task at a breakpoint, the delivery of an asynchronous system trap (AST) or a POSIX signal as some input/output (I/O) completes might make some other task eligible to run as soon as you allow execution to continue.
For more information about POSIX Threads, see the Guide to POSIX Threads Library. For more information about Ada tasks, see the HPE Ada documentation.
The debugging of multiprocess programs (programs that run in more than one process) is described in Chapter 15, "Debugging Multiprocess Programs".
16.1. Comparison of POSIX Threads and Ada Terminology
|
POSIX Threads Terminology |
Ada Terminology |
Description |
|---|---|---|
|
Thread |
Task |
The flow of control within a process |
|
Thread object |
Task object |
The data item that represents the flow of control |
|
Object name or expression |
Task name or expression |
The data item that represents the flow of control |
|
Start routine |
Task body |
The code that is executed by the flow of control |
|
Not applicable |
Master task |
A parent flow of control |
|
Not applicable |
Dependent task |
A child flow of control that is controlled by some parent |
|
Synchronization object (mutex, condition variable) |
Rendezvous construct such as an entry call or accept statement |
Method of synchronizing flows of control |
|
Scheduling policy and scheduling priority |
Task priority |
Method of scheduling execution |
|
Alert operation |
Abort statement |
Method of canceling a flow of control |
|
Thread state |
Task state |
Execution state (waiting, ready, running, terminated) |
|
Thread creation attribute (priority, scheduling policy, and so on) |
Pragma |
Attributes of the parallel entity |
16.2. Sample Tasking Programs
Section 16.2.1, ''Sample C Multithread Program'' describes a C program that uses POSIX Threads services
Section 16.2.2, ''Sample Ada Tasking Program'' describes an Ada program that uses the built-in Ada tasking services
Some other examples in this chapter are derived from these programs.
16.2.1. Sample C Multithread Program
Example 16.1, ''Sample C Multithread Program'' is a multithread C program that shows incorrect use of condition variables, which results in blocking.
Explanatory notes are included after the example. Following these notes are instructions showing how to use the debugger to diagnose the blocking by controlling the relative execution of the threads.
SHOW
TASK/ALL command will show three tasks, each corresponding to a thread
(Section 16.4, ''Displaying Information About Tasks'' explains how to use the SHOW
TASK command). %TASK 1 is the initial thread, which executes from main(). (Section 16.3.3, ''Task ID'' defines task IDs, such as %TASK 1.)
%TASK 2 and %TASK 3 are the worker threads.
In Example 16.1, ''Sample C Multithread Program'', a synchronization point (a condition wait) has been placed in the workers' path at line 3893. (The comment starting at line 3877 indicates that a straight call such as this one is incorrect programming and shows the correct code.)
3777 /* DEFINES */
3778 #define NUM_WORKERS 2 /* Number of worker threads */
3779
3780 /* MACROS */
3781 #define check(status, string) \
3782 if (status == -1) perror (string); \
3783
3784 /* GLOBALS */
3785 int cv_pred1; /* Condition Variable predicate */
3786 pthread_mutex_t cv_mutex; /* Condition Variable mutex */
3787 pthread_cond_t cv; /* Condition Variable */
3788 pthread_mutex_t print_mutex; /* Print mutex */
3799
3790 /* ROUTINES */
3791 static pthread_startroutine_t
3792 worker_routine (pthread_addr_t arg);
3793
3794 main ()
3795 {
3796 pthread_t threads[NUM_WORKERS]; /* Worker threads */
3787 int status; /* Return statuses */
3798 int exit; /* Join exit status */
3799 int result; /* Join result value */
3800 int i; /* Loop index */
3801
3802 /* Initialize mutexes */
3803 status = pthread_mutex_init (&cv_mutex, pthread_mutexattr_default);
3804 check (status, "cv_mutex initialization bad status");
3805 status = pthread_mutex_init (&print_mutex, pthread_mutexattr_default);
3806 check (status, "print_mutex intialization bad status");
3807
3808 /* Initialize condition variable */
3809 status = pthread_cond_init (&cv, pthread_condattr_default);
3810 check (status, "cv condition init bad status");
3811
3812 /* Initialize condition variable predicate. */
3813 cv_pred1 = 1;
3814
3815 /* Create worker threads */
3816 for (i = 0; i < NUM_WORKERS; i++) {
3817 status = pthread_create (
3818 &threads[i],
3819 pthread_attr_default,
3820 worker_routine,
3821 0);
3822 check (status, "threads create bad status");
3823 }
3824
3825 /* Set cv_pred1 to false; do this inside the lock to insure visibility. */
3826
3827 status = pthread_mutex_lock (&cv_mutex);
3828 check (status, "cv_mutex lock bad status");
3829
3830 cv_pred1 = 0;
3831
3832 status = pthread_mutex_unlock (&cv_mutex);
3833 check (status, "cv_mutex unlock bad status");
3834
3835 /* Broadcast. */
3836 status = pthread_cond_broadcast (&cv);
3837 check (status, "cv broadcast bad status");
3838
3839 /* Attempt to join both of the worker threads. */
3840 for (i = 0; i < NUM_WORKERS; i++) {
3841 exit = pthread_join (threads[i], (pthread_addr_t*)&result);
3842 check (exit, "threads join bad status");
3843 }
3844 }
3845
3846 static pthread_startroutine_t
3847 worker_routine(arg)
3848 pthread_addr_t arg;
3849 {
3850 int sum;
3851 int iterations;
3852 int count;
3853 int status;
3854
3855 /* Do many calculations */
3856 for (iterations = 1; iterations < 10001; iterations++) {
3857 sum = 1;
3858 for (count = 1; count < 10001; count++) {
3859 sum = sum + count;
3860 }
3861 }
3862
3863 /* Printf may not be reentrant, so allow 1 thread at a time */
3864
3865 status = pthread_mutex_lock (&print_mutex);
3866 check (status, "print_mutex lock bad status");
3867 printf (" The sum is %d \n", sum);
3868 status = pthread_mutex_unlock (&print_mutex);
3869 check (status, "print_mutex unlock bad status");
3870
3871 /* Lock the mutex associated with this condition variable. pthread_cond_wait will */
3872 /* unlock the mutex if the thread blocks on the condition variable. */
3873
3874 status = pthread_mutex_lock (&cv_mutex);
3875 check (status, "cv_mutex lock bad status");
3876
3877 /* In the next statement, the correct condition-wait syntax would be to loop */
3878 /* around the condition-wait call, checking the predicate associated with the */
3879 /* condition variable. This would guard against condition waiting on a condition */
3880 /* variable that may have already been broadcast upon, as well as spurious wake */
3881 /* ups. Execution would resume when the thread is woken AND the predicate is */
3882 /* false. The call would look like this: */
3883 /* */
3884 /* while (cv_pred1) { */
3885 /* status = pthread_cond_wait (&cv, &cv_mutex); */
3886 /* check (status, "cv condition wait bad status"); */
3887 /* } */
3888 /* */
3888 /* A straight call, as used in the following code, might cause a thread to */
3890 /* wake up when it should not (spurious) or become permanently blocked, as */
3891 /* should one of the worker threads here. */
38923893 status = pthread_cond_wait (&cv, &cv_mutex);
3894 check (status, "cv condition wait bad status");
3895
3896 /* While blocking in the condition wait, the routine lets go of the mutex, but */
3897 /* it retrieves it upon return. */
3898
3899 status = pthread_mutex_unlock (&cv_mutex);
3900 check (status, "cv_mutex unlock bad status");
3901
3902 return (int)arg;
3903 }
| The first few statements of main() initialize the synchronization
objects used by the threads, as well as the predicate that is to be
associated with the condition variable. The synchronization objects are
initialized with the default attributes. The condition variable
predicate is initialized such that a thread that is looping on it will
continue to loop. At this point in the program, a |
| The worker threads %TASK 2 and %TASK 3 are created. Here the created threads execute the same start routine (worker_routine) and can also reuse the same call to pthread_create with a slight change to store the different thread IDs. The threads are created using the default attributes and are passed an argument that is not used in this example. |
| The predicate associated with the condition variable is cleared in preparation to broadcast. This ensures that any thread awaking off the condition variable has received a valid wake-up and not a spurious one. Clearing the predicate also prevents any new arrivals from waiting on the condition variable because it has been broadcast or signaled upon. (The desired effect depends on correct coding being used for the condition wait call at line 3893, which is not the case in this example.) |
| The initial thread issues the broadcast call almost immediately, so that none of the worker threads should yet be at the condition wait. A broadcast should wake any threads currently waiting on the condition variable. As the programmer, you should ensure that a broadcast is seen by either ensuring that all threads are waiting on the condition variable at the time of broadcast or ensuring that an associated predicate is used to flag that the broadcast has already happened. (These measures have been left out of this example on purpose.) |
| The initial thread attempts to join with the worker threads to ensure that they exited properly. |
| When the worker threads execute worker_routine, they spend time doing many computations. This allows the initial thread to broadcast on the condition variable before either of the worker threads is waiting on it. |
| The worker threads then proceed to execute a pthread_cond_waitcall by
performing locks around the call as required. It is here that both
worker threads will block, having missed the broadcast. |
At the start of the debugging session, set a breakpoint on line 3836 to suspend execution of the initial thread just before broadcast.
Enter the
GOcommand to execute the initial thread and create the worker threads.At this breakpoint, which causes the execution of all threads to be suspended, put the initial thread on hold with the
SET TASK/HOLD %TASK 1command.Enter the
GOcommand to let the worker threads continue execution. The initial thread is on hold and cannot execute.When the worker threads block on the condition variable, press Ctrl/C to return control to the debugger at that point. A
SHOW TASK/ALLcommand should indicate that both worker threads are suspended in a condition wait substate. (If not, enterGOto let the worker threads execute, press Ctrl/C, and enterSHOW TASK/ALL, repeating the sequence until both worker threads are in a condition wait substate.)Enter the
SET TASK/NOHOLD %TASKcommand1and then theGOcommand to allow the initial thread to resume execution and broadcast. This will enable the worker threads to join and terminate properly.
16.2.2. Sample Ada Tasking Program
DBG>SET BREAK %LINE 37 DO (SHOW TASK/ALL)DBG>SET BREAK %LINE 61 DO (SHOW TASK/ALL)DBG>SET BREAK %LINE 65 DO (SHOW TASK/ALL)DBG>SET BREAK %LINE 81 DO (SHOW TASK/ALL)DBG>SET BREAK %LINE 87 DO (SHOW TASK/ALL)DBG>SET BREAK %LINE 91 DO (SHOW TASK/ALL)DBG>SET BREAK %LINE 105 DO (SHOW TASK/ALL)
An environment task that runs the main program, TASK_EXAMPLE. This task is created before any library packages are elaborated (in this case, TEXT_IO). The environment task has the task ID %TASK 1 in the
SHOW TASKdisplays.A task object named FATHER. This task is declared by the main program, and is designated %TASK 3 in the
SHOW TASKdisplays.A single task named CHILD. This task is declared by task FATHER, and is designated %TASK 4 in the
SHOW TASKdisplays.A single task named MOTHER. This task is declared by the main program, and is designated %TASK 2 in the
SHOW TASKdisplays.
1 --Tasking program that demonstrates various tasking conditions. 2 3 with TEXT_IO; use TEXT_IO; 4 procedure TASK_EXAMPLE is
| After all of the Ada library packages are elaborated (in this case, TEXT_IO), the main program is automatically called and begins to elaborate its declarative part (lines 5 through 68). |
| To ensure repeatability from run to run, the example uses no time slicing The 0.0 value for the pragma TIME_SLICE documents that the procedure TASK_EXAMPLE needs to have time slicing disabled. On Alpha systems, pragma TIME_SLICE (0.0) must be used to disable time slicing. |
| Task object FATHER is elaborated, and a task designated %TASK 3 is created. FATHER has no pragma PRIORITY, and thus assumes a default priority. FATHER (%TASK 3) is created in a suspended state and is not activated until the beginning of the statement part of the main program (line 69), in accordance with Ada rules. The elaboration of the task body on lines 16 through 67 defines the statements that tasks of type FATHER_TYPE will execute. |
| Task FATHER declares a single task named CHILD (line 19). A single task represents both a task object and an anonymous task type. Task CHILD is not created or activated until FATHER is activated. |
| The only source of asynchronous system traps (ASTs) is this series of TEXT_IO.PUT_LINE statements(I/O completion delivers ASTs). |
| The task FATHER is activated while the main program waits. FATHER has no pragma PRIORITY and this assumes a default priority of 7. (See the DEC Ada Language Reference Manual for the rules about default priorities.) FATHER's activation consists of the elaboration of lines 16 through 29. When task FATHER is activated, it waits while its task CHILD is activated and a task designated %TASK 4 is created. CHILD executes one entry call on line 25, and then deadlocks because the entry is never accepted (see Section 16.7.1, ''Debugging Programs with Deadlock Conditions''). Because time slicing is disabled and there are no higher priority tasks to be run, FATHER will continue to execute past its activation until it is blocked at the ACCEPT statement at line 32. |
| A single task, MOTHER, is defined, and a task designated%TASK 2 is created. The pragma PRIORITY gives MOTHER a priority of 6. |
| The task MOTHER begins its activation and executes line 74. After MOTHER is activated, the main program (%TASK 1) is eligible to resume its execution. Because %TASK 1 has the default priority 7, which is higher than MOTHER's priority, the main program resumes execution. |
| This is the first rendezvous the main program makes with task FATHER. After the rendezvous FATHER will suspend at the SELECT with TERMINATE statement at line 43. |
| At the third rendezvous with FATHER, FATHER raises the exception SOME_ERROR on line 52. The handler on line 57 catches the exception, aborts the suspended CHILD task, and then reraises the exception; FATHER then terminates. |
| A loop with a delay statement ensures that when control reaches line 102, FATHER has executed far enough to be terminated. |
| This entry call ensures that MOTHER does not wait forever for its rendezvous on line 76. MOTHER executes the accept statement (which involves no other statements), the rendezvous is completed, and MOTHER is immediately switched off the processor at line 77 because its priority is only 6. |
| After its rendezvous with MOTHER, the main program ( |
16.3. Specifying Tasks in Debugger Commands
A task is an entity that executes in parallel with other tasks. A task is characterized by a unique task ID (see Section 16.3.3, ''Task ID''), a separate stack, and a separate register set.
The current definition of the active task and the visible task determine the context for manipulating tasks. See Section 16.3.1, ''Definition of Active Task and Visible Task''.
A task (thread) name as declared in the program (for example, FATHER in Section 16.2.2, ''Sample Ada Tasking Program'') or a language expression that yields a task value. Section 16.3.2, ''Ada Tasking Syntax'' describes Ada language expressions for tasks.
A task ID (for example, %TASK 2). See Section 16.3.3, ''Task ID''.
A task built-in symbol (for example, %ACTIVE_TASK). See Section 16.3.4, ''Task Built-In Symbols''.
16.3.1. Definition of Active Task and Visible Task
STEP, GO,
CALL, or EXIT command executes. Initially,
it is the task in which execution is suspended when the program is brought under
debugger control. To change the active task during a debugging session, use the
SET TASK/ACTIVE command.
Note
The SET TASK/ACTIVE command does not work for
POSIX Threads (on OpenVMS Alpha and Integrity server systems)or for Ada on
OpenVMS Alpha and Integrity server systems, the tasking for which is
implemented via POSIX Threads. Instead of SET TASK/ACTIVE,
use the SET TASK/VISIBLE command on POSIX Threads for
query-type actions. Or, to gain control to step through a particular thread,
use a strategic placement of breakpoints.
DBG> EXAMINE KEEP_COUNTInitially, the visible task is the active task. To change the visible
task, use the SET TASK/VISIBLE command. This enables you to look
at the state of other tasks without affecting the active task.
You can specify the active and visible tasks in debugger commands by using the built-in symbols %ACTIVE_TASK and %VISIBLE_TASK, respectively (see Section 16.3.4, ''Task Built-In Symbols'').
See Section 16.5, ''Changing Task Characteristics'' for more information about using the SET
TASK command to modify task characteristics.
16.3.2. Ada Tasking Syntax
-- TASK TYPE declaration. -- task type FATHER_TYPE is … end FATHER_TYPE; task body FATHER_TYPE is … end FATHER_TYPE; -- A single task. -- task MOTHER is … end MOTHER; task body MOTHER is … end MOTHER;
-- Task object declaration. -- FATHER : FATHER_TYPE; -- Task object (T) as a component of a record. -- type SOME_RECORD_TYPE is record A, B: INTEGER; T : FATHER_TYPE; end record; HAS_TASK : SOME_RECORD_TYPE; -- Task object (POINTER1) via allocator. -- type A is access FATHER_TYPE; POINTER1 : A := new FATHER_TYPE;
DBG>EXAMINE FATHERDBG>EXAMINE FATHER_TYPE$TASK_BODY.CHILD
When a task object is elaborated, a task is created by the HPE Ada Run-Time Library, and the task object is assigned its task value. As with other Ada objects, the value of a task object is undefined before the object is initialized, and the results of using an uninitialized value are unpredictable.
The task body of a task type or single task is implemented in HPE Ada as a procedure. This procedure is called by the HPE Ada Run-Time Library when a task of that type is activated. A task body is treated by the debugger as a normal Ada procedure, except that it has a specially constructed name.
task-type-identifier$TASK_BODYtask-identifier$TASK_BODYDBG> SET BREAK FATHER_TYPE$TASK_BODYThe debugger does not support the task-specific Ada attributes T'CALLABLE, E'COUNT,
T'STORAGE_SIZE, and T'TERMINATED, where T is a task type and E is a task entry (see
the HPE Ada documentation for more information on these attributes). You cannot
enter commands such as EVALUATE CHILD'CALLABLE. However, you can
get the information provided by each of these attributes with the debugger
SHOW TASK command. For more information, see Section 16.4, ''Displaying Information About Tasks''.
16.3.3. Task ID
A task ID is the number assigned to a task when it is created by the tasking system. The task ID uniquely identifies a task during the entire execution of a program.
n is a positive decimal
integer:%TASK nDBG>EVALUATE FATHER%TASK 3 DBG>EXAMINE FATHERTASK_EXAMPLE.FATHER: %TASK 3
If the programming language does not have built-in tasking services, you must use the
EXAMINE/TASK command to obtain the task ID of a task.
EXAMINE/TASK/HEXADECIMAL command, when applied to a task
object, yields the hexadecimal task value. The task value is the address of the task
(or thread) control block of that task. For example (Ada
example):DBG> EXAMINE/HEXADECIMAL FATHER
TASK_EXAMPLE.FATHER: 0085A448
DBG>SHOW TASK/ALL command enables you to identify the
task IDs that have been assigned to all currently existing tasks. Some of these
existing tasks may not be immediately familiar to you for the following reasons:A
SHOW TASK/ALLdisplay includes tasks created by subsystems such as POSIX Threads, Remote Procedure Call services, and the C Run-Time Library, not just the tasks associated with your application.A
SHOW TASK/ALLdisplay includes task ID assignments that depend on your operating system, your tasking service, and the generating subsystem. The same tasking program, run on different systems or adjusted for different services, will not identify tasks with the same decimal integer. The only exception is %TASK 1, which all systems and services assign to the task that executes the main program.
DBG> SHOW TASK/ALL
task id state hold pri substate thread_object
%TASK 1 READY HOLD 12 Initial thread
%TASK 2 SUSP 12 Condition Wait THREAD_EX1\main\threads[0].field1
%TASK 3 SUSP 12 Condition Wait THREAD_EX1\main\threads[1].field1
DBG>DBG> SHOW TASK/ALL
task id state hold pri substate thread_object
%TASK 1 7 SUSP Entry call SHARE$ADARTL+393712
* %TASK 3 7 READY TASK_EXAMPLE.FATHER
%TASK 4 7 SUSP Entry call TASK_EXAMPLE.FATHER_TYPE$TASK_BODY.CHILD
%TASK 2 6 SUSP Not yet activated TASK_EXAMPLE.MOTHERDBG>SET BREAK %LINE 30 WHEN (%ACTIVE_TASK=%TASK 2)DBG>IF (%CALLER=%TASK 3) THEN (SHOW TASK/FULL)
You can use a task ID in certain debugger commands before the task has been created without
the debugger reporting an error (as it would if you used a task object name before
the task object came into existence). A task does not exist until the task is
created. Later the task becomes nonexistent sometime after it terminates. A
nonexistent task never appears in a debugger SHOW TASK
display.
Each time a program runs, the same task IDs are assigned to the same tasks so long as the program statements are executed in the same order. Different execution orders can result from ASTs (caused by delay statement expiration or I/O completion) being delivered in a different order. Different execution orders can also result from time slicing being enabled. A given task ID is never reassigned during the execution of the program.
16.3.4. Task Built-In Symbols
Examples using these task built-in symbols follow.
DBG> EVALUATE %VISIBLE_TASKDBG> SET TASK/HOLD %ACTIVE_TASKDBG> SET BREAK %LINE 25 WHEN (%ACTIVE_TASK=CHILD)DBG>SHOW TASK %VISIBLE_TASK; SET TASK/VISIBLE %NEXT_TASKDBG>SHOW TASK %VISIBLE_TASK; SET TASK/VISIBLE %NEXT_TASK⋮ DBG>EXAMINE MONITOR_TASKMOD\MONITOR_TASK: %TASK 2 DBG>WHILE %NEXT_TASK NEQ %ACTIVE DO (SET TASK %NEXT_TASK; SHOW CALLS)
16.3.4.1. Caller Task Symbol (Ada Only)
The symbol %CALLER_TASK is specific to Ada tasks. It evaluates to the task ID of the task that called the entry associated with the accept statement. Otherwise, it evaluates to %TASK 0. For example, %CALLER_TASK evaluates to %TASK 0 if the active task is not currently executing the sequence of statements associated with the accept statement.
EVALUATE%CALLER_TASK command
is entered at this point, the result is the task ID of the calling task, the
main
program:DBG> EVALUATE %CALLER_TASK
%TASK 1
DBG>When the rendezvous is the result of an AST entry call, %CALLER_TASK evaluates to %TASK 0 because the caller is not a task.
16.4. Displaying Information About Tasks
To display information about one or more tasks of your program, use the SHOW
TASK command.
The SHOW TASK command displays information about existing (nonterminated)
tasks. By default, the command displays one line of information about the visible
task.
Section 16.4.1, ''Displaying Information About POSIX Threads Tasks'' and Section 16.4.2, ''Displaying Task Information About Ada Tasks''describe
the information displayed by a SHOW TASK command for POSIX Threads and
Ada tasks, respectively.
16.4.1. Displaying Information About POSIX Threads Tasks
SHOW TASK displays information about all of the tasks of the
program that currently exist (see Example 16.3, ''Sample SHOW TASK/ALL Display for POSIX Threads Tasks'').
| The task ID (see Section 16.3.3, ''Task ID''). The active task is marked with an asterisk (*) in the leftmost column. |
| The current state of the task (see Table 16.3, ''Generic Task States''). The task in the RUN (RUNNING) state is the active task. Table 16.3, ''Generic Task States'' lists the state transitions possible during program execution. |
| Whether the task has been put on hold with a |
| |
| The current substate of the task. The substate helps indicate the possible cause of a task's state. See Table 16.4, ''POSIX Threads Task Substates''. |
| A debugger path name for the task (thread) object or the address of the task object if the debugger cannot symbolize the task object. |
|
Task State |
Description |
|---|---|
|
RUNNING |
Task is currently running on the processor. This is the active task. A task in this state can make a transition to the READY, SUSPENDED, or TERMINATED state. |
|
READY |
Task is eligible to execute and waiting for the processor to be made available. A task in this state can make a transition only to the RUNNING state. |
|
SUSPENDED |
Task is suspended, that is, waiting for an event rather than for the availability of the processor. For example, when a task is created, it remains in the suspended state until it is activated. A task in this state can make a transition only to the READY or TERMINATED state. |
|
TERMINATED |
Task is terminated. A task in this state cannot make a transition to another state. |
|
Task Substate |
Description |
|---|---|
|
Condition Wait |
Task is waiting on a POSIX Threads condition variable. |
|
Delay |
Task is waiting at a call to a POSIX Threads delay. |
|
Mutex Wait |
Task is waiting on a POSIX Threads mutex. |
|
Not yet started |
Task has not yet executed its start routine. |
|
Term. by alert |
Task has been terminated by an alert operation. |
|
Term. by exc |
Task has been terminated by an exception. |
|
Timed Cond Wait |
Task is waiting on a timed POSIX Threads condition variable. |
SHOW TASK/FULL command provides detailed information about each task
selected for
display.Example 16.4, ''Sample SHOW TASK/FULL Display for a POSIX Threads Task'' shows the output of this command for a
sample POSIX Threads task.
| Identifying information about the task. |
| Bulletin-type information about something unusual. |
| Next execution PC value and start routine. |
| Task scheduling policy. |
| Stack storage information:
|
| Minimum and maximum addresses of the task stack. |
| Task (thread) control block information. The task value is the address, in hexadecimal notation, of the task control block. |
| The total storage used by the task. Adds together the task control block size, the number of reserved bytes, the top guard size, and the storage size. |
Figure 16.1, ''Diagram of a Task Stack'' shows a task stack.
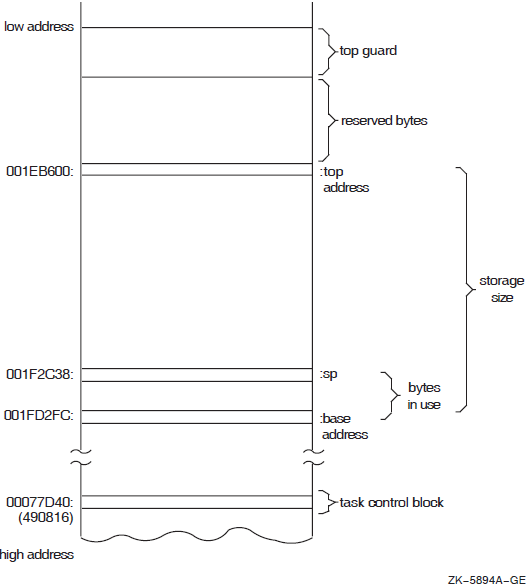
SHOW TASK/STATISTICS command reports some statistics about all tasks in
your program.
Example 16.5, ''Sample SHOW TASK/STAT/FULL Display for POSIX Threads Tasks'' shows the output of the SHOW
TASK/STATISTICS/FULL command for a sample program with POSIX Threads
tasks. This information enables you to measure the performance of your program. The
larger the number of total schedulings (also known as context switches), the more
tasking overhead there is.task statistics
Total context switches: 0
Number of existing threads: 0
Total threads created: 0
DBG>16.4.2. Displaying Task Information About Ada Tasks
SHOW TASK/ALL command displays information about all of the tasks of
the program that currently exist -- namely, tasks that have been created and whose
master has not yet terminated (see Example 16.6, ''Sample SHOW TASK/ALL Display for Ada Tasks'').DBG>SHOW TASK/ALL
| The task ID (see Section 16.3.3, ''Task ID''). An asterisk indicates that the task is a visible task. |
| The current state of the task (see Table 16.3, ''Generic Task States''). The task that is in the RUN (RUNNING) state is the active task.Table 16.3, ''Generic Task States'' lists the state transitions possible during program execution. |
| Whether the task has been put on hold with a SET TASK/HOLD command as explained in Section 16.5.1, ''Putting Tasks on Hold to Control Task Switching''. Placing a task on HOLD restricts the state transitions it can make after the program is subsequently allowed to execute. |
| The task priority. Ada priorities range from 0 to 15.
On Alpha systems, a task with an undefined priority competes
with other tasks, as if having a mid-range priority (between 7 and
8).Ada provides the following two mechanisms for controlling task priorities:
|
| The current substate of the task. The substate helps indicate the possible cause of a task's state. See Table 16.5, ''Ada Task Substates''. |
| A debugger path name for the task object or the address of the task object if the debugger cannot symbolize the task object. |
|
Task Substate |
Description |
|---|---|
|
Abnormal |
Task has been aborted. |
|
Accept |
Task is waiting at an accept statement that is not inside a select statement. |
|
Activating |
Task is elaborating its declarative part. |
|
Activating tasks |
Task is waiting for tasks it has created to finish activating. |
|
Completed [abn] |
Task is completed due to an abort statement but is not yet terminated. In Ada, a completed task is one that is waiting for dependent tasks at its end statement. After the dependent tasks are terminated, the state changes to terminated. |
|
Completed [exc] |
Task is completed due to an unhandled exception ? but is not yet terminated. In Ada, a completed task is one that is waiting for dependent tasks at its end statement. After the dependent tasks are terminated, the state changes to terminated. |
|
Completed |
Task is completed. No abort statement was issued and no unhandled exception ? occurred. |
|
Delay |
Task is waiting at a delay statement. |
|
Dependents |
Task is waiting for dependent tasks to terminate. |
|
Dependents [exc] |
Task is waiting for dependent tasks to allow an unhandled exception ? to propagate. |
|
Entry call |
Task is waiting for its entry call to be accepted. |
|
Invalid state |
There is an error in the HPE Ada Run-Time Library. |
|
I/O or AST |
Task is waiting for I/O completion or some AST. |
|
Not yet activated |
Task is waiting to be activated by the task that created it. |
|
Select or delay |
Task is waiting at a select statement with a delay alternative. |
|
Select or terminate |
Task is waiting at a select statement with a terminate alternative. |
|
Select |
Task is waiting at a select statement with no else, delay, or terminate alternative. |
| Shared resource | Task is waiting for an internal shared resource. |
|
Terminated [abn] |
Task was terminated by an abort statement. |
|
Terminated [exc] |
Task was terminated because of an unhandled exception. ? |
|
Terminated |
Task terminated normally. |
|
Timed entry call |
Task is waiting in a timed entry call. |
Figure 16.1, ''Diagram of a Task Stack'' shows a task stack.
SHOW TASK/FULL command provides detailed information about each tasks
elected for display.
Example 16.7, ''Sample SHOW TASK/FULL Display for an Ada Task'' shows the output of this command for a
sample Ada task.
| Identifying information about the task. |
| Rendezvous information. If the task is a caller task, it lists the entries for which it is queued. If the task is to be called, it gives information about the kind of rendezvous that will take place and lists the callers that are currently queued for any of the task's entries. |
| Stack storage information:
|
| Minimum and maximum addresses of the task stack.
|
| Task (thread) control block information. The task value is the address, in hexadecimal notation, of the task control block. |
| The total storage used by the task. Adds together the task control block size, the number of reserved bytes, the top guard size, and the storage size. |
SHOW TASK/STATISTICS command reports some statistics about all tasks in
your program.
Example 16.8, ''Sample SHOW TASK/STATISTICS/FULL Display for Ada Tasks'' shows the output of the SHOW
TASK/STATISTICS/FULL command for a sample Ada tasking program on a VAX
system. This information enables you to measure the performance of your program. The
larger the number of total schedulings (also known as context switches), the more
tasking overhead there is.DBG> SHOW TASK/STATISTICS/FULL task statistics Total context switches: 0 Number of existing threads: 6 Total threads created: 4 DBG>
16.5. Changing Task Characteristics
SET TASK command, as shown in the following table: |
Command |
Description |
|---|---|
SET TASK/ACTIVE |
Makes a specified task the active task; not for POSIX Threads (on OpenVMS Alpha or Integrity servers) or Ada on OpenVMS Alpha and Integrity servers (see Section 16.3.1, ''Definition of Active Task and Visible Task''). |
SET TASK/VISIBLE |
Makes a specified task the visible task (see Section 16.3.1, ''Definition of Active Task and Visible Task''). |
SET TASK/ABORT |
Requests that a task be terminated at the next allowed opportunity. The exact effect depends on the current event facility (language dependent). For Ada tasks, this is equivalent to executing an abort statement. |
SET TASK/PRIORITY |
Sets a task's priority. The exact effect depends on the current event facility (language dependent). |
SET TASK/RESTORE |
Restores a task's priority. The exact effect depends on the current event facility (language dependent). |
SET TASK/[NO]HOLD |
Controls task switching (task state transitions, see Section 16.5.1, ''Putting Tasks on Hold to Control Task Switching''). |
For more information, see the SET TASK command description.
16.5.1. Putting Tasks on Hold to Control Task Switching
Task switching might be confusing when you are debugging a program. Placing a task on hold
with the SET TASK/HOLD command restricts the state transitions
the task can make once the program is subsequently allowed to execute.
A task placed on hold can enter any state except the RUNNING state. If necessary, you can
force it into the RUNNING state by using the SET TASK/ACTIVE
command.
SET TASK/HOLD/ALL command freezes the state of all tasks except the
active task. You can use this command in combination with the SET
TASK/ACTIVE command, to observe the behavior of one or more specified
tasks in isolation, by executing the active task with the STEP or
GO command, and then switching execution to another task with
the SET TASK/ACTIVE command. For
example:DBG>SET TASK/HOLD/ALLDBG>SET TASK/ACTIVE %TASK 1DBG>GO⋮ DBG>SET TASK/ACTIVE %TASK 3DBG>STEP⋮
When you no longer want to hold a task, use the SET TASK/NOHOLD
command.
16.6. Controlling and Monitoring Execution
Set task-specific and task-independent eventpoints (breakpoints, tracepoints, and so on)
Set breakpoints and tracepoints on task locations specific to POSIX Threads
Set breakpoints and tracepoints on task locations specific to Ada
Monitor task events with the
SET BREAK/EVENTorSET TRACE/EVENTcommands
16.6.1. Setting Task-Specific and Task-Independent Debugger Eventpoints
An eventpoint is an event that you can use to return control to the
debugger. Breakpoints, tracepoints, watchpoints, and the completion of
STEP commands are eventpoints.
DBG>SET BREAK COUNTERDBG>SET BREAK/NOSOURCE %LINE 55, CHILD$TASK_BODYDBG>SET WATCH/AFTER=3 KEEP_COUNT
A task-specific eventpoint can be set only for the task that is active
when the command is entered. A task-specific eventpoint is triggered only when that
same task is active. For example, the STEP/LINE command is a
task-specific eventpoint: other tasks might execute the same source line and not
trigger the event.
SET BREAK, SET TRACE, or
STEP commands with the following qualifiers, the resulting
eventpoints are task specific: /BRANCH/CALL/INSTRUCTION/LINE/RETURN
SET WATCH command are task independent. The following are
examples of setting task-specific
eventpoints:DBG>SET BREAK/INSTRUCTIONDBG>SET TRACE/INSTRUCTION/SILENT DO (EXAMINE KEEP_COUNT)DBG>STEP/CALL/NOSOURCE
DBG> SET BREAK %LINE 11 WHEN (%ACTIVE_TASK=FATHER)16.6.2. Setting Breakpoints on POSIX Threads Tasking Constructs
DBG> SET BREAK worker_routineUnlike Ada tasks, you cannot specify the body of a POSIX Threads task byname but the start routine is similar.
SET BREAK command ensures that you catch
the point at which a particular thread begins execution. For
example:DBG>SET BREAK worker_routine -_DBG>WHEN (%ACTIVE_TASK = %TASK 4)
In Example 16.1, ''Sample C Multithread Program'', this conditional breakpoint will trigger when the second worker thread begins executing its start routine.
Other useful places to set breakpoints are just prior to and immediately after condition waits, joins, and locking of mutexes. You can set such breakpoints by specifying either a line number or the routine name.
16.6.3. Setting Breakpoints on Ada Task Bodies, Entry Calls, and Accept Statements
task-type-identifier$TASK_BODYtask-identifier$TASK_BODYDBG> SET BREAK CHILD$TASK_BODYCHILD$TASK_BODY is a name for the address of the first instruction the task
will execute. It is meaningful to set a breakpoint on an instruction, and hence on
this name. However, you must not name the task object (for example, CHILD) in a
SET BREAK command. The task-object name designates the
address of a data item (the task value). Just as it is erroneous to set a breakpoint
on an integer object, it is erroneous to set a breakpoint on a task object.
Note
Ada task entry calls are not the same as subprogram calls because task
entry calls are queued and may not execute right away. If you use the
STEP command to move execution into a task entry
call, the results might not be what you expect.
8 task body TWO_ACCEPTS is
9 begin
10 for I in 1..2 loop
11 select
12 accept RENDEZVOUS do
13 PUT_LINE("This is the first accept statement");
14 end RENDEZVOUS;
15 or
16 terminate;
17 end select;
18 end loop;
19 accept RENDEZVOUS do
20 PUT_LINE("This is the second accept statement");
21 end RENDEZVOUS;
22 end TWO_ACCEPTS;At the start of an accept statement (line 12 or 19). By setting a breakpoint or tracepoint here, you can monitor when execution reaches the start of the accept statement, where the accepting task might become suspended before a rendezvous actually occurs.
At the start of the body (sequence of statements) of an accept statement (line 13 or 20). By setting a breakpoint or tracepoint here, you can monitor when a rendezvous has started - that is, when the accept statement actually begins execution.
At the end of an accept statement (line 14 or 21). By setting a breakpoint or tracepoint here, you can monitor when the rendezvous has completed, and execution is about to switch back to the caller task.
DBG> SET BREAK %LINE 12, %LINE 13DBG> SET BREAK TWO_ACCEPTS$TASK_BODY.RENDEZVOUSSHOW SYMBOL command to identify
the overloaded names that have been assigned by the debugger. For example:
DBG> SHOW SYMBOL RENDEZVOUS
overloaded symbol TEST.TWO_ACCEPTS$TASK_BODY.RENDEZVOUS
overloaded instance TEST.TWO_ACCEPTS$TASK_BODY.RENDEZVOUS__1
overloaded instance TEST.TWO_ACCEPTS$TASK_BODY.RENDEZVOUS__2Overloaded names have an integer suffix preceded by two underscores. For more information on
overloaded names, see the debugger's online help (type Help
Language_Support Ada).
EXAMINE/SOURCE command. For example:
DBG>EXAMINE/SOURCE TWO_ACCEPTS$TASK_BODY.RENDEZVOUS__1module TEST_ACCEPTS 12: accept RENDEZVOUS do DBG>EXAMINE/SOURCE TWO_ACCEPTS$TASK_BODY.RENDEZVOUS__2module TEST_ACCEPTS 19: accept RENDEZVOUS do
DBG>SET BREAK TWO_ACCEPTS$TASK_BODY.RENDEZVOUS__2 -_DBG>DO (EVALUATE %CALLER_TASK)
DBG>SET BREAK TWO_ACCEPTS$TASK_BODY.RENDEZVOUS__2 -_DBG>WHEN (%CALLER_TASK = %TASK 2)
16.6.4. Monitoring Task Events
SET BREAK/EVENT and SET TRACE/EVENT commands enable
you to set breakpoints and tracepoints that are triggered by task and exception
events. For example, the following command sets tracepoints that trigger whenever
task CHILD or %TASK 2 makes a transition to the RUN
state:DBG> SET TRACE/EVENT=RUN CHILD, %TASK 2When a breakpoint or tracepoint is triggered as a result of an event, the debugger identifies the event and gives additional information.
SET
BREAK/EVENT and SET TRACE/EVENT commands:Table 16.6, ''Generic Low-Level Task Scheduling Events'' lists the generic language-independent events common to all tasks.
Table 16.7, '' POSIX Threads-Specific Events'' lists the events specific to POSIX Threads tasks.
Table 16.8, ''Ada-Specific Events'' lists the events specific to Ada tasks.
|
Event Name |
Description |
|---|---|
|
RUN |
Triggers when a task is about to run. |
|
PREEMPTED |
Triggers when a task is being preempted from the RUN state and its state changes to READY. (See Table 16.3, ''Generic Task States''.) |
|
ACTIVATING |
Triggers when a task is about to begin its execution. |
|
SUSPENDED |
Triggers when a task is about to be suspended. |
|
Event Name |
Description |
|---|---|
|
HANDLED |
Triggers when an exception is about to be handled in some TRY block. |
|
TERMINATED |
Triggers when a task is terminating (including by alert or exception). |
|
EXCEPTION_TERMINATED |
Triggers when a task is terminating because of an exception. |
|
FORCED_TERM |
Triggers when a task is terminating due to an alert operation. |
|
Event Name |
Description |
|---|---|
|
HANDLED |
Triggers when an exception is about to be handled in some Ada exception handler, including an others handler. |
|
HANDLED_OTHERS |
Triggers only when an exception is about to be handled in an others Ada exception handler. |
|
RENDEZVOUS_EXCEPTION |
Triggers when an exception begins to propagate out of a rendezvous. |
|
DEPENDENTS_EXCEPTION |
Triggers when an exception causes a task to wait for dependent tasks in some scope (includes unhandled exceptions, ? which, in turn, include special exceptions internal to the HPE Ada Run-Time Library; for more information, see the HPE Ada documentation). Often immediately precedes a deadlock. |
|
TERMINATED |
Triggers when a task is terminating, whether normally, by an abort statement, or by an exception. |
|
EXCEPTION_TERMINATED |
Triggers when a task is terminating due to an unhandled exception. ? |
|
ABORT_TERMINATED |
Triggers when a task is terminating due to an abort statement. |
In the previous tables, the exception-related events are included for completeness. Only the
task events are discussed in the following paragraphs. For more information about
the exception events, seethe debugger's online help (type Help
Language_Support Ada).
You can abbreviate an event-name keyword to the minimum number of characters that make it unique.
The event-name keywords that you can specify with the SET BREAK/EVENT or
SET TRACE/EVENT command depend on the current event facility,
which is either THREADS or ADA in the case of task events.
The
appropriate event facility is set automatically when the program is brought under
debugger control. The SHOW EVENT_FACILITY command identifies the
facility that is currently set and lists the valid event name keywords for that
facility (including those for the generic events).
/EVENT
qualifier:DBG>SET BREAK/EVENT=PREEMPTEDDBG>GObreak on THREADS event PREEMPTED Task %TASK 4 is getting preempted by %TASK 3 ⋮ DBG>SET BREAK/EVENT=SUSPENDEDDBG>GObreak on THREADS event SUSPENDED Task %TASK 1 is about to be suspended ⋮ DBG>SET BREAK/EVENT=TERMINATEDDBG>GObreak on THREADS event TERMINATED Task %TASK 4 is terminating normally DBG>
EXCEPTION_TERMINATED event breakpoints are predefined for programs that call POSIX Threads routines.
EXCEPTION_TERMINATED and DEPENDENTS_EXCEPTION event breakpoints are predefined for Ada programs or programs that call Ada routines.
Ada examples of the predefined and other types of event breakpoints follow.
Example of EXCEPTION_TERMINATED Event
…
break on ADA event EXCEPTION_TERMINATED
Task %TASK 2 is terminating because of an exception
%ADA-F-EXCCOP, Exception was copied at a "raise;" or "accept"
-ADA-F-EXCEPTION, Exception SOME_ERROR
-ADA-F-EXCRAIPRI, Exception raised prior to PC = 00000B61
DBG>Example of DEPENDENTS_EXCEPTION Event (Ada)
…
break on ADA event DEPENDENTS_EXCEPTION Task
%TASK 2 may await dependent tasks because of this exception:
%ADA-F-EXCCOP, Exception was copied at a "raise;" or "accept"
-ADA-F-EXCEPTION, Exception SOME_ERROR
-ADA-F-EXCRAIPRI, Exception raised prior to PC = 00000B61
DBG>Example of RENDEZVOUS_EXCEPTION Event (Ada)
…
break on ADA event RENDEZVOUS_EXCEPTION
Exception is propagating out of a rendezvous in task %TASK 2
%ADA-F-CONSTRAINT_ERRO, CONSTRAINT_ERROR
-ADA-I-EXCRAIPRI, Exception raised prior to PC = 00000BA6
DBG>To cancel breakpoints (or tracepoints) set with the /EVENT qualifier, use
the CANCEL BREAK/EVENT (or CANCEL TRACE/EVENT)
command. Specify the event qualifier and optional task expression in the
CANCEL command exactly as you did with the
SET command, excluding any WHEN or
DO clauses.
SET BREAK/EVENT=ACTIVATING SET BREAK/EVENT=HANDLED DO (SHOW CALLS) SET BREAK/EVENT=ABORT_TERMINATED DO (SHOW CALLS) SET BREAK/EVENT=EXCEPTION_TERM DO (SHOW CALLS) SET BREAK/EVENT=TERMINATED
16.7. Additional Task-Debugging Topics
Deadlock
Automatic stack checking
Using Ctrl/Y
16.7.1. Debugging Programs with Deadlock Conditions
A deadlock is an error condition in which each task in a group of tasks is suspended and no task in the group can resume execution until some other task in the group executes. Deadlock is a typical error in tasking programs (in much the same way that infinite loops are typical errors in programs that use WHILE statements).
A deadlock is easy to detect: it causes your program to appear to suspend, or hang, in mid execution. When deadlock occurs in a program that is running under debugger control, press Ctrl/C to interrupt the deadlock and display the debugger prompt.
In general, the SHOW TASK/ALL command (see Section 16.4, ''Displaying Information About Tasks'') or the SHOW
TASK/STATE=SUSPENDED command is useful because it shows which tasks
are suspended in your program and why. The command SET
TASK/VISIBLE%NEXT_TASK is particularly useful when debugging in screen
mode. It enables you to cycle through all tasks and display the code that each task
is executing, including the code in which execution is stopped.
The SHOW TASK/FULL command gives detailed task state
information, including information about rendezvous, entry calls, and entry index
values. The SET BREAK/EVENT or SET TRACE/EVENT
command (see Section 16.6.4, ''Monitoring Task Events'')enables you to set breakpoints or
tracepoints at or near locations that might lead to deadlock. The SET
TASK/PRIORITY and SET TASK/RESTORE commands enable
you to see if a low-priority task that never runs is causing the deadlock.
|
Deadlock Condition |
Debugger Commands |
|---|---|
|
Self-calling deadlock (a task calls one of its own entries) |
SHOW TASK/ALL SHOW TASK/STATE=SUSPENDED SHOW TASK/FULL |
|
Circular-calling deadlock (a task calls another task, which calls the first task) |
SHOW TASK/ALL SHOW TASK/STATE=SUSPENDED SHOW TASK/FULL |
|
Dynamic-calling deadlock (a circular series of entry calls exists, and at least one of the calls is a timed or conditional entry call in a loop) |
SHOW TASK/ALL SHOW TASK/STATE=SUSPENDED SHOW TASK/FULL |
|
Exception-induced deadlock (an exception prevents a task from answering one of its entry calls, or the propagation of an exception must wait for dependent tasks) |
SHOW TASK/ALL SHOW TASK/STATE=SUSPENDED SHOW TASK/FULL SET BREAK/EVENT=DEPENDENTS_EXCEPTION (for Ada programs) |
|
Deadlock because of incorrect run-time calculations for entry indexes, when conditions, and delay statements within select statements |
SHOW TASK/ALL SHOW TASK/STATE=SUSPENDED SHOW TASK/FULL EXAMINE |
|
Deadlock due to entries being called in the wrong order |
SHOW TASK/ALL SHOW TASK/STATE=SUSPENDED SHOW TASK/FULL |
|
Deadlock due to busy-waiting on a variable used as a flag that is to be set by a lower priority task, and the lower priority task never runs because a higher priority task is always ready to execute |
SHOW TASK/ALL SHOW TASK/STATE=SUSPENDED SHOW TASK/FULL SET TASK/PRIORITY SET TASK/RESTORE |
16.7.2. Automatic Stack Checking in the Debugger
A stack check is done for the active task after a
STEPcommand executes or a breakpoint triggers (see Section 16.6.1, ''Setting Task-Specific and Task-Independent Debugger Eventpoints''). (This check is not done if you have used the/SILENTqualifier with theSTEPorSET BREAKPOINTcommand.)A stack check is done for each task whose state is displayed in a
SHOW TASKcommand. Thus, aSHOW TASK/ALLcommand automatically causes the stacks of all tasks to be checked.
warning: %TASK 2 has used up over 90% of its stack SP: 0011194C Stack top at: 00111200 Remaining bytes: 1868 error: %TASK 2 has overflowed its stack SP: 0010E93C Stack top at: 00111200 Remaining bytes: -10436 error: %TASK 2 has underflowed its stack SP: 7FF363A4 Stack base at: 001189FC Stack top at: 00111200
One of the unpredictable events that can happen after a stack overflows is that the stack can then underflow. For example, if a task stack overflows and the stack pointer remains in the top guard area, the operating system will attempt to signal an ACCVIO condition. However, because the top guard area is not a writable area of the stack, the operating system cannot write the signal arguments for the ACCVIO. When this happens, the operating system cuts back the stack: it causes the frame pointer and stack pointer to point to the base of the main program stack area, writes the signal arguments, and then modifies the program counter to force an image exit.
If a time-slice AST or other AST occurs at this instant, execution can resume in a different
task, and for a while, the program may continue to execute, although not normally
(the task whose stack overflowed may use - and overwrite - the main program stack).
The debugger stack checks help you to detect this situation. If you step into at ask
whose stack has been cut back by the operating system, or if you use the
SHOW TASK/ALL command at that time, the debugger issues its
stack underflow message.
16.7.3. Using Ctrl/Y When Debugging Ada Tasks
Pressing Ctrl/C is the recommended method of interrupting program execution or a debugger command during a debugging session. This returns control to the debugger; pressing Ctrl/Y returns control to DCL level.
DEBUG command. In such
cases, you should insert the following two lines in the source code at the beginning
of your main program to name the HPE Ada predefined package CONTROL_C_INTERCEPTION:with CONTROL_C_INTERCEPTION; pragma ELABORATE(CONTROL_C_INTERCEPTION);
For information on this package, see the HPE Ada documentation.
Part VI. Debugger Command Dictionary
Chapter 17. Debugger Command Dictionary
Overview
the section called “Debugger Command Format” explains how to enter debugger commands.
the section called “Commands Disabled in the Debugger's VSI DECwindows Motif for OpenVMS User Interface” lists commands that are disabled in the command/message view of the debugger's VSI DECwindows Motif for OpenVMS user interface.
the section called “Debugger Diagnostic Messages” gives general information about debugger diagnostic messages.
the section called “Debugger Command Dictionary” contains detailed reference information about the debugger commands.
Debugger Command Format
You can enter debugger commands interactively at the keyboard or store them within a command procedure to be executed later with the execute procedure (@) command.
General format for debugger commands
Rules for entering commands interactively at the keyboard
Rules for entering commands in debugger command procedures
General Format
A command string is the complete specification of a debugger command. Although you can continue a command on more than one line, the term command string is used to define an entire command that is passed to the debugger.
A debugger command string consists of a verb and, possibly, parameters and qualifiers.
DBG> GO DBG> SHOW IMAGE
/SCROLL and
/OUTPUT are qualifiers.
DBG> SET WATCH COUNT DBG> EXAMINE I, J, K DBG> SELECT/SCROLL/OUTPUT OUT2 DBG> @PROG4.COM
Some commands accept optional WHEN or DO clauses. DO clauses are also used in some screen display definitions.
A WHEN clause consists of the keyword WHEN followed by a conditional expression (within parentheses) that evaluates to true or false in the current language. A DO clause consists of the keyword DO followed by one or more command strings (within parentheses) that are to be executed in the order that they are listed. You must separate multiple command strings with semicolons (;). These points are illustrated in the next example.
SHOW CALLS and EXAMINE I, K, in the order indicated.
DBG> SET BREAK SWAP WHEN (J = 4) DO (SHOW CALLS; EXAMINE I, K)
The debugger checks the syntax of the commands in a DO clause when it executes the DO clause. You can nest commands within DO clauses.
Entering Commands at the Keyboard
When entering a debugger command interactively at the keyboard, you can abbreviate a
keyword (verb, qualifier, parameter) to as few characters as are needed to make it unique within
the set of all debugger keywords. However, some commonly used commands (for example,
EXAMINE, DEPOSIT, GO,
STEP) can be abbreviated to their first characters. Also, in some cases, the
debugger interprets non unique abbreviations correctly on the basis of context.
Pressing the Return key terminates the current line, causing the debugger to process it. To
continue a long command string on another line, type a hyphen (-) before pressing
Return. As a result, the debugger prompt is prefixed with an underscore character
(_DBG>), indicating that the command string is still being accepted.
You can enter more than one command string on one line by separating command strings with semicolons (;).
To enter a comment (explanatory text recorded in a debugger log file but otherwise ignored by the debugger), precede the comment text with an exclamation point (!). If the comment wraps to another line, start that line with an exclamation point.
The command line editing functions that are available at the DCL prompt
($) are also available at the debugger prompt (DBG >),
including command recall with the up arrow and down arrow keys. For example, pressing the left
arrow and right arrow keys moves the cursor one character to the left and right, respectively;
pressing Ctrl/H or Ctrl/E
moves the cursor to the start or end of the line, respectively; pressing
Ctrl/U deletes all the characters to the left of the cursor,
and so on.
To interrupt a command that is being processed by the debugger, press Ctrl/C. See the Ctrl/C command.
Entering Commands in Command Procedures
To maximize legibility, it is best not to abbreviate command keywords in a command
procedure. Do not abbreviate command keywords to less than four significant characters (not
counting the negation /NO …), to avoid potential conflicts in future
releases.
Start a debugger command line at the left margin. (Do not start a command line with a dollar sign ($) as you do when writing a DCL command procedure.)
The beginning of a new line ends the previous command line (the end-of-file character also ends the previous command line). To continue a command string on another line, type a hyphen (-) before starting the new line.
You can enter more than one command string on one line by separating command strings with semicolons (;).
To enter a comment (explanatory text that does not affect the execution of the command procedure), precede the comment text with an exclamation point (!). If the comment wraps to another line, start that line with an exclamation point.
Commands Disabled in the Debugger's VSI DECwindows Motif for OpenVMS User Interface
|
ATTACH |
SELECT |
|
CANCEL MODE |
(SET, SHOW) ABORT_KEY |
|
CANCEL WINDOW |
(SET, SHOW) KEY |
|
DEFINE/KEY |
(SET, SHOW) MARGINS |
|
DELETE/KEY |
SET MODE [NO]KEYPAD |
|
DISPLAY |
SET MODE [NO]SCREEN |
|
EXAMINE/SOURCE |
SET MODE [NO]SCROLL |
|
EXPAND |
SET OUTPUT [NO]TERMINAL |
|
EXTRACT |
(SET, SHOW) TERMINAL |
|
HELP ? |
(SET, SHOW) WINDOW |
|
MOVE |
(SHOW, CANCEL) DISPLAY |
|
SAVE |
SHOW SELECT |
|
SCROLL |
SPAWN |
The debugger issues an error message if you try to enter any of these disabled commands at the command prompt or when the debugger executes a command procedure containing any of these commands.
The MONITOR command works only with the VSI DECwindows Motif for OpenVMS user interface
(because the command uses the Monitor View).
Debugger Diagnostic Messages
%DEBUG-W-NOSYMBOL, symbol 'X' is not in the symbol table
| The facility name (DEBUG). |
| The severity level (W, in this example). |
| The message identifier (NOSYMBOL, in this example). The message identifier is an abbreviation of the message text. |
| The message text. |
The identifier enables you to find the explanation for a diagnostic message from the debugger's online help (and the action you need to take, if any).
HELP MESSAGES message-identifier- S (success)
- I (informational)
- W (warning)
- E (error)
- F (fatal, or severe error)
Success and informational messages inform you that the debugger has performed your request.
Warning messages indicate that the debugger might have performed some, but not all, of your request and that you should verify the result.
Error messages indicate that the debugger could not perform your request, but that the state of the debugging session was not changed. The only exceptions are if the message identifier was DBGERR or INTERR. These identifiers signify an internal debugger error, and you should contact your HP support representative.
Fatal messages indicate that the debugger could not perform your request and that the debugging session is in an indeterminate state from which you cannot recover reliably. Typically, the error ends the debugging session.
Debugger Command Dictionary
The Debugger Command Dictionary describes each debugger command in detail. Commands are listed alphabetically. The following information is provided for each command: command description, format, parameters, qualifiers, and one or more examples. See the preface of this manual for documentation conventions.
@ (Execute Procedure)
@ (Execute Procedure) — Executes a debugger command procedure.
Synopsis
@ file-spec [parameter […]]Parameters
Specifies the command procedure to be executed. For any part of the full file specification
not provided, the debugger uses the file specification established with the last SET
ATSIGN command, if any. If the missing part of the file specification was not
established by a SET ATSIGN command, the debugger assumes
SYS$DISK:[]DEBUG.COM as the default file specification. You can specify a
logical name.
Specifies a parameter that is passed to the command procedure. The parameter can be an
address expression, a value expression in the current language, or a debugger command; the
command must be enclosed within quotation marks ("). Unlike with DCL, you must
separate parameters by commas. Also, you can pass as many parameters as there are formal
parameter declarations within the command procedure. For more information about passing
parameters to command procedures, see the DECLARE command.
Description
A debugger command procedure can contain any debugger commands, including another execute
procedure (@) command. The debugger executes commands from the command
procedure until it reaches an EXIT or QUIT command or
reaches the end of the command procedure. At that point, the debugger returns control to the
command stream that invoked the command procedure. A command stream can be the terminal, an
outer (containing) command procedure, a DO clause in a command such as
SET BREAK, or a DO clause in a screen display
definition.
By default, commands read from a command procedure are not echoed. If you enter the
SET OUTPUT VERIFY command, all commands read from a command procedure are
echoed on the current output device, as specified by DBG$OUTPUT (the default
output device is SYS$OUTPUT).
For information about passing parameters to command procedures, seethe
DECLARE command.
- DECLARE
- (SET, SHOW ATSIGN
- SET OUTPUT [NO]VERIFY
- SHOW OUTPUT
Example
DBG> SET ATSIGN USER:[JONES.DEBUG].DBG
DBG> SET OUTPUT VERIFY
DBG> @CHECKOUT
%DEBUG-I-VERIFYICF, entering command procedure CHECKOUT
SET MODULE/ALL
SET BREAK SUB1
GO
break at routine PROG5\SUB2
EXAMINE XPROG5\SUB2\X: 376
…
%DEBUG-I-VERIFYICF, exiting command procedure MAIN
DBG>In this example, the SET ATSIGN command establishes that debugger
command procedures are, by default, in USER:[JONES.DEBUG] and have a file
type of .DBG. The @CHECKOUT command executes the command
procedure USER:[JONES.DEBUG]CHECKOUT.DBG. The debugger echoes commands in
the command because of the SET OUTPUT VERIFY command.
ACTIVATE BREAK
ACTIVATE BREAK — Activates a breakpoint that you have previously set and then deactivated.
Synopsis
ACTIVATE BREAK [address-expression[, …]]Parameters
Specifies a breakpoint to be activated. Do not use the asterisk (*) wild
card character. Instead, use the /ALL qualifier. Do not specify an address
expression when using any qualifiers except /EVENT,
/PREDEFINED, or /USER.
Qualifiers
- /ACTIVATING
Activates a breakpoint established by a previous
SET BREAK/ACTIVATINGcommand.- /ALL
By default, activates all user-defined breakpoints. When used with
/PREDEFINED, activates all predefined breakpoints but no user-defined breakpoints. To activate all breakpoints, use/ALL/USER/PREDEFINED.- /BRANCH
Activates a breakpoint established by a previous
SET BREAK/BRANCHcommand.- /CALL
Activates a breakpoint established by a previous
SET BREAK/CALLcommand.- /EVENT=event-name
Activates a breakpoint established by a previous
SET BREAK/EVENT=command. Specify the event name (and address expression, if any) exactly as specified with theevent-nameSET BREAK/EVENTcommand.To identify the current event facility and the associated event names, use the
SHOW EVENT_FACILITYcommand.- /EXCEPTION
Activates a breakpoint established by a previous
SET BREAK/EXCEPTIONcommand.- /HANDLER
Activates a breakpoint established by a previous
SET BREAK/HANDLERcommand.- /INSTRUCTION
Activates a breakpoint established by a previous
SET BREAK/INSTRUCTIONcommand.- /LINE
Activates a breakpoint established by a previous
SET BREAK/LINEcommand. Do not specify an address expression with this qualifier.- /PREDEFINED
Activates a specified predefined breakpoint without affecting any user-defined breakpoints. When used with
/ALL, activates all predefined breakpoints.- /SYSEMULATE
(Alpha only) Activates a breakpoint established by a previous
SET BREAK/SYSEMULATEcommand.- /TERMINATING
Activates a breakpoint established by a previous
SET BREAK/TERMINATINGcommand.- /UNALIGNED_DATA
(Integrity servers and Alpha only) Activates a breakpoint established by a previous
SET BREAK/UNALIGNED_DATAcommand, or reactivates a breakpoint previously disabled by aDEACTIVATE BREAK/UNALIGNED_DATAcommand.- /USER
Activates a specified user-defined breakpoint without affecting any predefined breakpoints. To activate all user-defined breakpoints, use the
/ALLqualifier.
Description
User-defined breakpoints are activated when you set them with the SET
BREAK command. Predefined breakpoints are activated by default. Use the
ACTIVATE BREAK command to activate one or more breakpoints that you
deactivated with DEACTIVATE BREAK.
Activating and deactivating breakpoints enables you to run and rerun your program with or
without breakpoints without having to cancel and then reset them. By default, the
RERUN command saves the current state of all breakpoints (activated or deactivated).
You can activate and deactivate user-defined breakpoints or predefined breakpoints or both.
To check if a breakpoint is activated, use the SHOW BREAK command.
-
CANCEL ALL -
RERUN - (
SET,SHOW,CANCEL,DEACTIVATE)BREAK - (
SET,SHOW)EVENT_FACILITY
Examples
DBG> ACTIVATE BREAK MAIN\LOOP+10
This command activates the user-defined breakpoint set at the address expression
MAIN \LOOP+10.DBG> ACTIVATE BREAK/ALL
This command activates all user-defined breakpoints.
DBG> ACTIVATE BREAK/ALL/USER/PREDEFINED
This command activates all breakpoints, both user-defined and predefined.
ACTIVATE TRACE
ACTIVATE TRACE — Activates a tracepoint that you have previously set and then deactivated.
Synopsis
ACTIVATE TRACE [address-expression[, …]]Parameters
Specifies a tracepoint to be activated. Do not use the asterisk (*)
wildcard character. Instead, use the /ALL qualifier. Do not specify an
address expression when using any qualifiers except /EVENT,
/PREDEFINED, or /USER.
Qualifiers
- /ACTIVATING
Activates a tracepoint established with a previous
SET TRACE/ACTIVATINGcommand.- /ALL
By default, activates all user-defined tracepoints. When used with
/PREDEFINED, activates all predefined tracepoints but no user-defined tracepoints. To activate all tracepoints, use/ALL/USER/PREDEFINED.- /BRANCH
Activates a tracepoint established with a previous
SET TRACE/BRANCHcommand.- /CALL
Activates a tracepoint established with a previous
SET TRACE/CALLcommand.- /EVENT=event-name
Activates a tracepoint established with a previous
SET TRACE/EVENT=command. Specify the event name (and address expression, if any) exactly as specified with theevent-nameSET TRACE/EVENTcommand.To identify the current event facility and the associated event names, use the
SHOW EVENT_FACILITYcommand.- /EXCEPTION
Activates a tracepoint established with a previous
SET TRACE/EXCEPTIONcommand.- /INSTRUCTION
Activates a tracepoint established with a previous
SET TRACE/INSTRUCTIONcommand.- /LINE
Activates a tracepoint established with a previous
SET TRACE/LINEcommand.- /PREDEFINED
Activates a specified predefined tracepoint without affecting any user-defined tracepoints. When used with
/ALL, activates all predefined tracepoints.- /TERMINATING
Activates a tracepoint established with a previous
SET TRACE/TERMINATINGcommand.- /USER
Activates a specified user-defined tracepoint without affecting any predefined tracepoints. To activate all user-defined tracepoints, use the
/ALLqualifier.
Description
User-defined tracepoints are activated when you set them with the SET
TRACE command. Predefined tracepoints are activated by default. Use the
ACTIVATE TRACE command to activate one or more tracepoints that you
deactivated with DEACTIVATE TRACE.
Activating and deactivating tracepoints enables you to run and rerun your program with or
without tracepoints without having to cancel and then reset them. By default, the
RERUN command saves the current state of all tracepoints (activated or
deactivated).
You can activate and deactivate user-defined tracepoints or predefined tracepoints or both.
To check if a tracepoint is activated, use the SHOW TRACE command.
-
CANCEL ALL -
RERUN - (
SET,SHOW)EVENT_FACILITY - (
SET,SHOW,CANCEL,DEACTIVATE)TRACE
Examples
DBG> ACTIVATE TRACE MAIN\LOOP+10
This command activates the user-defined tracepoint at the location MAIN \LOOP+10.
DBG> ACTIVATE TRACE/ALL
This command activates all user-defined tracepoints.
ACTIVATE WATCH
ACTIVATE WATCH — Activates a watchpoint that you have previously set and then deactivated.
Synopsis
ACTIVATE WATCH [address-expression[, …]]Parameters
Specifies a watchpoint to be activated. With high-level languages, this is typically the
name of a variable. Do not use the asterisk (*) wildcard character. Instead,
use the /ALL qualifier. Do not specify an address expression with
/ALL.
Description
Watchpoints are activated when you set them with the SET WATCH command.
Use the ACTIVATE WATCH command to activate one or more watchpoints that you
deactivated with DEACTIVATE WATCH.
Activating and deactivating watchpoints enables you to run and rerun your program with or without watchpoints without having to cancel and then reset them.
By default, the RERUN command saves the current state of all
static watchpoints (activated or deactivated). The state of a particular nonstatic watchpoint
might or might not be saved depending on the scope of the variable being watched relative to the
main program unit (where execution restarts).
To check if a watchpoint is activated, use the SHOW WATCH
command.
-
CANCEL ALL -
RERUN - (
SET,SHOW,CANCEL,DEACTIVATE)WATCH
Examples
DBG> ACTIVATE WATCH SUB2\TOTAL
This command activates the watchpoint at variable TOTAL in module SUB2.
DBG> ACTIVATE WATCH/ALL
This command activates all watchpoints you have set and deactivated.
ANALYZE/CRASH_DUMP
ANALYZE/CRASH_DUMP — Opens a system dump for analysis by the System Dump Debugger (kept debugger
only).
Synopsis
ANALYZE/CRASH_DUMP []Description
For OpenVMS Integrity servers and Alpha systems, invokes the System Dump Debugger (SDD) to analyze a system dump.
SDD is similar in concept to the System Code Debugger (SCD). While SCD allows connection to a running system, with control of the system's execution and the examination and modification of variables, SDD allows analysis of memory as recorded in a system dump.
The build system, where the image that causes the system crash has been built
The test system, where the image is executed and the system crash occurs
In common with SCD, the OpenVMS debugger user interface allows you to specify variable names, routine names, and soon, precisely as they appear in your source code. Also, SDD can display the source code where the software was executing at the time of the system crash.
SDD recognizes the syntax, data typing, operators, expressions, scoping rules, and other constructs of a given language. If your code or driver is written in more than one language, you can change the debugging context from one language to another during a debugging session.
Build the system image or device driver that is causing the system crash.
Boot a system, including the system image or device driver, and perform the necessary steps to cause the system crash.
Reboot the system and save the dump file.
Invoke SDD, which is integrated with the OpenVMS debugger.
For more information about using the SDD, including a sample SDD session, see the VSI OpenVMS System Analysis Tools Manual.
-
ANALYZE/PROCESS_DUMP -
CONNECT %NODE -
SDA
Example
DBG> ANALYZE/CRASH_DUMP DBG>
Invokes SDD from within the kept debugger.
ANALYZE/PROCESS_DUMP
ANALYZE/PROCESS_DUMP — Opens a process dump for analysis with the System Code Debugger (kept debugger
only)
Synopsis
ANALYZE/PROCESS_DUMP [dumpfile]Parameters
The name of the process dump file to be analyzed. The file type must be
.DMP.
Qualifiers
- /IMAGE_PATH=directory-spec
Specifies the search path for the debugger to find the files that contains the debugger symbol tables (DSTs). The files must be of type
.DSFor.EXE, with the same name as the image names in the dump file. For example, if image name foo.exe is in the dump file, then the debugger searches forfoo.dsforfoo.exe.
Description
(Kept debugger only.) Opens a process dump for analysis with the System Code Debugger
(SCD). The qualifier /PROCESS_DUMP is required and distinguishes this command
from the one that invokes the System Dump Debugger (SDD),
ANALYZE/CRASH_DUMP.
The qualifier /IMAGE_PATH= directory-spec is
optional, and specifies the search path the debugger is to use to find the debugger symbol table
(DST) files. The debugger builds an image list from the saved process image list. When you set
an image (the main image is automatically set), the debugger attempts to open that image in
order to find the DSTs.
If you include the /IMAGE_PATH=
qualifier, the debugger searches for the
directory-spec.DST file in the specified directory. The debugger first tries to
translate directory-spec as the logical name of a directory search
list. If that fails, the debugger interprets directory-spec as a
directory specification, and searches that directory for matching .DSF or
.EXE files. A .DSF file takes precedence over an
.EXE file. The name of the .DSF or
.EXE file must match the image name.
If you do not include the /IMAGE_PATH=
qualifier, the debugger looks for the DST
file first in the directory that contains the dump file. If that fails, the debugger next
searches directory SYS$SHARE and then directory SYS$MESSAGE. If the debugger fails to find a DST
file for the image, symbolic information available to the debugger is limited to global and
universal symbol names.directory-spec
The debugger checks for link date-time mismatches between the dump file image and the DST file and issues a warning if one is discovered.
The parameter dumpfile is the name of the process dump file to
be analyzed. Note that the process dump file type must be .DMP and the DST
file type must be either .DSF or .EXE.
For more information about using SCD, see the VSI OpenVMS System Analysis Tools Manual.
-
ANALYZE/CRASH_DUMP -
CONNECT %NODE -
SDA
Example
DBG> ANALYZE/PROCESS/IMAGE_DUMP=my_disk$:[my_dir]
my_disk$:[my_dir]wecrash.dmp
%SYSTEM-F-IMGDMP, dynamic image dump signal at PC=001C0FA0B280099C,
PS=001C003C
break on unhandled exception preceding WECRASH\
th_run
\%LINE 26412 in THREAD 8
26412: if (verify) {
DBG> SET RADIX HEXADECIMAL; EXAMINE PC
WECRASH\th_run\%PC: 0000000000030244DBG>ATTACH
ATTACH — Passes control of your terminal from the current process to another process.
Synopsis
ATTACH process-name Note
This command is not available in the VSI DECwindows Motif for OpenVMS user interface to the debugger.
Parameters
Specifies the process to which your terminal is to be attached. The process must already exist before you try to attach to it. If the process name contains non alphanumeric or space characters, you must enclose it in quotation marks (").
Description
The ATTACH command enables you to go back and forth between a debugging
session and your command interpreter, or between two debugging sessions. To do so, you must
first use the SPAWN command to create a subprocess. You can then attach to it
whenever you want. To return to your original process with minimal system overhead, use another
ATTACH command.
SPAWN
Examples
DBG> SPAWN $ ATTACH JONES %DEBUG-I-RETURNED, control returned to process JONES DBG> ATTACH JONES_1 $
In this example, the series of commands creates a subprocess named JONES_1 from the debugger (currently running in the process JONES) and then attaches to that subprocess.
DBG> ATTACH "Alpha One" $
This example illustrates using quotation marks to enclose a process name that contains a space character.
CALL
CALL — Calls a routine that was linked with your program.
Synopsis
CALL routine-name [(argument[, …])] Parameters
Specifies the name or the memory address of the routine to be called.
Qualifiers
- /AST (default)
/NOAST Controls whether the delivery of asynchronous system traps (ASTs) is enabled or disabled during the execution of the called routine. The
/ASTqualifier enables the delivery of ASTs in the called routine. The/NOASTqualifier disables the delivery of ASTs in the called routine. If you do not specify/ASTor/NOASTwith theCALLcommand, the delivery of ASTs is enabled unless you have previously entered theDISABLE ASTcommand.- /SAVE_VECTOR_STATE
/NOSAVE_VECTOR_STATE (default) Applies to VAX vectorized programs. Controls whether the current state of the vector processor is saved and then restored when a routine is called with the
CALLcommand.The state of the vector processor comprises the following:The values of the vector registers (V0 to V15) and the vector control registers (VCR, VLR, and VMR)
Any vector exception (an exception caused by the execution of a vector instruction) that might be pending delivery
When you use theCALLcommand to execute a routine, execution of the routine might change the state of the vector processor as follows:By changing the values of vector registers or vector control registers
By causing a vector exception
By causing the delivery of a vector exception that was pending when the
CALLcommand was issued
The/SAVE_VECTOR_STATEqualifier specifies that after the called routine has completed execution, the debugger restores the state of the vector processor that exists before theCALLcommand is issued. This ensures that, after the called routine has completed execution:Any vector exception that was pending delivery before the
CALLcommand was issued is still pending deliveryNo vector exception that was triggered during the routine call is still pending delivery
The values of the vector registers are identical to their values before the
CALLcommand was issued
The
/NOSAVE_VECTOR_STATEqualifier (which is the default) specifies that the state of the vector processor that exists before theCALLcommand is issued is not restored by the debugger after the called routine has completed execution. In this case, the state of the vector processor after the routine call depends on the effect (if any) of the called routine.The
/[NO]SAVE_VECTOR_STATEqualifiers have no effect on the general registers. The values of these registers are always saved and restored when you execute a routine with theCALLcommand.
Description
The CALL command is one of the four debugger commands that can be used
to execute your program (the others are GO, STEP, and
EXIT). The CALL command enables you to execute a routine
independently of the normal execution of your program. The CALL command
executes a routine whether or not your program actually includes a call to that routine, as long
as the routine was linked with your program.
CALL command, the debugger takes the following actions.
For more information, see the qualifier descriptions.Saves the current values of the general registers.
Constructs an argument list.
Executes a call to the routine specified in the command and passes any arguments.
Executes the routine.
Displays the value returned by the routine in the return status register. By convention, after a called routine has executed, register R0 contains the function return value (if the routine is a function) or the procedure completion status (if the routine is a procedure that returns a status value). If a called procedure does not return a status value or function value, the value in R0 might be meaningless, and the "value returned" message can be ignored.
Restores the values of the general registers to the values they had just before the
CALLcommand was executed.Issues the prompt.
The debugger assumes that the called routine conforms to the procedure calling standard
(see the OpenVMS Calling Standard). However, the debugger does not know
about all the argument-passing mechanisms for all supported languages. Therefore, you might need
to specify how to pass parameters, for example, use CALL SUB1(%VAL X) rather
than CALL SUB1(X). For complete information about how arguments are passed to
routines, see your language documentation.
CALL command by default now
passes arguments by value rather than by reference. In addition, you can now pass the following
arguments without using a passing mechanism lexical (such as %REF or %VAL):Routine references
Quoted strings (treated as %REF strings)
Structures, records, and objects
Floating-point parameters by value in F_, D_, G_, S_, and T_floating format by dereferencing a variable of that type.
If the routine contains parameters that are not read-only, the values assigned to parameters may not be visible, and access to values is unreliable. This is because the debugger adjusts parameter values in an internal argument list, not the program argument list. To examine changing values, consider using static variables instead of parameters.
The CALL command converts all floating-point literals to F_floating
format for Alpha systems and T_floating format for Integrity servers.
On Alpha, passing a floating-point literal in a format other than F_floating is not supported, as shown in the example below.
A common debugging technique at an exception breakpoint (resulting from a SET
BREAK/EXCEPTION or STEP/EXCEPTION command) is to call a dump
routine with the CALL command. When you enter the CALL
command at an exception breakpoint, any breakpoints, tracepoints, or watchpoints that were
previously set within the called routine are temporarily disabled so that the debugger does not
lose the exception context. However, such eventpoints are active if you enter the
CALL command at a location other than an exception breakpoint.
When an exception breakpoint is triggered, execution is suspended before any
application-declared condition handler is invoked. At an exception breakpoint, entering a
GO or STEP command after executing a routine with the
CALL command causes the debugger to resignal the exception (see the
GO and STEP commands).
On Alpha, you cannot debug routines that are activated before the
routine activated by a CALL command. For example, your program is stopped in
routine MAIN, and you set a breakpoint in routine SORT.
You issue the debugger command CALL SORT. While debugging routine
SORT, you cannot debug routine MAIN. You must first
return from the call to routine SORT.
If you are debugging a multiprocess program, the CALL command is
executed in the context of the current process set. In addition, when debugging a multiprocess
program, the way in which execution continues in your process depends on whether you entered a
SET MODE [NO]INTERRUPT command or a SET MODE [NO]WAIT
command. By default (SET MODE NOINTERRUPT), when one process stops, the
debugger takes no action with regard to the other processes. Also by default (SET MODE
WAIT), the debugger waits until all processes in the current process set have stopped
before prompting for a new command. See Chapter 15, "Debugging Multiprocess Programs" for more
information.
GOEXITSET PROCESSSET MODE [NO]INTERRUPTSTEP
Examples
DBG> CALL SUB1(X) value returned is 19 DBG>
This command calls routine SUB1, with parameter X (by default, the address of X is passed). In this case, the routine returns the value 19.
DBG> CALL SUB(%REF 1) value returned is 1 DBG>
This command passes a pointer to a memory location containing the numeric literal 1, into the routine SUB.
DBG> SET MODULE SHARE$LIBRTL DBG> CALL LIB$SHOW_VM 1785 calls to LIB$GET_VM, 284 calls to LIB$FREE_VM, 122216 bytes still allocated, value returned is 00000001 DBG>
This example calls Run-Time Library routine LIB$SHOW_VM (in shareable image LIBRTL) to display memory statistics. The
SET MODULEcommand makes the universal symbols (routine names) in LIBRTL visible in the main image. See also theSHOW MODULE/SHAREcommand.DBG> CALL testsub (%val 11.11, %val 22.22, %val 33.33)
This example passes floating-point parameters by value, to a C subroutine with the function prototype
void testsub (float, float, float). The floating-point parameters are passed in F_floating format.SUBROUTINE CHECK_TEMP(TEMPERATURE, ERROR_MESSAGE) REAL TOLERANCE /4.7/ REAL TARGET_TEMP /92.0/ CHARACTER*(*) ERROR_MESSAGE IF (TEMPERATURE .GT. (TARGET_TEMP + TOLERANCE)) THEN TYPE *, 'Input temperature out of range:', TEMPERATURE TYPE *, ERROR_MESSAGE ELSE TYPE *, 'Input temperature in range:', TEMPERATURE END IF RETURN END DBG> CALL CHECK_TEMP(%REF 100.0, %DESCR 'TOLERANCE-CHECK 1 FAILED') Input temperature out of range: 100.0000 TOLERANCE-CHECK 1 FAILED value returned is 0 DBG> CALL CHECK_TEMP(%REF 95.2, %DESCR 'TOLERANCE-CHECK 2 FAILED') Input temperature in range: 95.2000 value returned is 0 DBG>This Fortran routine (CHECK_TEMP) accepts two parameters,
TEMPERATURE(a real number) andERROR_MESSAGE(a string). Depending on the value ofTEMPERATURE, the routine prints different output. EachCALLcommand passes a temperature value (by reference) and an error message (by descriptor). Because this routine does not have a formal return value, the value returned is undefined, in this case, 0.
CANCEL ALL
CANCEL ALL — Cancels all breakpoints, tracepoints, and watchpoints. Restores the scope and type to
their default values. Restores the line, symbolic, and G_floating modes established with the
SET MODE command to their default values.
Synopsis
CANCEL ALL Qualifiers
Description
CANCEL ALL command does the following: Cancels all user-defined eventpoints (those created with the commands
SET BREAK,SET TRACE, andSET WATCH). This is equivalent to entering the commandsCANCEL BREAK/ALL,CANCEL TRACE/ALL, andCANCEL WATCH/ALL. Depending on the type of program (for example Ada, multiprocess), certain predefined breakpoints or tracepoints might be set automatically when you start the debugger. To cancel all predefined but no user-defined eventpoints, useCANCEL ALL/PREDEFINED. To cancel all predefined and user-defined eventpoints, useCANCEL ALL/PREDEFINED/USER.Restores the scope search list to its default value(0, 1, 2, …,
n). This is equivalent to entering theCANCEL SCOPEcommand.Restores the data type for memory locations that are associated with a compiler-generated type to the associated type. Restores the type for locations that are not associated with a compiler-generated type to "longword integer". This is equivalent to entering the
CANCEL TYPE/OVERRIDEandSET TYPE LONGWORDcommands.- Restores the line, symbolic, and G_floating modes established with the
SET MODEcommand to their default values. This is equivalent to entering the following command:DBG> SET MODE LINE, SYMBOLIC, NOG_FLOAT
The CANCEL ALL command does not affect the current language setting or
modules included in the run-time symbol table.
- (
CANCEL,DEACTIVATE)BREAK -
CANCEL SCOPE - (
CANCEL,DEACTIVATE)TRACE -
CANCEL TYPE/OVERRIDE - (
CANCEL,DEACTIVATE)WATCH - (
SET,CANCEL)MODE -
SET TYPE
Examples
DBG> CANCEL ALL
This command cancels all user-defined breakpoints and tracepoints and all watchpoints, and restores scopes, types, and some modes to their default values. In this example, there are no predefined breakpoints or tracepoints.
DBG> CANCEL ALL %DEBUG-I-PREDEPTNOT, predefined eventpoint(s) not canceled
This command cancels all user-defined breakpoints and tracepoints and all watchpoints, and restores scopes, types, and some modes to their default values. In this example, there is a predefined breakpoint or tracepoint; this is not canceled by default.
DBG> CANCEL ALL/PREDEFINED
This command cancels all predefined breakpoints and tracepoints, and restores scopes, types, and some modes to their default values. No user-defined breakpoints or tracepoints are affected.
CANCEL BREAK
CANCEL BREAK — Cancels a breakpoint.
Synopsis
CANCEL BREAK [address-expression[, …]]Parameters
Specifies a breakpoint to be canceled. Do not use the asterisk (*)
wildcard character. Instead, use the /ALL qualifier. Do not specify an
address expression when using any qualifiers except /EVENT,
/PREDEFINED, or /USER.
Qualifiers
- /ACTIVATING
Cancels the effect of a previous
SET BREAK/ACTIVATINGcommand.- /ALL
By default, cancels all user-defined breakpoints. When used with
/PREDEFINED, cancels all predefined breakpoints but no user-defined breakpoints. To cancel all breakpoints, useCANCEL BREAK/ALL/USER/PREDEFINED.- /BRANCH
- /CALL
- /EVENT=event-name
Cancels the effect of a previous
SET BREAK/EVENT=command. Specify the event name (and address expression, if any) exactly as specified with theevent-nameSET BREAK/EVENTcommand. To identify the current event facility and the associated event names, use theSHOW EVENT_FACILITYcommand.- /EXCEPTION
Cancels the effect of a previous
SET BREAK/EXCEPTIONcommand.- /HANDLER
- /INSTRUCTION
Cancels the effect of a previous
SET BREAK/INSTRUCTIONcommand.- /LINE
- /PREDEFINED
Cancels a specified predefined breakpoint without affecting any user-defined breakpoints. When used with
/ALL, cancels all predefined breakpoints.- /SYSEMULATE
(Alpha only) Cancels the effect of a previous
SET BREAK/SYSEMULATEcommand.- /TERMINATING
Cancels the effect of a previous
SET BREAK/TERMINATINGcommand.- /UNALIGNED_DATA
(Alpha only) Cancels the effect of a previous
SET BREAK/UNALIGNED_DATAcommand.- /USER
Cancels a specified user-defined breakpoint without affecting any predefined breakpoints. This is the default unless you specify
/PREDEFINED. To cancel all user-defined breakpoints, use the/ALLqualifier.
Description
Breakpoints can be user defined or predefined. User-defined breakpoints are set explicitly
with the SET BREAK command. Predefined breakpoints, which depend on the type
of program you are debugging (for example, Ada or ZQUIT multiprocess), are established
automatically when you start the debugger. Use the SHOW BREAK command to
identify all breakpoints that are currently set. Any predefined breakpoints are identified as
such.
User-defined and predefined breakpoints are set and canceled independently. For example, a location or event can have both a user-defined and a predefined breakpoint. Canceling the user-defined breakpoint does not affect the predefined breakpoint, and conversely.
To cancel only user-defined breakpoints, do not specify /PREDEFINED with
the CANCEL BREAK command (the default is /USER). To cancel
only predefined breakpoints, specify /PREDEFINED but not
/USER. To cancel both predefined and user-defined breakpoints, specify both
/PREDEFINED and /USER.
In general, the effect of the CANCEL BREAK command is symmetrical with
that of the SET BREAK command (even though the SET BREAK
command is used only with user-defined breakpoints). Thus, to cancel a breakpoint that was
established at a specific location, specify that same location (address expression) with the
CANCEL BREAK command. To cancel breakpoints that were established on a class
of instructions or events, specify the class of instructions or events with the corresponding
qualifier (/LINE, /BRANCH, /ACTIVATING,
/EVENT=, and so on). For more information, see the qualifier
descriptions.
If you want the debugger to ignore a breakpoint without your having to cancel it (for
example, if you want to rerun the program with and without breakpoints), use the
DEACTIVATE BREAK instead of the CANCEL BREAK command.
Later, you can activate the breakpoint (with ACTIVATE BREAK).
- (
ACTIVATE,DEACTIVATE)BREAK -
CANCEL ALL - (
SET,SHOW)BREAK - (
SET,SHOW)EVENT_FACILITY - (
SET,SHOW,CANCEL)TRACE
Examples
DBG> CANCEL BREAK MAIN\LOOP+10
This command cancels the user-defined breakpoint set at the address expression
MAIN \LOOP+10.DBG> CANCEL BREAK/ALL
This command cancels all user-defined breakpoints.
DBG> CANCEL BREAK/ALL/USER/PREDEFINED
This command cancels all user-defined and predefined breakpoints.
all> CANCEL BREAK/ACTIVATING
This command cancels a previous user-defined
SET BREAK/ACTIVATINGcommand. As a result, the debugger does not suspend execution when a new process is brought under debugger control.DBG> CANCEL BREAK/EVENT=EXCEPTION_TERMINATED/PREDEFINED
This command cancels the predefined breakpoint set on task terminations due to unhandled exceptions. This breakpoint is predefined for Ada programs and programs that call POSIX Threads or Ada routines.
CANCEL DISPLAY
CANCEL DISPLAY — Permanently deletes a screen display.
Synopsis
CANCEL DISPLAY [display-name[, …]]Note
This command is not available in the VSI DECwindows Motif for OpenVMS user interface to the debugger.
Parameters
Specifies the name of a display to be canceled. Do not specify the PROMPT display, which
cannot be canceled. Do not use the asterisk (*) wildcard character. Instead,
use the /ALL qualifier. Do not specify a display name with
/ALL.
Description
When a display is canceled, its contents are permanently lost, it is deleted from the display list, and all the memory that was allocated to it is released.
You cannot cancel the PROMPT display.
- (
SHOW)DISPLAY - (
SET,SHOW,CANCEL)WINDOW
Examples
DBG> CANCEL DISPLAY SRC2
This command deletes display SRC2.
DBG> CANCEL DISPLAY/ALL
This command deletes all displays, except the PROMPT display.
CANCEL MODE
CANCEL MODE — Restores the line, symbolic, and G_floating modes established by the SET
MODE command to their default values. Also restores the default input/output
radix.
Synopsis
CANCEL MODE Note
This command is not available in the VSI DECwindows Motif for OpenVMS user interface to the debugger.
Description
CANCEL MODE command is equivalent to the following
commands:
DBG> SET MODE LINE, SYMBOLIC, NOG_FLOAT DBG> CANCEL RADIX
The default radix for both data entry and display is decimal for most languages.
On Integrity servers, the exceptions are BLISS, MACRO, and Intel ® Assembler (IAS).
On Alpha, the exceptions are BLISS, MACRO--32, and MACRO--64, which have a default radix of hexadecimal.
- (
SET,SHOW)MODE - (
SET,SHOW,CANCEL)RADIX
Example
DBG> CANCEL MODE
This command restores the default radix mode and all default mode values.
CANCEL RADIX
CANCEL RADIX — Restores the default radix for the entry and display of integer data.
Synopsis
CANCEL RADIX Qualifiers
- /OVERRIDE
Cancels the override radix established by a previous
SET RADIX/OVERRIDEcommand. This sets the current 0 override radix to "none" and restores the output radix mode to the value established with a previousSET RADIXorSET RADIX/OUTPUTcommand. If you did not change the radix mode with aSET RADIXorSET RADIX/OUTPUTcommand, theCANCEL RADIX/OVERRIDEcommand restores the radix mode to its default value.
Description
The CANCEL RADIX command cancels the effect of any previous SET
RADIX and SET RADIX/OVERRIDE commands. It restores the input and
output radix to their default value.
The default radix for both data entry and display is decimal for most languages. The exceptions are BLISS and MACRO, which have a default radix of hexadecimal.
The effect of the CANCEL RADIX/OVERRIDE command is more limited and is
explained in the description of the /OVERRIDE qualifier.
-
EVALUATE - (
SET,SHOW)RADIX
Examples
DBG> CANCEL RADIX
This command restores the default input and output radix.
DBG> CANCEL RADIX/OVERRIDE
This command cancels any override radix you might have set with the
SET RADIX/OVERRIDEcommand.
CANCEL SCOPE
CANCEL SCOPE — Restores the default scope search list for symbol lookup.
Synopsis
CANCEL SCOPE Description
The CANCEL SCOPE command cancels the current scope search list
established by a previous SET SCOPE command and restores the default scope
search list, namely 0, 1, 2, …, n, where n is the
number of calls in the call stack.
The default scope search list specifies that, for a symbol without a path-name prefix, a
symbol lookup such as EXAMINE X first looks for X in the routine that is currently executing
(scope 0); if no X is visible there, the debugger looks in the caller of that routine (scope 1),
and so on down the call stack; if X is not found in scope n, the
debugger searches the rest of the run-time symbol table (RST), then searches the global symbol
table (GST), if necessary.
- (
SET,SHOW)SCOPE
Example
DBG> CANCEL SCOPE
This command cancels the current scope.
CANCEL SOURCE
CANCEL SOURCE — Cancels a source directory search list, a source directory search method, or both a
list and method established by a previous SET SOURCE command.
Synopsis
CANCEL SOURCE []Qualifiers
- /DISPLAY
Cancels the effect of a previous
SET SOURCE/DISPLAYcommand, which specifies the directory search list to be used by the debugger when displaying source code. Canceling this command means the debugger searches for a source file in the directory in which it was compiled.- /EDIT
Cancels the effect of a previous
SET SOURCE/EDITcommand, which specifies the directory search list to be used during execution of the debugger'sEDITcommand. Canceling this command means the debugger searches for a source file in the directory in which it was compiled.- /EXACT
Cancels the effect of a previous
SET SOURCE/EXACTcommand, which specifies a directory search method. Canceling this command means that the debugger no longer searches for the exact version of the source file from compilation; it reverts to the default behavior of searching for the latest version of the file.- /LATEST
Cancels the effect of a previous
SET SOURCE/LATESTcommand, which specifies a directory search method. In this case, theCANCEL SOURCE/LATESTcommand directs the debugger to return to searching for the exact version of the source file from compilation. Because/LATESTis the default setting, this qualifier only makes sense when used with other qualifiers, for example,/MODULE.- /MODULE=module-name
Cancels the effect of a previous
SET SOURCE/MODULE=command in which the same module name and qualifiers were specified. (Themodule-name/MODULEqualifier allows you to specify a unique directory search list, directory search method, or both, for the named module.) You can append one or more of the qualifiers listed above to theSET SOURCE/MODULEandCANCEL SOURCE/MODULEcommands.If you issue a
CANCEL SOURCE/MODULEcommand with additional qualifiers, you cancel the effect of the specified qualifiers on the module. If you issue an unqualifiedCANCEL SOURCE/MODULEcommand, the debugger no longer differentiates the module from any other module in your directories.- /ORIGINAL
(Applies to STDL programs only. Requires the installation of the Correlation Facility (a separate layered product) and invocation of the kept debugger.) Cancels the effect of a previous
SET SOURCE/ORIGINALcommand. TheSET SOURCE/ORIGINALcommand is required to debug STDL source files, and must be canceled when you debug source files written in other languages.
Description
CANCEL SOURCE cancels the effect of a previous SET
SOURCE command. The nature of this cancellation depends on the qualifiers activated
in previous SET SOURCE commands. See the CANCEL SOURCE
examples to see how CANCEL SOURCE and SET SOURCE interact.
When you issue a SET SOURCE command, be aware that one of the two
qualifiers - /LATEST or /EXACT - will always be active.
These qualifiers affect the debugger search method. The /LATEST qualifier
directs the debugger to search for the version last created (the highest-numbered version in
your directory). The /EXACT qualifier directs the debugger to search for the
version last compiled (the version recorded in the debugger symbol table created at compile
time). For example, a SET SOURCE/LATEST command might search for SORT.FOR;3
while a SET SOURCE/EXACT command might search for SORT.FOR;1.
CANCEL SOURCE without the /DISPLAY or
/EDIT qualifier cancels the effect of both SET
SOURCE/DISPLAY and SET SOURCE/EDIT, if both were previously given.
The /DISPLAY qualifier is needed when the files to be displayed are no
longer in the compilation directory.
The /EDIT qualifier is needed when the files used for the display of
source code are different from the editable files. This is the case with Ada programs. For Ada
programs, the (SET, SHOW, CANCEL)
SOURCE commands affect the search of files used for source display (the
"copied" source files in Ada program libraries); the (SET,
SHOW, CANCEL) SOURCE/EDIT commands
affect the search of the source files that you edit when using the EDIT
command.
For information specific to Ada programs, type HELP Language_Support Ada.
- (
SET,SHOW)SOURCE
Examples
DBG> SET SOURCE/MODULE=CTEST/EXACT [], SYSTEM::DEVICE:[PROJD] DBG> SET SOURCE [PROJA], [PROJB], [PETER.PROJC] … DBG> SHOW SOURCE source directory search list for CTEST, match the exact source file version: [] SYSTEM::DEVICE:[PROJD] source directory list for all other modules, match the latest source file version: [PROJA] [PROJB] [PETER.PROJC] DBG> CANCEL SOURCE DBG> SHOW SOURCE source directory search list for CTEST, match the exact source file version: [] SYSTEM::DEVICE:[PROJD] all other source files will try to match the latest source file versionIn this example, the
SET SOURCEcommand establishes a directory search list and a search method (the default, latest version) for source files other than CTEST. TheCANCEL SOURCEcommand cancels the directory search list but does not cancel the search method.DBG> SET SOURCE/MODULE=CTEST/EXACT [], SYSTEM::DEVICE:[PROJD] DBG> SET SOURCE [PROJA], [PROJB], [PETER.PROJC] … DBG> SHOW SOURCE source directory search list for CTEST, match the exact source file version: [] SYSTEM::DEVICE:[PROJD] source directory list for all other modules, match the latest source file version: [PROJA] [PROJB] [PETER.PROJC] DBG> CANCEL SOURCE/MODULE=CTEST/EXACT DBG> SHOW SOURCE source directory search list for CTEST, match the latest source file version: [] SYSTEM::DEVICE:[PROJD] source directory list for all other modules, match the latest source file version: [PROJA] [PROJB] [PETER.PROJC] DBG> CANCEL SOURCE/MODULE=CTEST DBG> SHOW SOURCE source directory list for all modules, match the latest source file version: [PROJA] [PROJB] [PETER.PROJC]In this example, the
SET SOURCE/MODULE=CTEST/EXACTcommand establishes a directory search list and a search method (exact version) for the source file CTEST. TheCANCEL SOURCE/MODULE=CTEST/EXACTcommand cancels the CTEST search method (returning to the default latest version), and theCANCEL SOURCE/MODULE=CTESTcommand cancels the CTEST directory search list.DBG> SET SOURCE /EXACT DBG> SHOW SOURCE no directory search list in effect, match the exact source file DBG> SET SOURCE [JONES] DBG> SHOW SOURCE source directory list for all modules, match the exact source file version: [JONES] DBG> CANCEL SOURCE /EXACT DBG> SHOW SOURCE source directory list for all modules, match the latest source file version: [JONES]In this example, the
SET SOURCE/EXACTcommand establishes a search method (exact version) that remains in effect for theSET SOURCE [JONES]command. TheCANCEL SOURCE/EXACTcommand not only cancels theSET SOURCE/EXACTcommand, but also affects theSET SOURCE [JONES]command.
CANCEL TRACE
CANCEL TRACE — Cancels a tracepoint.
Synopsis
CANCEL TRACE [address-expression[, …]]Parameters
Specifies a tracepoint to be canceled. Do not use the asterisk (*)
wildcard character. Instead, use the /ALL qualifier. Do not specify an
address expression when using any qualifiers except /EVENT,
/PREDEFINED, or /USER.
Qualifiers
- /ACTIVATING
Cancels the effect of a previous
SET TRACE/ACTIVATINGcommand.- /ALL
By default, cancels all user-defined tracepoints. When used with
/PREDEFINED, it cancels all predefined tracepoints but no user-defined tracepoints. To cancel all tracepoints, use/ALL/USER/PREDEFINED.- /BRANCH
- /CALL
- /EVENT=event-name
Cancels the effect of a previous
SET TRACE/EVENT=command. Specify the event name (and address expression, if any) exactly as specified with theevent-nameSET TRACE/EVENTcommand. To identify the current event facility and the associated event names, use theSHOW EVENT_FACILITYcommand.- /EXCEPTION
Cancels the effect of a previous
SET TRACE/EXCEPTIONcommand.- /INSTRUCTION
Cancels the effect of a previous
SET TRACE/INSTRUCTIONcommand.- /LINE
- /PREDEFINED
Cancels a specified predefined tracepoint without affecting any user-defined tracepoints. When used with
/ALL, it cancels all predefined tracepoints.- /TERMINATING
Cancels the effect of a previous
SET TRACE/TERMINATINGcommand.- /USER
Cancels a specified user-defined tracepoint without affecting any predefined tracepoints. This is the default unless you specify
/PREDEFINED. To cancel all user-defined tracepoints, use/ALL.
Description
Tracepoints can be user defined or predefined. User-defined tracepoints are explicitly set
with the SET TRACE command. Predefined tracepoints, which depend on the type
of program you are debugging (for example, Ada or multiprocess), are established automatically
when you start the debugger. Use the SHOW TRACE command to identify all
tracepoints that are currently set. Any predefined tracepoints are identified as such.
User-defined and predefined tracepoints are set and canceled independently. For example, a location or event can have both a user-defined and a predefined tracepoint. Canceling the user-defined tracepoint does not affect the predefined tracepoint, and conversely.
To cancel only user-defined tracepoints, do not specify /PREDEFINED with
the CANCEL TRACE command (the default is /USER). To cancel
only predefined tracepoints, specify /PREDEFINED but not
/USER. To cancel both user-defined and predefined tracepoints, use
CANCEL TRACE/ALL/USER/PREDEFINED.
In general, the effect of CANCEL TRACE is symmetrical with that of
SET TRACE (even though SET TRACE is used only with
user-defined tracepoints). Thus, to cancel a tracepoint that was established at a specific
location, specify that same location (address expression) with CANCEL TRACE.
To cancel tracepoints that were established on a class of instructions or events, specify the
class of instructions or events with the corresponding qualifier (/LINE,
/BRANCH, /ACTIVATING, /EVENT=, and so
on). For more information, see the qualifier descriptions.
To cause the debugger to temporarily ignore a tracepoint, but retain definition of the
tracepoint, use the command DEACTIVATE TRACE. You can later activate the
tracepoint (with ACTIVATE TRACE).
- (
ACTIVATE,DEACTIVATE,SET,SHOW)TRACE -
CANCEL ALL - (
SET,SHOW,CANCEL)BREAK - (
SET,SHOW)EVENT_FACILITY
Examples
DBG> CANCEL TRACE MAIN\LOOP+10
This command cancels the user-defined tracepoint at the location
MAIN \LOOP+10.DBG> CANCEL TRACE/ALL
This command cancels all user-defined tracepoints.
all> CANCEL TRACE/TERMINATING
This command cancels a previous
SET TRACE/TERMINATINGcommand. As a result, a user-defined tracepoint is not triggered when a process does an image exit.DBG> CANCEL TRACE/EVENT=RUN %TASK 3
This command cancels the tracepoint that was set to trigger when task 3 (task ID = 3) entered the RUN state.
CANCEL TYPE/OVERRIDE
CANCEL TYPE/OVERRIDE — Cancels the override type established by a previous SET
TYPE/OVERRIDE command.
Synopsis
CANCEL TYPE/OVERRIDE Description
The CANCEL TYPE/OVERRIDE command sets the current override type to
"none". As a result, a program location associated with a compiler-generated type is interpreted
according to that type.
DEPOSITEXAMINE- (
SET,SHOW)EVENT_FACILITY - (
SET,SHOW)TYPE/OVERRIDE
Example
DBG> CANCEL TYPE/OVERRIDE
This command cancels the effect of a previous SET TYPE/OVERRIDE command.
CANCEL WATCH
CANCEL WATCH — Cancels a watchpoint.
Synopsis
CANCEL WATCH [address-expression[, …]]Parameters
Specifies a watchpoint to be canceled. With high-level languages, this is typically the
name of a variable. Do not use the asterisk (*) wildcard character. Instead,
use the /ALL qualifier. Do not specify an address expression with
/ALL.
Description
The effect of the CANCEL WATCH command is symmetrical with the effect of
the SET WATCH command. To cancel a watchpoint that was established at a
specific location with the SET WATCH command, specify that same location with
CANCEL WATCH. Thus, to cancel a watchpoint that was set on an entire
aggregate, specify the aggregate in the CANCEL WATCH command; to cancel a
watchpoint that was set on one element of an aggregate, specify that element in the
CANCEL WATCH command.
The CANCEL ALL command also cancels all watchpoints.
To cause the debugger to temporarily ignore a watchpoint, but not delete the definition of
the watchpoint, use the command DEACTIVATE WATCH. You can later activate the
watchpoint (with ACTIVATE WATCH).
- (
ACTIVATE,DEACTIVATE,SET,SHOW)WATCH -
CANCEL ALL - (
SET,SHOW,CANCEL)BREAK - (
SET,SHOW,CANCEL)TRACE
Examples
DBG> CANCEL WATCH SUB2\TOTAL
This command cancels the watchpoint at variable TOTAL in module SUB2.
DBG> CANCEL WATCH/ALL
This command cancels all watchpoints you have set.
CANCEL WINDOW
CANCEL WINDOW — Permanently deletes a screen window definition.
Synopsis
CANCEL WINDOW [window-name[, …]]Note
This command is not available in the VSI DECwindows Motif for OpenVMS user interface to the debugger.
Parameters
Specifies the name of a screen window definition to be canceled. Do not use the asterisk
(*) wildcard character. Instead, use the /ALL qualifier. Do
not specify a window definition name with /ALL.
Description
When a window definition is canceled, you can no longer use its name in a
DISPLAY command. The CANCEL WINDOW command does not
affect any displays.
- (
SHOW,CANCEL)DISPLAY - (
SET,SHOW)WATCH
Example
DBG> CANCEL WINDOW MIDDLE
This command permanently deletes the screen window definition MIDDLE.
CONNECT
CONNECT — (Kept debugger only.) Interrupts an image that is running without debugger control in
another process and brings that process under debugger control. When used without a parameter,
CONNECT brings any spawned process that is waiting to connect to the
debugger under debugger control. On Alpha systems, the debugger command
CONNECT can also be used to bring a target system running the Alpha
operating system under the control of the OpenVMS Alpha System-Code Debugger. The OpenVMS Alpha
System-Code Debugger is a kernel debugger that you activate through the OpenVMS Debugger. On
Integrity servers, the debugger command CONNECT can also be used to bring a
target system running the Integrity server operating system under the control of the OpenVMS
Integrity server System-Code Debugger. The OpenVMS Integrity server System-Code Debugger is a
kernel debugger that you activate through the OpenVMS Debugger. If you are using the
CONNECT command to debug the Alpha operating system, you must complete the
instructions described in the System
Code Debugger chapter of the VSI OpenVMS System Analysis Tools Manual before you issue the command.
(These instructions include the creation of an Alpha device driver and the setup commands
activating the OpenVMS Alpha System-Code Debugger.) You must also have started the OpenVMS
Debugger with the DCL command DEBUG/KEEP.
Synopsis
CONNECT [process-spec]CONNECT [%NODE_NAME node-name]Parameters
|
[%PROCESS_NAME] |
The OpenVMS process name, if that name contains no space or lowercase characters. The process name can include the asterisk (*) wildcard character. |
|
[%PROCESS_NAME] " |
The OpenVMS process name, if that name contains space or lowercase characters. You can also use apostrophes (') instead of quotation marks ("). |
|
%PROCESS_PID |
The OpenVMS process identifier (PID, a hexadecimal number). |
(Alpha or Integrity servers only) When you are debugging an Alpha or Integrity server operating system, specifies the node name of the machine to which you are connecting (the target machine running the Alpha or Integrity server operating system).
Qualifiers
- /PASSWORD="password"
(Alpha or Integrity servers only)When you are debugging an Alpha or Integrity server operating system, specifies the password for the machine to which you are connecting(the target machine running the Alpha or Integrity server operating system).If a password has not been established for that machine, this qualifier can be omitted.
- /IMAGE_PATH="image-path"
(Alpha or Integrity servers only)When you are debugging an Alpha operating system, specifies the image-path for the machine from which you are connecting(the host machine running the debugger). The image-path is a logical name that points to the location of system images. The default logical name is
DBGHK$IMAGE_PATH:.
Description
(Kept debugger only.) When you specify a process, the CONNECT command
enables you to interrupt an image that is running without debugger control in that process and
bring the process under debugger control. The command is useful if, for example, you run a
debuggable image with the DCL command RUN/NODEBUG, or if your program issues a LIB$SPAWN
Run-Time Library call that does not start the debugger. You can connect to a process created
through a $CREPRC system service call only if you specify LOGINOUT.EXE as
the executable
image.
Depending on the version of the debugger you are running on your system, you may be
restricted to connection with processes you created, or you may be able to connect to processes
created by any member of your user identification code (UIC) group. (In some cases, you may have
to set the SYSGEN SECURITY_POLICY parameter to 8 before you create the
process.)
If debugger logicals (DEBUG, DEBUGSHR,
DEBUGUISHR, DBGTBKMSG, DBG$PROCESS,
DBG$HELP, DBG$UIHELP, DEBUGAPPCLASS,
and VMSDEBUGUIL) exist, they must translate to the same definitions in both
the debugger and the target process.
The code in the image must be compiled with the /DEBUG qualifier and the
image must be linked with either /DEBUG or /DSF. The image
must not be linked with the /NOTRACEBACK
qualifier.
When the process is brought under debugger control, execution of the image is suspended at the point at which it was interrupted.
When you do not specify a process, the CONNECT command brings any
processes that are waiting to connect to your debugging session under debugger control. If no
process is waiting, you can press Ctrl/C to abort the
CONNECT command.
By default, a tracepoint is triggered when a process is brought under debugger control.
This predefined tracepoint is equivalent to that resulting from entering the SET
TRACE/ACTIVATING command. The process is then known to the debugger and can be
identified in a SHOW PROCESS display.
You cannot use the CONNECT command to connect to a subprocess of a
process running under debugger control. Use the SET PROCESS command to
connect to such a subprocess.
-
DISCONNECT - Ctrl/Y
- (
SET,SHOW,CANCEL)TRACE
Using the CONNECT Command to Debug the OpenVMS Operating System (Integrity servers and Alpha only)
You can use the CONNECT command to debug Alpha or Integrity server
operating system code with the OpenVMS System Code Debugger (SCD). This capability requires two
systems, one called the host and the other called the target. The host and target must be
running the same operating system (Alpha or Integrity servers). The host is configured as a
standard OpenVMS system, from which you run the debugger using DEBUG/KEEP,
then enter the CONNECT command. The target is a standalone system that is
booted in a special way that enables SCD. Communication between the host and the target occurs
over the Ethernet network.
For complete information on using the OpenVMS System Code Debugger, see the VSI OpenVMS System Analysis Tools Manual.
Examples
DBG_1> CONNECT
This command brings under debugger control any processes that are waiting to be connected to the debugger.
DBG_1> CONNECT JONES_3
This command interrupts the image running in process JONES_3 and brings the process under debugger control. Process JONES_3 must be in the same UIC group as the process in which the debugger was started. Also, the image must not have been linked with the
/NOTRACEBACKqualifier.DBG> CONNECT %NODE_NAME SCDTST /PASSWORD="eager_beaver" %DEBUG-I-NOLOCALS, image does not contain local symbols DBG>
This
CONNECTcommand brings the target system running the OpenVMS operating system under debugger control. This example specifies that the target system has a node name of SCDTST and a password of eager_beaver.
Ctrl/C
Ctrl/C — When entered from within a debugging session, Ctrl/C aborts the
execution of a debugger command or interrupts program execution without interrupting the
debugging session.
Synopsis
Ctrl/C Note
Do not use Ctrl/Y from within a debugging session.
Description
Pressing Ctrl/C enables you to abort the execution of a debugger command
or to interrupt program execution without interrupting the debugging session. This is useful
when, for example, the program is executing an infinite loop that does not have a breakpoint, or
you want to abort a debugger command that takes a long time to complete. The debugger prompt is
then displayed, so that you can enter debugger commands.
If your program already has a Ctrl/C AST service routine enabled, use
the SET ABORT_KEY command to assign the debugger's abort function to another
Ctrl-key sequence. Note, however, that many Ctrl-key sequences have predefined functions, and
the SET ABORT_KEY command enables you to override such definitions (see the
OpenVMS User's Manual). Some of the Ctrl-key characters not used by the
operating system are G, K, N, and P.
If your program does not have a Ctrl/C AST service
routine enabled and you assign the debugger's abort function to another Ctrl-key sequence, then
Ctrl/C behaves like Ctrl/Y - that is, it interrupts the
debugging session and returns you to DCL level.
Do not use Ctrl/Y from within a debugging session. Instead, use either
Ctrl/C or an equivalent Ctrl-key sequence established with the SET
ABORT_KEY command.
You can use the SPAWN and ATTACH commands to leave
and return to a debugging session without losing the debugging context.
Note
Pressing Ctrl/C to interrupt a program running under debugger control
works only once. Thereafter, the Ctrl/C interrupt is ignored. The same is
true when using the DECwindows STOP button; the action is acknowledged only the first time the
button is pressed.
-
ATTACH -
Ctrl/Y - (
SET,SHOW)ABORT_KEY -
SPAWN
Example
DBG> GO
…
Ctrl/C
DBG> EXAMINE/BYTE 1000:101000 !should have typed 1000:1010
1000: 0
1004: 0
1008: 0
1012: 0
1016: 0
Ctrl/C
%DEBUG-W-ABORTED, command aborted by user request
DBG>This example shows how to use Ctrl/C to interrupt program execution and
then to abort the execution of a debugger command.
Ctrl/W
Ctrl/W — Ctrl/W refreshes the screen in screen mode (like
DISPLAY/REFRESH).
Synopsis
Ctrl/W Description
For more information about Ctrl/W, see the /REFRESH
qualifier to the DISPLAY command.
Ctrl/Y
Ctrl/Y — When entered from DCL level, Ctrl/Y interrupts an image that is
running without debugger control, enabling you then to start the debugger with the DCL command
DEBUG.
Synopsis
Ctrl/Y Notes
Do not use Ctrl/Y from within a debugging session. Instead, use
Ctrl/C or an equivalent abort-key sequence established with the
SET ABORT_KEY command.
When you start the debugger with the Ctrl/Y--DEBUG sequence, you cannot
then use the debugger RUN or RERUN commands.
Description
Pressing Ctrl/Y at DCL level enables you to interrupt an image that is
running without debugger control, so that you can then start the debugger with the DCL command
DEBUG.
You can bring an image under debugger control only if, as a minimum, that image was linked
with the /TRACEBACK qualifier (/TRACEBACK is the default
for the LINK command).
When you press Ctrl/Y to interrupt the image's execution, control is
passed to DCL. If you then enter the DCL command DEBUG, the interrupted image
is brought under control of the debugger. The debugger sets its language-dependent parameters to
the source language of the module in which execution was interrupted and displays its prompt.
You can then determine where execution was suspended by entering a SHOW CALLS
command.
The Ctrl/Y--DEBUG sequence is not supported in the kept debugger
configuration.
The Ctrl/Y--DEBUG sequence is not supported in the
VSI DECwindows Motif for OpenVMS user interface to the debugger. Instead, use the STOP button.
Within a debugging session, you can use the CONNECT command to connect
an image that is running without debugger control in another process (of the same job) to that
debugging session.
-
CONNECT -
Ctrl/C -
DEBUG(DCL command) -
RUN(DCL command)
Examples
$ RUN/NODEBUG TEST_B … Ctrl/Y Interrupt $ DEBUG Debugger Banner and Version Number Language: ADA, Module: SWAP DBG>In this example, the
RUN/NODEBUGcommand executes the image TEST_B without debugger control. Execution is interrupted withCtrl/Y. TheDEBUGcommand then causes the debugger to be started. The debugger displays its banner, sets the language-dependent parameters to the language (Ada, in this case) of the module (SWAP) in which execution was interrupted, and displays the prompt.$ RUN/NODEBUG PROG2 … Ctrl/Y Interrupt $ DEBUG Debugger Banner and Version Number Language: FORTRAN, Module: SUB4 predefined trace on activation at SUB4\%LINE 12 in %PROCESS_NUMBER 1 DBG>In this example, the
DEFINE/JOBcommand establishes a multiprocess debugging configuration. TheRUN/NODEBUGcommand executes the image PROG2 without debugger control. TheCtrl/Y--DEBUGsequence interrupts execution and starts the debugger. The banner indicates that a new debugging session has been started. The activation tracepoint indicates where execution was interrupted when the debugger took control of the process.
Ctrl/Z
Ctrl/Z — Ctrl/Z ends a debugging session (like EXIT).
Synopsis
Ctrl/Z Description
For more information about Ctrl/Z, see the EXIT
command.
DEACTIVATE BREAK
DEACTIVATE BREAK — Deactivates a breakpoint, which you can later activate.
Synopsis
DEACTIVATE BREAK [address-expression[, …]]Parameters
Specifies a breakpoint to be deactivated. Do not use the asterisk (*)
wildcard character. Instead, use the /ALL qualifier. Do not specify an
address expression when using any qualifiers except /EVENT,
/PREDEFINED, or /USER.
Qualifiers
- /ACTIVATING
Deactivates a breakpoint established by a previous
SET BREAK/ACTIVATINGcommand.- /ALL
By default, deactivates all user-defined breakpoints. When used with
/PREDEFINED, deactivates all predefined breakpoints but no user-defined breakpoints. To deactivate all breakpoints, use/ALL/USER/PREDEFINED.- /BRANCH
Deactivates a breakpoint established by a previous
SET BREAK/BRANCHcommand.- /CALL
Deactivates a breakpoint established by a previous
SET BREAK/CALLcommand.- /EVENT=event-name
Deactivates a breakpoint established by a previous
SETBREAK/EVENT=command. Specify the event name (and address expression, if any) exactly as specified with theevent-nameSET BREAK/EVENTcommand.To identify the current event facility and the associated event names, use the
SHOW EVENT_FACILITYcommand.- /EXCEPTION
Deactivates a breakpoint established by a previous
SET BREAK/EXCEPTIONcommand.- /HANDLER
Deactivates a breakpoint established by a previous
SET BREAK/HANDLERcommand.- /INSTRUCTION
Deactivates a breakpoint established by a previous
SET BREAK/INSTRUCTIONcommand.- /LINE
Deactivates a breakpoint established by a previous
SET BREAK/LINEcommand.- /PREDEFINED
Deactivates a specified predefined breakpoint without affecting any user-defined breakpoints. When used with
/ALL, deactivates all predefined breakpoints.- /SYSEMULATE
(Alpha only) Deactivates a breakpoint established by a previous
SET BREAK/SYSEMULATEcommand.- /TERMINATING
Deactivates a breakpoint established by a previous
SET BREAK/TERMINATINGcommand.- /UNALIGNED_DATA
(Alpha only) Deactivates a breakpoint established by a previous
SET BREAK/UNALIGNED_DATAcommand.- /USER
Deactivates a specified user-defined breakpoint. To deactivate all user-defined breakpoints, use the
/ALLqualifier.
Description
User-defined breakpoints are activated when you set them with the SET
BREAK command. Predefined breakpoints are activated by default. Use the
DEACTIVATE BREAK command to deactivate one or more breakpoints.
If you deactivate a breakpoint, the debugger ignores the breakpoint during program
execution. To activate a deactivated breakpoint, use the ACTIVATE BREAK
command. You can activate and deactivate user-defined and predefined breakpoints separately.
Activating and deactivating breakpoints enables you to run and rerun your program with or
without breakpoints without having to cancel and then reset them. By default, the
RERUN command saves the current state of all breakpoints(activated or deactivated).
To check if a breakpoint is deactivated, use the SHOW BREAK
command.
-
CANCEL ALL -
RERUN - (
SET,SHOW,CANCEL,ACTIVATE)BREAK - (
SET,SHOW)EVENT_FACILITY
Examples
DBG> DEACTIVATE BREAK MAIN\LOOP+10
This command deactivates the user-defined breakpoint set at the address expression
MAIN \LOOP+10.DBG> DEACTIVATE BREAK/ALL
This command deactivates all user-defined breakpoints.
DEACTIVATE TRACE
DEACTIVATE TRACE — Deactivates a tracepoint, which you can later activate.
Synopsis
DEACTIVATE TRACE [address-expression[, …]]Parameters
Specifies a tracepoint to be deactivated. Do not use the asterisk (*)
wildcard character. Instead, use the /ALL qualifier. Do not specify an
address expression when using any qualifiers except /EVENT,
/PREDEFINED, or /USER.
Qualifiers
- /ACTIVATING
Deactivates a tracepoint established with a previous
SET TRACE/ACTIVATINGcommand.- /ALL
By default, deactivates all user-defined tracepoints. When used with
/PREDEFINED, it deactivates all predefined tracepoints but no user-defined tracepoints. To deactivate all tracepoints, use/ALL/USER/PREDEFINED.- /BRANCH
Deactivates a tracepoint established with a previous
SET TRACE/BRANCHcommand.- /CALL
Deactivates a tracepoint established with a previous
SET TRACE/CALLcommand.- /EVENT=event-name
Deactivates a tracepoint established with a previous
SET TRACE/EVENT=command. Specify the event name (and address expression, if any) exactly as specified with theevent-nameSET TRACE/EVENTcommand.To identify the current event facility and the associated event names, use the
SHOW EVENT_FACILITYcommand.- /EXCEPTION
Deactivates a tracepoint established with a previous
SET TRACE/EXCEPTIONcommand.- /INSTRUCTION
Deactivates a tracepoint established with a previous
SET TRACE/INSTRUCTIONcommand.- /LINE
Deactivates a tracepoint established with a previous
SET TRACE/LINEcommand.- /PREDEFINED
Deactivates a specified predefined tracepoint without affecting any user-defined tracepoints. When used with
/ALL, it deactivates all predefined tracepoints.- /TERMINATING
Deactivates a tracepoint established with a previous
SET TRACE/TERMINATINGcommand.- /USER
Deactivates a specified user-defined tracepoint without affecting any predefined tracepoints. When used with
/ALL, it deactivates all user-defined tracepoints. The/USERqualifier is the default unless you specify/PREDEFINED.
Description
User-defined tracepoints are activated when you set them with the SET
TRACE command. Predefined tracepoints are activated by default. Use the
DEACTIVATE TRACE command to deactivate one or more tracepoints.
If you deactivate a tracepoint, the debugger ignores the tracepoint during program
execution. To activate a deactivated tracepoint, use the ACTIVATE TRACE
command. You can activate and deactivate user-defined and predefined tracepoints separately.
Activating and deactivating tracepoints enables you to run and rerun your program with or
without tracepoints without having to cancel and then reset them. By default, the
RERUN command saves the current state of all tracepoints (activated or deactivated).
To check if a tracepoint is deactivated, use the SHOW TRACE command.
-
CANCEL ALL -
RERUN - (
SET,SHOW)EVENT_FACILITY - (
SET,SHOW,CANCEL,ACTIVATE)TRACE
Examples
DBG> DEACTIVATE TRACE MAIN\LOOP+10
This command deactivates the user-defined tracepoint at the location MAIN \LOOP+10.
DBG> DEACTIVATE TRACE/ALL
This command deactivates all user-defined tracepoints.
DEACTIVATE WATCH
DEACTIVATE WATCH — Deactivates a watchpoint, which you can later activate.
Synopsis
DEACTIVATE WATCH [address-expression[, …]]Parameters
Specifies a watchpoint to be deactivated. With high-level languages, this is typically the
name of a variable. Do not use the asterisk (*) wildcard character. Instead,
use the /ALL qualifier. Do not specify an address expression with
/ALL.
Description
Watchpoints are activated when you set them with the SET WATCH command.
Use the DEACTIVATE WATCH command to deactivate one or more watchpoints.
If you deactivate a watchpoint, the debugger ignores the watchpoint during program
execution. To activate a deactivated watchpoint, use the ACTIVATE WATCH
command. Activating and deactivating watchpoints enables you to run and rerun your program with
or without watchpoints without having to cancel and then reset them.
By default, the RERUN command saves the current state of all
static watchpoints (activated or deactivated). The state of a particular nonstatic watchpoint
might or might not be saved depending on the scope of the variable being watched relative to the
main program unit (where execution restarts).
To check if a watchpoint is deactivated, use the SHOW WATCH command.
-
CANCEL ALL -
RERUN - (
SET,SHOW,CANCEL,ACTIVATE)WATCH
Examples
DBG> DEACTIVATE WATCH SUB2\TOTAL
This command deactivates the watchpoint at variable TOTAL in module SUB2.
DBG> DEACTIVATE WATCH/ALL
This command deactivates all watchpoints you have set.
DECLARE
DECLARE — Declares a formal parameter within a command procedure. This enables you to pass an
actual parameter to the procedure when entering an execute procedure (@)
command.
Synopsis
DECLARE [p-name:p-kind [, p-name:p-kind[, …]]]Parameters
Specifies a formal parameter (a symbol) that is declared within the command procedure.
Do not specify a null parameter (represented either by two consecutive commas or by a comma at the end of the command).
|
ADDRESS |
Specifies that the actual parameter is interpreted as an address expression. Same
effect as |
|
COMMAND |
Specifies that the actual parameter is interpreted as a command. Same effect as
|
|
VALUE |
Specifies that the actual parameter is interpreted as a value expression in the
current language. Same effect as |
Description
The DECLARE command is valid only within a command procedure.
The DECLARE command binds one or more actual parameters, specified on
the command line following the execute procedure (@) command, to formal
parameters (symbols) declared within a command procedure.
Each p-name:p-kind pair specified by a DECLARE
command binds one formal parameter to one actual parameter. Formal parameters are bound to
actual parameters in the order in which the debugger processes the parameter declarations. If
you specify several formal parameters on a single DECLARE command, the
leftmost formal parameter is bound to the first actual parameter, the next formal parameter is
bound to the second, and soon. If you use a DECLARE command in a loop, the
formal parameter is bound to the first actual parameter on the first iteration of the loop; the
same formal parameter is bound to the second actual parameter on the next iteration, and so on.
Each parameter declaration acts like a DEFINE command: it associates a
formal parameter with an address expression, a command, or a value expression in the current
language, according to the parameter kind specified. The formal parameters themselves are
consistent with those accepted by the DEFINE command and can in fact be
deleted from the symbol table with the DELETE command.
The %PARCNT built-in symbol, which can be used only within a command procedure, enables you to pass a variable number of parameters to a command procedure. The value of %PARCNT is the number of actual parameters passed to the command procedure.
-
@(Execute Procedure) -
DEFINE -
DELETE
Examples
! ***** Command Procedure EXAM.COM ***** SET OUTPUT VERIFY DECLARE K:ADDRESS EXAMINE K DBG> @EXAM ARR4 %DEBUG-I-VERIFYIC, entering command procedure EXAM DECLARE K:ADDRESS EXAMINE K PROG_8\ARR4 (1): 18 (2): 1 (3): 0 (4): 1 %DEBUG-I-VERIFYIC, exiting command procedure EXAM DBG>In this example, the
DECLARE K:ADDRESScommand declares the formal parameter K within command procedureEXAM.COM. WhenEXAM.COMis executed, the actual parameter passed toEXAM.COMis interpreted as an address expression, and theEXAMINE Kcommand displays the value of that address expression. TheSET OUTPUT VERIFYcommand causes the commands to echo when they are read by the debugger.At the debugger prompt, the
@EXAM ARR4command executesEXAM.COM, passing the actual parameter ARR4. WithinEXAM.COM, ARR4 is interpreted as an address expression (an array variable, in this case).! ***** Debugger Command Procedure EXAM_GO.COM ***** DECLARE L:ADDRESS, M:COMMAND EXAMINE L; M DBG> @EXAM_GO X "@DUMP"
In this example, the command procedure
EXAM_GO.COMaccepts two parameters, an address expression (L) and a command string (M).The address expression is then examined and the command is executed.At the debugger prompt, the
@EXAM_GO X "@DUMP"command executesEXAM_GO.COM, passing the address expression X and the command string@DUMP.! ***** Debugger Command Procedure VAR.DBG ***** SET OUTPUT VERIFY FOR I = 1 TO %PARCNT DO (DECLARE X:VALUE; EVALUATE X) DBG> @VAR.DBG 12, 37, 45 %DEBUG-I-VERIFYIC, entering command procedure VAR.DBG FOR I = 1 TO %PARCNT DO (DECLARE X:VALUE; EVALUATE X) 12 37 45 %DEBUG-I-VERIFYIC, exiting command procedure VAR.DBG DBG>
In this example, the command procedure
VAR.DBGaccepts a variable number of parameters. That number is stored in the built-in symbol %PARCNT.At the debugger prompt, the
@VAR.DBGcommand executesVAR.DBG, passing the actual parameters 12, 37, and 45. Therefore, %PARCNT has the value 3, and the FOR loop is repeated 3 times. The FOR loop causes theDECLAREcommand to bind each of the three actual parameters (starting with 12) to a new declaration of X. Each actual parameter is interpreted as a value expression in the current language, and theEVALUATE Xcommand displays that value.
DEFINE
DEFINE — Assigns a symbolic name to an address expression, command, or value.
Synopsis
DEFINE [symbol-name=parameter [, symbol-name=parameter[, …]]]Parameters
Specifies a symbolic name to be assigned to an address, command, or value. The symbolic name can be composed of alphanumeric characters and underscores. The debugger converts lowercase alphabetic characters to uppercase. The first character must not be a number. The symbolic name must be no more than 31 characters long.
Depends on the qualifier specified.
Qualifiers
- /ADDRESS
(Default) Specifies that the defined symbol is an abbreviation for an address expression. In this case,
parameteris an address expression.- /COMMAND
- Specifies that the defined symbol is treated as a new debugger command. In this case,
parameteris a quoted character string. This qualifier provides, in simple cases, essentially the same capability as the following DCL command:$
symbol:=stringTo define complex commands, you might need to use command procedures with formal parameters. For more information about declaring parameters to command procedures, see the DECLARE command.
- /LOCAL
Specifies that the definition is valid only in the command procedure in which it is defined. The defined symbol is not visible at debugger command level. By default, a symbol defined within a command procedure is visible outside that procedure.
- /VALUE
Specifies that the defined symbol is an abbreviation for a value. In this case,
parameteris a language expression in the current language.
Description
The DEFINE/ADDRESS command assigns a symbolic name to an address
expression in a program. You can define a symbol for a nonsymbolic program location or for a
symbolic program location having a long path-name prefix. You can then refer to that program
location with the symbolic name. The /ADDRESS qualifier is the default.
The DEFINE/COMMAND command enables you to define abbreviations for
debugger commands or even define new commands, either from the debugger command level or from
command procedures.
The DEFINE/VALUE command enables you to assign a symbolic name to a
value(or the result of evaluating a language expression).
The DEFINE/LOCAL command confines symbol definitions to command
procedures. By default, defined symbols are global (visible outside the command procedure).
To enter several DEFINE commands with the same qualifier, first use the
SET DEFINE command to establish a new default qualifier (for example,
SET DEFINE COMMAND makes subsequent DEFINE commands
behave like DEFINE/COMMAND). You can override the current default qualifier
for a single DEFINE command by specifying another qualifier.
In symbol translation, the debugger searches symbols you define during the debugging session first. So if you define a symbol that already exists in your program, the debugger translates the symbol according to its defined definition, unless you specify a path-name prefix.
If a symbol is redefined, the previous definition is canceled, even if you used different
qualifiers with the DEFINE command.
Definitions created with the DEFINE/ADDRESS and
DEFINE/VALUE commands are available only when the image in whose context
they were created is the current image. If you use the SET IMAGE command to
establish a new current image, these definitions are temporarily unavailable. However,
definitions created with the DEFINE/COMMAND and DEFINE/KEY
commands are always available for all images.
Use the SHOW SYMBOL/DEFINED command to determine the equivalence
value of a symbol.
Use the DELETE command to cancel a symbol definition.
-
DECLARE -
DELETE -
SET IMAGE -
SHOW DEFINE -
SHOW SYMBOL/DEFINED
Examples
DBG> DEFINE CHK=MAIN\LOOP+10
This command assigns the symbol CHK to the address
MAIN \LOOP+10.DBG> DEFINE/VALUE COUNTER=0 DBG> SET TRACE/SILENT R DO (DEFINE/VALUE COUNTER = COUNTER+1)
In this example, the
DEFINE/VALUEcommand assigns a value of 0 to the symbol COUNTER. TheSET TRACEcommand causes the debugger to increment the value of the symbol COUNTER by 1 whenever address R is encountered. In other words, this example counts the number of calls to R.DBG> DEFINE/COMMAND BRE = "SET BREAK"
This command assigns the symbol BRE to the debugger command
SET BREAK.
DEFINE/KEY
DEFINE/KEY — Assigns a string to a function key.
Synopsis
DEFINE/KEY [key-name "equivalence-string"]Note
This command is not available in the VSI DECwindows Motif for OpenVMS user interface to the debugger.
Parameters
|
Key Name |
LK201 Keyboard |
VT100-type |
VT52-type |
|---|---|---|---|
|
PF1 |
PF1 |
PF1 |
Blue |
|
PF2 |
PF2 |
PF2 |
Red |
|
PF3 |
PF3 |
PF3 |
Black |
|
PF4 |
PF4 |
PF4 | |
|
KP0--KP9 |
Keypad 0--9 |
Keypad 0--9 |
Keypad 0--9 |
|
PERIOD |
Keypad period (.) |
Keypad period (.) | |
|
COMMA |
Keypad comma (, ) |
Keypad comma (, ) | |
|
E1 |
Find | ||
|
E2 |
Insert Here | ||
|
E3 |
Remove | ||
|
E4 |
Select | ||
|
E5 |
Prev Screen | ||
|
E6 |
Next Screen | ||
|
HELP |
Help | ||
|
DO |
Do | ||
|
F6--F20 |
F6--F20 |
You cannot define keys F1 to F5 or the arrow keys (E7 to E10).
You can define keys F6 to F14 only if you have first entered the DCL command
SET TERMINAL/NOLINE_EDITING. In that case, the line-editing functions of the left and right arrow keys (E8 and E9) are disabled.
Specifies the string to be processed when you press the specified key. Typically, this is one or more debugger commands. If the string includes any space or non alphanumeric characters (for example, a semicolon separating two commands), enclose the string in quotation marks (").
Qualifiers
- /ECHO (default)
/NOECHO Controls whether the command line is displayed after the key has been pressed. Do not use
/NOECHOwith/NOTERMINATE.- /IF_STATE=(state-name[, …])
/NOIF_STATE (default) Specifies one or more states to which a key definition applies. The
/IF_STATEqualifier assigns the key definition to the specified states. You can specify predefined states, such as DEFAULT and GOLD, or user-defined states. A state name can be any appropriate alphanumeric string. The/NOIF_STATEqualifier assigns the key definition to the current state.- /LOCK_STATE
/NOLOCK_STATE (default) Controls how long the state set by
/SET_STATEremains in effect after the specified key is pressed. The/LOCK_STATEqualifier causes the state to remain in effect until it is changed explicitly (for example, with aSET KEY/STATEcommand). The/NOLOCK_STATEqualifier causes the state to remain in effect only until the next terminator character is typed, or until the next defined function key is pressed.- /LOG (default)
/NOLOG Controls whether a message is displayed indicating that the key definition has been successfully created. The
/LOGqualifier displays the message. The/NOLOGqualifier suppresses the message.- /SET_STATE=state-name
/NOSET_STATE (default) Controls whether pressing the key changes the current key state. The
/SET_STATEqualifier causes the current state to change to the specified state when you press the key. The/NOSET_STATEqualifier causes the current state to remain in effect.- /TERMINATE
/NOTERMINATE (default) Controls whether the specified string is terminated (processed) when the key is pressed. The
/TERMINATEqualifier causes the string to be terminated when the key is pressed. The/NOTERMINATEqualifier enables you to press other keys before terminating the string by pressing the Return key.
Description
Keypad mode must be enabled (SET MODE KEYPAD) before you can use this
command. Keypad mode is enabled by default.
The DEFINE/KEY command enables you to assign a string to a function key,
overriding any predefined function that was bound to that key. When you then press the key, the
debugger enters the currently associated string into your command line. The
DEFINE/KEY command is like the DCL command
DEFINE/KEY.
For a list of the predefined key functions, see the Keypad_Definitions_CI online help topic.
On VT52- and VT100-series terminals, the function keys you can use include all of the numeric keypad keys. Newer terminals and workstations have the LK201 keyboard. On LK201 keyboards, the function keys you can use include all of the numeric keypad keys, the non arrow keys of the editing keypad (Find, Insert Here, and so on), and keys F6 to F20 at the top of the keyboard.
A key definition remains in effect until you redefine the key, enter the
DELETE/KEY command for that key, or exit the debugger. You can include key
definitions in a command procedure, such as your debugger initialization file.
The /IF_STATE qualifier enables you to increase the number of key
definitions available on your terminal. The same key can be assigned any number of definitions
as long as each definition is associated with a different state.
By default, the current key state is the DEFAULT state. The current state can be changed
with the SET KEY/STATE command, or by pressing a key that causes a state
change (a key that was defined with DEFINE/KEY/LOCK_STATE/SET_STATE).
-
DELETE/KEY - (
SET,SHOW)KEY
Examples
DBG> SET KEY/STATE=GOLD %DEBUG-I-SETKEY, keypad state has been set to GOLD DBG> DEFINE/KEY/TERMINATE KP9 "SET RADIX/OVERRIDE HEX" %DEBUG-I-DEFKEY, GOLD key KP9 has been defined
In this example, the
SET KEYcommand establishes GOLD as the current key state. TheDEFINE/KEYcommand assigns theSET RADIX/OVERRIDE HEXcommand to keypad key 9 (KP9) for the current state (GOLD). The command is processed when you press the key.DBG> DEFINE/KEY/IF_STATE=BLUE KP9 "SET BREAK %LINE " %DEBUG-I-DEFKEY, BLUE key KP9 has been defined
This command assigns the unterminated command string "SETBREAK %LINE" to keypad key 9 for the BLUE state. After pressing BLUE-KP9, you can enter a line number and then press the Return key to terminate and process the
SET BREAKcommand.DBG> SET KEY/STATE=DEFAULT %DEBUG-I-SETKEY, keypad state has been set to DEFAULT DBG> DEFINE/KEY/SET_STATE=RED/LOCK_STATE F12 "" %DEBUG-I-DEFKEY, DEFAULT key F12 has been defined
In this example, the
SET KEYcommand establishes DEFAULT as the current state. TheDEFINE/KEYcommand makes the F12 key (on an LK201 keyboard) a state key. Pressing F12 while in the DEFAULT state causes the current state to become RED. The key definition is not terminated and has no other effect (a null string is assigned to F12). After pressing F12, you can enter "RED" commands by pressing keys that have definitions associated with the RED state.
DEFINE/PROCESS_SET
DEFINE/PROCESS_SET — Assigns a symbolic name to a list of process specifications.
Synopsis
DEFINE/PROCESS_SET [process-set-name =process-spec[, …]]Parameters
Specifies a symbolic name to be assigned to a list of process specifications. The symbolic name can be composed of alphanumeric characters and underscores. The debugger converts lowercase alphabetic characters to uppercase. The first character must not be a number. The symbolic name must be no more than 31 characters long.
|
[%PROCESS_NAME] |
The process name, if that name does not contain spaces or lowercase characters. The process name can include the asterisk (*) wildcard character. |
|
[%PROCESS_NAME] " |
The process name, if that name contains spaces or lowercase characters. You can also use apostrophes (') instead of quotation marks ("). |
|
%PROCESS_PID |
The process identifier (PID, a hexadecimal number). |
|
[%PROCESS_NUMBER] |
The number assigned to a process when it comes under debugger control. A new number
is assigned sequentially, starting with 1, to each process. If a process is terminated
with the |
|
|
A symbol defined with the |
|
%NEXT_PROCESS |
The next process after the visible process in the debugger's circular process list. |
|
%PREVIOUS_PROCESS |
The process previous to the visible process in the debugger's circular process list. |
|
%VISIBLE_PROCESS |
The process whose stack, register set, and images are the current context for looking up symbols, register values, routine calls, breakpoints, and so on. |
If you do not specify a process, the symbolic name is created but contains no process entries.
Description
The DEFINE/PROCESS_SET command assigns a symbol to a list of process
specifications. You can then use the symbol in any command where a list of process
specifications is allowed.
The DEFINE/PROCESS_SET command does not verify the existence of a
specified process. This enables you to specify processes that do not yet exist.
To identify a symbol that was defined with the DEFINE/PROCESS_SET
command, use the SHOW SYMBOL/DEFINED command. To delete a symbol that was
defined with the DEFINE/PROCESS_SET command, use the
DELETE command.
-
DELETE - (
SET,SHOW)DEFINE -
SHOW SYMBOL/DEFINED
Examples
all> DEFINE/PROCESS_SET SERVERS=FILE_SERVER, NETWORK_SERVER all> SHOW PROCESS SERVERS Number Name State Current PC * 1 FILE_SERVER step FS_PROG\%LINE 37 2 NETWORK_SERVER break NET_PROG\%LINE 24 all>This
DEFINE/PROCESS_SETcommand assigns the symbolic name SERVERS to the process set consisting of FILE_SERVER and NETWORK_SERVER. TheSHOW PROCESS SERVERScommand displays information about the processes that makeup the set SERVERS.all> DEFINE/PROCESS_SET G1=%PROCESS_NUMBER 1, %VISIBLE_PROCESS all> SHOW SYMBOL/DEFINED G1 defined G1 bound to: "%PROCESS_NUMBER 1, %VISIBLE_PROCESS" was defined /process_set all> DELETE G1This
DEFINE/PROCESS_SETcommand assigns the symbolic name G1 to the process set consisting of process 1 and the visible process (process 3). TheSHOW SYMBOL/DEFINED G1command identifies the defined symbol G1. TheDELETE G1command deletes the symbol from the DEFINE symbol table.all> DEFINE/PROCESS_SET A = B, C, D all> DEFINE/PROCESS_SET B = E, F, G all> DEFINE/PROCESS_SET E = I, J, A %DEBUG-E-NORECSYM, recursive PROCESS_SET symbol definition encountered at or near "A"This series of
DEFINE/PROCESS_SETcommands illustrate valid and invalid uses of the command.
DELETE
DELETE — Deletes a symbol definition that was established with the DEFINE command.
Synopsis
DELETE [symbol-name[, …]]Parameters
Specifies a symbol whose definition is to be deleted from the DEFINE symbol table. Do not
use the asterisk (*) wildcard character. Instead, use the
/ALL qualifier. Do not specify a symbol name with /ALL.
If you use the /LOCAL qualifier, the symbol specified must have been
previously defined with the DEFINE/LOCAL command. If you do not specify
/LOCAL, the symbol specified must have been previously defined with the
DEFINE command without /LOCAL.
Qualifiers
- /ALL
Deletes all global
DEFINEdefinitions. Using/ALL/LOCALdeletes all localDEFINEdefinitions associated with the current command procedure (but not the globalDEFINEdefinitions).- /LOCAL
Deletes the (local) definition of the specified symbol from the current command procedure. The symbol must have been previously defined with the
DEFINE/LOCALcommand.
Description
The DELETE command deletes either a global DEFINE symbol or a local
DEFINE symbol. A global DEFINE symbol is defined with the DEFINE command
without the /LOCAL qualifier. A local DEFINE symbol is defined in a debugger
command procedure with the DEFINE/LOCAL command, so that its definition is
confined to that command procedure.
-
DECLARE -
DEFINE -
SHOW DEFINE -
SHOW SYMBOL/DEFINED
Examples
DBG> DEFINE X = INARR, Y = OUTARR DBG> DELETE X, Y
In this example, the
DEFINEcommand defines X and Y as global symbols corresponding to INARR and OUTARR, respectively. TheDELETEcommand deletes these two symbol definitions from the global symbol table.DBG> DELETE/ALL/LOCAL
This command deletes all local symbol definitions from the current command procedure.
DELETE/KEY
DELETE/KEY — Deletes a key definition that was established with the DEFINE/KEY
command or, by default, by the debugger.
Synopsis
DELETE/KEY [key-name]Note
This command is not available in the VSI DECwindows Motif for OpenVMS user interface to the debugger.
Parameters
/ALL qualifier. Do
not specify a key name with /ALL. Valid key names are as follows: |
Key Name |
LK201 Keyboard |
VT100-type |
VT52-type |
|---|---|---|---|
|
PF1 |
PF1 |
PF1 |
Blue |
|
PF2 |
PF2 |
PF2 |
Red |
|
PF3 |
PF3 |
PF3 |
Black |
|
PF4 |
PF4 |
PF4 | |
|
KP0--KP9 |
Keypad 0--9 |
Keypad 0--9 |
Keypad 0--9 |
|
PERIOD |
Keypad period (.) |
Keypad period (.) | |
|
COMMA |
Keypad comma (, ) |
Keypad comma (, ) | |
|
ENTER |
Enter |
ENTER |
ENTER |
|
E1 |
Find | ||
|
E2 |
Insert Here | ||
|
E3 |
Remove | ||
|
E4 |
Select | ||
|
E5 |
Prev Screen | ||
|
E6 |
Next Screen | ||
|
HELP |
Help | ||
|
DO |
Do | ||
|
F6--F20 |
F6--F20 |
Qualifiers
- /ALL
Deletes all key definitions in the specified state. If you do not specify a state, all key definitions in the current state are deleted. To specify one or more states, use
/STATE=.state-name- /LOG (default)
/NOLOG Controls whether a message is displayed indicating that the specified key definitions have been deleted. The
/LOGqualifier (which is the default) displays the message. The/NOLOGqualifier suppresses the message.- /STATE=(state-name [, …])
/NOSTATE (default) Selects one or more states for which a key definition is to be deleted. The
/STATEqualifier deletes key definitions for the specified states. You can specify predefined key states, such as DEFAULT and GOLD, or user-defined states. A state name can be any appropriate alphanumeric string. The/NOSTATEqualifier deletes the key definition for the current state only.By default, the current key state is the DEFAULT state. The current state can be changed with the
SET KEY/STATEcommand, or by pressing a key that causes a state change (a key that was defined withDEFINE/KEY/LOCK_STATE/SET_STATE).
Description
The DELETE/KEY command is like the DCL command
DELETE/KEY.
Keypad mode must be enabled (SET MODE KEYPAD) before you can use this
command. Keypad mode is enabled by default.
-
DEFINE/KEY - (
SET,SHOW)KEY
Examples
DBG> DELETE/KEY KP4 %DEBUG-I-DELKEY, DEFAULT key KP4 has been deleted
This command deletes the key definition for KP4 in the state last set by the
SET KEYcommand (by default, this is the DEFAULT state).DBG> DELETE/KEY/STATE=(BLUE, RED) COMMA %DEBUG-I-DELKEY, BLUE key COMMA has been deleted %DEBUG-I-DELKEY, RED key COMMA has been deleted
This command deletes the key definition for the COMMA key in the BLUE and RED states.
DEPOSIT
DEPOSIT — Changes the value of a program variable. More generally, deposits a new value at the
location denoted by an address expression.
Synopsis
DEPOSIT [address-expression = language-expression]Parameters
Specifies the location into which the value of the language expression is to be deposited. With high-level languages, this is typically the name of a variable and can include a path name to specify the variable uniquely. More generally, an address expression can also be a memory address or a register and can be composed of numbers (offsets) and symbols, as well as one or more operators, operands, or delimiters. For information about the debugger symbols for the registers and about the operators you can use in address expressions, see the Built_in_Symbols and Address_Expressions help topics.
You cannot specify an entire aggregate variable (a composite data structure such as an array or a record). To specify an individual array element or are cord component, follow the syntax of the current language.
Specifies the value to be deposited. You can specify any language expression that is valid in the current language. For most languages, the expression can include the names of simple (non composite, single-valued) variables but not the names of aggregate variables (such as arrays or records). If the expression contains symbols with different compiler-generated types, the debugger uses the rules of the current language to evaluate the expression.
If the expression is an ASCII string or an assembly-language instruction, you must enclose it in quotation marks (") or apostrophes ('). If the string contains quotation marks or apostrophes, use the other delimiter to enclose the string.
If the string has more characters (1-byte ASCII) than can fit into the program location denoted by the address expression, the debugger truncates the extra characters from the right. If the string has fewer characters, the debugger pads the remaining characters to the right of the string by inserting ASCII space characters.
Qualifiers
- /ASCIC
/AC Deposits a counted ASCII string into the specified location. You must specify a quoted string on the right-hand side of the equal sign. The deposited string is preceded by a 1-byte count field that gives the length of the string.
- /ASCID
/AD Deposits an ASCII string into the address given by a string descriptor that is at the specified location. You must specify a quoted string on the right-hand side of the equal sign. The specified location must contain a string descriptor. If the string lengths do not match, the string is either truncated on the right or padded with space characters on the right.
- /ASCII:n
Deposits
nbytes of an ASCII string into the specified location. You must specify a quoted string on the right-hand side of the equal sign. If its length is notn, the string is truncated or padded with space characters on the right. If you omitn, the actual length of the data item at the specified location is used.- /ASCIW
/AW Deposits a counted ASCII string into the specified location. You must specify a quoted string on the right-hand side of the equal sign. The deposited string is preceded by a 2-byte count field that gives the length of the string.
- /ASCIZ
/AZ Deposits a zero-terminated ASCII string into the specified location. You must specify a quoted string on the right-hand side of the equal sign. The deposited string is terminated by a zero byte that indicates the end of the string.
- /BYTE
- /D_FLOAT
Converts the expression on the right-hand side of the equal sign to the D_floating type (length 8 bytes) and deposits the result into the specified location.
- /DATE_TIME
- /EXTENDED_FLOAT
/X_FLOAT (Alpha only) Converts the expression on the right-hand side of the equal sign to the IEEE X_floating type (length 16 bytes) and deposits the result into the specified location.
- /FLOAT
On Alpha, converts the expression on the right-hand side of the equal sign to the IEEE T_floating type (double precision, length 8 bytes) and deposits the result into the specified location.
- /G_FLOAT
Converts the expression on the right-hand side of the equal sign to the G_floating type (length 8 bytes) and deposits the result into the specified location.
- /LONG_FLOAT
/S_FLOAT (Integrity servers and Alpha only) Converts the expression on the right-hand side of the equal sign to the IEEE S_floating type (single precision, length 4 bytes) and deposits the result into the specified location.
- /LONG_LONG_FLOAT
/T_FLOAT (Integrity servers and Alpha only) Converts the expression on the right-hand side of the equal sign to the IEEE T_floating type (double precision, length 8 bytes) and deposits the result into the specified location.
- /LONGWORD
Deposits a longword integer (length 4 bytes) into the specified location.
- /OCTAWORD
Deposits an octaword integer (length 16 bytes) into the specified location.
- /PACKED:n
Converts the expression on the right-hand side of the equal sign to a packed decimal representation and deposits the resulting value into the specified location. The value of
nis the number of decimal digits. Each digit occupies one nibble (4 bits).- /QUADWORD
Deposits a quadword integer (length 8 bytes) into the specified location.
- /TASK
Applies to tasking (multithread) programs. Deposits a task value (a task name or a task ID such as %TASK 3) into the specified location. The deposited value must be a valid task value.
- /TYPE=(name)
Converts the expression to be deposited to the type denoted by
name(which must be the name of a variable or data type declared in the program), then deposits the resulting value into the specified location. This enables you to specify a user-declared type. You must use parentheses around the type expression.- /WCHAR_T[:n]
Deposits up to n longwords (n characters) of a converted multibyte file code sequence into the specified location. The default is 1 longword. You must specify a string on the right-hand side of the equal sign.
When converting the specified string, the debugger uses the locale database of the process in which the debugger runs. The default is C locale.
- /WORD
Deposits a word integer (length 2 bytes) into the specified location.
Description
You can use the DEPOSIT command to change the contents of any memory
location or register that is accessible in your program. For high-level languages the command is
used mostly to change the value of a variable (an integer, real, string, array, record, and so
on).
The DEPOSIT command is like an assignment statement in most programming
languages. The value of the expression specified to the right of the equal sign is assigned to
the variable or other location specified to the left of the equal sign. For Ada and Pascal, you
can use ":=" instead of "= " in the command syntax.
Variable names. When specifying a variable with the
DEPOSITcommand, use the same syntax that is used in the source code.Routine names, labels, and line numbers.
DEPOSIT command, the debugger takes the
following actions: It evaluates the address expression specified to the left of the equal sign, to yield a program location.
If the program location has a symbolic name, the debugger associates the location with the symbol's compiler-generated type. If the location does not have a symbolic name (and, therefore, no associated compiler-generated type) the debugger associates the location with the type longword integer by default. This means that, by default, you can deposit integer values that do not exceed 4 bytes into these locations.
It evaluates the language expression specified to the right of the equal sign, in the syntax of the current language and in the current radix, to yield a value. The current language is the language last established with the
SET LANGUAGEcommand. By default, if you did not enter aSET LANGUAGEcommand, the current language is the language of the module containing the main program.It checks that the value and type of the language expression is consistent with the type of the address expression. If you try to deposit a value that is incompatible with the type of the address expression, the debugger issues a diagnostic message. If the value is compatible, the debugger deposits the value into the location denoted by the address expression.
The debugger might do type conversion during a deposit operation if the language rules allow it. For example, a real value specified to the right of the equal sign might be converted to an integer value if it is being deposited into a location with an integer type. In general, the debugger tries to follow the assignment rules for the current language.
To change the default type for all locations that do nothave a symbolic name, you can specify a new type with the
SET TYPEcommand.To change the default type for all locations (both those that do and do not have a symbolic name), you can specify a new type with the
SET TYPE/OVERRIDEcommand.To override the type currently associated with a particular location for the duration of a single
DEPOSITcommand, you can specify a new type by using a qualifier (/ASCII:,n/BYTE,/TYPE=(), and so on).name
DEPOSIT/TYPE command if the type specified is a mixed or lowercase name. For
example, suppose the program has a function like the
following:xyzzy_type foo (){xyzzy_type z;z = get_z ();return (z);}DBG> DEPOSIT/TYPE=(xyzzy_type) z="whatever"
The debugger can interpret and display integer data in any one of four radixes: binary, decimal, hexadecimal, and octal.
The default radix for both data entry and display is decimal for most languages. The exceptions are BLISS and MACRO, which have a default radix of hexadecimal.
You can use the SET RADIX and SET RADIX/OVERRIDE
commands to change the default radix.
The DEPOSIT command sets the current entity built-in symbols %CURLOC and
period (.) to the location denoted by the address expression specified. Logical
predecessors (%PREVLOC or the circumflex character (^)) and successors
(%NEXTLOC) are based on the value of the current entity.
-
CANCEL TYPE/OVERRIDE -
EVALUATE -
EXAMINE -
MONITOR - (
SET,SHOW,CANCEL) RADIX - (
SET,SHOW)TYPE
Examples
DBG> DEPOSIT I = 7
This command deposits the value 7 into the integer variable I.
DBG> DEPOSIT WIDTH = CURRENT_WIDTH + 24.80
This command deposits the value of the expression CURRENT_WIDTH + 24.80 into the real variable WIDTH.
DBG> DEPOSIT STATUS = FALSE
This command deposits the value FALSE into the Boolean variable STATUS.
DBG> DEPOSIT PART_NUMBER = "WG-7619.3-84"
This command deposits the string WG-7619.3-84 into the string variable
PART_NUMBER.DBG> DEPOSIT EMPLOYEE.ZIPCODE = 02172
This command deposits the value 02172 into component ZIPCODE of record EMPLOYEE.
DBG> DEPOSIT ARR(8) = 35 DBG> DEPOSIT ^ = 14
In this example, the first
DEPOSITcommand deposits the value 35 into element 8 of array ARR. As a result, element 8 becomes the current entity. The second command deposits the value 14 into the logical predecessor of element 8, namely element 7.DBG> FOR I = 1 TO 4 DO (DEPOSIT ARR(I) = 0)
This command deposits the value 0 into elements 1 to 4 of array ARR.
DBG> DEPOSIT COLOR = 3 %DEBUG-E-OPTNOTALLOW, operator "DEPOSIT" not allowed on given data typeThe debugger alerts you when you try to deposit data of the wrong type into a variable (in this case, if you try to deposit an integer value into an enumerated type variable). The E (error) message severity indicates that the debugger does not make the assignment.
DBG> DEPOSIT VOLUME = - 100 %DEBUG-I-IVALOUTBNDS, value assigned is out of bounds at or near '-'The debugger alerts you when you try to deposit an out-of-bounds value into a variable (in this case a negative value). The I (informational) message severity indicates that the debugger does make the assignment.
DBG> DEPOSIT/BYTE WORK = %HEX 21
This command deposits the expression %HEX 21 into location WORK and converts it to a byte integer.
DBG> DEPOSIT/OCTAWORD BIGINT = 111222333444555
This command deposits the expression 111222333444555 into location BIGINT and converts it to an octaword integer.
DBG> DEPOSIT/FLOAT BIGFLT = 1.11949*10**35
This command converts 1.11949*10**35 to an F_floating type value and deposits it into location BIGFLT.
DBG> DEPOSIT/ASCII:10 WORK+20 = 'abcdefghij'
This command deposits the string "abcdefghij" into the location that is 20 bytes beyond that denoted by the symbol WORK.
DBG> DEPOSIT/TASK VAR = %TASK 2 DBG> EXAMINE/HEX VAR SAMPLE.VAR: 0016A040 DBG> EXAMINE/TASK VAR SAMPLE.VAR: %TASK 2 DBG>
The
DEPOSITcommand deposits the Ada task value %TASK 2 into location VAR. The subsequentEXAMINEcommands display the contents of VAR in hexadecimal format and as a task value, respectively.
DISABLE AST
DISABLE AST — Disables the delivery of asynchronous system traps (ASTs) in your program.
Synopsis
DISABLE AST []Description
The DISABLE AST command disables the delivery of ASTs in your program
and thereby prevents interrupts from occurring while the program is running. If ASTs are
delivered while the debugger is running (processing commands, and so on), they are queued and
are delivered when control is returned to the program.
ENABLE AST command reenables the delivery of ASTs, including any
pending ASTs (ASTs waiting to be delivered).Note
Any call by your program to the $SETAST system service that enables ASTs overrides a
previous DISABLE AST command.
- (
ENABLE,SHOW)AST
Example
DBG> DISABLE AST DBG> SHOW AST ASTs are disabled DBG>
The DISABLE AST command disables the delivery of ASTs in your program,
as confirmed by the SHOW AST command.
DISCONNECT
DISCONNECT — Releases a process from debugger control without terminating the process (kept
debugger only).
Synopsis
DISCONNECT [process-spec]Parameters
|
[%PROCESS_NAME] |
The process name, if that name does not contain spaces or lowercase characters. The process name can include the asterisk (*) wildcard character. |
|
[%PROCESS_NAME] " |
The process name, if that name contains spaces or lowercase characters. You can also use apostrophes (') instead of quotation marks ("). |
|
%PROCESS_PID |
The process identifier (PID, a hexadecimal number). |
|
[%PROCESS_NUMBER] |
The number assigned to a process when it comes under debugger control. A new number
is assigned sequentially, starting with 1, to each process. If a process is terminated
with the |
|
|
A symbol defined with the |
|
%NEXT_PROCESS |
The next process after the visible process in the debugger's circular process list. |
|
%PREVIOUS_PROCESS |
The process previous to the visible process in the debugger's circular process list. |
|
%VISIBLE_PROCESS |
The process whose stack, register set, and images are the current context for looking up symbols, register values, routine calls, breakpoints, and so on. |
Description
DISCONNECT command releases a specified
process from debugger control without terminating the process. This is useful if, for example,
you have brought a running program under debugger control with a CONNECT
command and you now want to release it without terminating the image. (In contrast, when you
specify a process with the EXIT or QUIT command, the
process is terminated.) Caution
The debugger kernel runs in the same process as the image being debugged. If you issue
the DISCONNECT command for this process, you release your process, but the
kernel remains activated.
This activation continues until the program image finishes running.
If you install a new version of the debugger while one or more disconnected but activated kernels inhabit user program space, you can experience problems with debugger behavior if you try to reconnect to one of those kernels.
-
EXIT -
QUIT -
CONNECT
Example
DBG> DISCONNECT JONES
This command releases process JONES from debugger control without terminating the process.
DISPLAY
DISPLAY — Creates a new screen display or modifies an existing display.
Synopsis
DISPLAY [display-name [AT window-spec]
[display-kind]
[, …]]Note
This command is not available in the VSI DECwindows Motif for OpenVMS user interface to the debugger.
Parameters
Specifies the display to be created or modified.
If you are creating a new display, specify a name that is not already used as a display name.
- A predefined display:
-
SRC -
OUT -
PROMPT -
INST -
REG -
FREG(Integrity servers and Alpha only) -
IREG
-
A display previously created with the
DISPLAYcommand- A display built-in symbol:
- %CURDISP
- %CURSCROLL
- %NEXTDISP
- %NEXTINST
- %NEXTOUTPUT
- %NEXTSCROLL
- %NEXTSOURCE
You must specify a display unless you use /GENERATE (parameter
optional), or /REFRESH (parameter not allowed).
You can specify more than one display, each with an optional window specification and display kind.
A predefined window. For example, RH1 (right top half).
A window definition previously established with the SET WINDOW command.
A window specification of the form (
start-line, line-count[, start-column, column-count]). The specification can include expressions which can be based on the built-in symbols %PAGE and %WIDTH(for example, %WIDTH/4).
If you are specifying an existing display, the position of the display is not changed.
If you are specifying a new display, it is positioned at window H1 orH2, alternating between H1 and H2 each time you create another display.
|
DO ( |
Specifies an automatically updated output display. The commands are executed in the order listed each time the debugger gains control. Their output forms the contents of the display. If you specify more than one command, the commands must be separated by semicolons. |
|
INSTRUCTION |
Specifies an instruction display. If selected as the current instruction display with
the |
|
OUTPUT |
Specifies an output display. If selected as the current output display with the
|
|
REGISTER |
Specifies an automatically updated register display. The display is updated each time the debugger gains control. |
|
SOURCE |
Specifies a source display. If selected as the current source display with the
|
|
SOURCE ( |
Specifies an automatically updated source display. The command specified must be a
|
You cannot change the display kind of the PROMPT display.
display-kind parameter, the display kind depends on
whether you are specifying an existing display or a new display:If you specify an existing display, the display kind is not changed.
If you specify a new display, an OUTPUT display is created.
Qualifiers
- /CLEAR
Erases the entire contents of a specified display. Do not use this qualifier with
/GENERATEor when creating a new display.- /DYNAMIC (default)
/NODYNAMIC Controls whether a display automatically adjusts its window dimensions proportionally when the screen height or width is changed by a
SET TERMINALcommand. By default (/DYNAMIC), all user-defined and predefined displays adjust their dimensions automatically.- /GENERATE
Regenerates the contents of a specified display. Only automatically generated displays are regenerated. These include
DOdisplays, register displays, source (cmd-list) displays, and instruction (cmd-list) displays. The debugger automatically regenerates all these kinds of displays before each prompt. If you do not specify a display, it regenerates the contents of all automatically generated displays. Do not use this qualifier with/CLEARor when creating a new display.- /HIDE
Places a specified display at the bottom of the display pasteboard (same as
/PUSH). This hides the specified display behind any other displays that share the same region of the screen. You cannot hide the PROMPT display.- /MARK_CHANGE
/NOMARK_CHANGE (default) Controls whether the lines that change in a DO display each time it is automatically updated are marked. Not applicable to other kinds of displays.
When you use
/MARK_CHANGE, any lines in which some contents have changed since the last time the display was updated are highlighted in reverse video. This qualifier is particularly useful when you want any variables in an automatically updated display to be highlighted when they change.The
/NOMARK_CHANGEqualifier (default) specifies that any lines that change in DO displays are not to be marked. This qualifier cancels the effect of a previous/MARK_CHANGEon the specified display.- /POP (default)
/NOPOP Controls whether a specified display is placed at the top of the display pasteboard, ahead of any other displays but behind the PROMPT display. By default (
/POP), the display is placed at the top of the pasteboard and hides any other displays that share the same region of the screen, except the PROMPT display.The
/NOPOPqualifier preserves the order of all displays on the pasteboard (same as/NOPUSH).- /PROCESS[=(process-spec)]
/NOPROCESS (default) Used only when debugging multiprocess programs (kept debugger only). Controls whether the specified display is process specific(that is, whether the specified display is associated only with a particular process). The contents of a process-specific display are generated and modified in the context of that process. You can make any display process specific, except the PROMPT display.
The/PROCESS=(qualifier causes the specified display to be associated with the specified process. You must include the parentheses. Use any of the followingprocess-spec)process-specforms:[%PROCESS_NAME]
proc-nameThe process name, if that name contains no space or lowercase characters. The process name can include the asterisk (*) wildcard character.
[%PROCESS_NAME] "
proc-name"The process name, if that name contains space or lowercase characters. You can also use apostrophes (') instead of quotation marks (").
%PROCESS_PID
proc-idThe process identifier (PID, a hexadecimal number).
%PROCESS_NUMBER
proc-number(or %PROCproc-number)The number assigned to a process when it comes under debugger control. Process numbers appear in a
SHOW PROCESSdisplay.proc-group-nameA symbol defined with the
DEFINE/PROCESS_GROUPcommand to represent a group of processes. Do not specify a recursive symbol definition.%NEXT_PROCESS
The process after the visible process in the debugger's circular process list.
%PREVIOUS_PROCESS
The process previous to the visible process in the debugger's circular process list.
%VISIBLE_PROCESS
The process whose call stack, register set, and images are the current context for looking up symbols, register values, routine calls, breakpoints, and so on.
The
/PROCESSqualifier causes the specified display to be associated with the process that was the visible process when theDISPLAY/PROCESScommand was executed.The
/NOPROCESSqualifier (which is the default) causes the specified display to be associated with the visible process, which might change during program execution.If you do not specify
/PROCESS, the current process-specific behavior (if any) of the specified display remains unchanged.- /PUSH
/NOPUSH The /PUSH qualifier has the same effect as
/HIDE. The/NOPUSHqualifier preserves the order of all displays on the pasteboard (same as/NOPOP).- /REFRESH
Refreshes the terminal screen. Do not specify any command parameters with this qualifier. You can also use
Ctrl/Wto refresh the screen.- /REMOVE
Marks the display as being removed from the display pasteboard, so it is not shown on the screen unless you explicitly request it with another
DISPLAYcommand. Although a removed display is not visible on the screen, it still exists and its contents are preserved. You cannot remove the PROMPT display.- /SIZE:n
- Sets the maximum size of a display to
nlines. If more thannlines are written to the display, the oldest lines are lost as the new lines are added. If you omit this qualifier, the maximum size of the display is as follows:If you specify an existing display, the maximum size is unchanged.
If you are creating a display, the default size is 64 lines.
For an output or DO display,
/SIZE:specifies that the display should hold thennmost recent lines of output. For a source or instruction display,ngives the number of source lines or lines of instructions that can be placed in the memory buffer at any onetime. However, you can scroll a source display over the entire source code of the module whose code is displayed (source lines are paged into the buffer as needed). Similarly, you can scroll an instruction display overall of the instructions of the routine whose instructions are displayed (instructions are decoded from the image as needed).
Description
You can use the DISPLAY command to create a display or to modify
an existing display.
To create a display, specify a name that is not already used as a display name (the
SHOW DISPLAY command identifies all existing displays).
By default, the DISPLAY command places a specified display on top of the
display pasteboard, ahead of any other displays but behind the PROMPT display, which cannot be
hidden. The specified display thus hides the portions of other displays (except the PROMPT
display) that share the same region of the screen.
For a list of the key definitions associated with the DISPLAY command,
type Help Keypad_Definitions_CI. Also, use the SHOW
KEY command to determine the current key definitions.
-
Ctrl/W -
EXPAND -
MOVE -
SET PROMPT - (
SET,SHOW)TERMINAL - (
SET,SHOW,CANCEL)WINDOW -
SELECT - (
SHOW,CANCEL)DISPLAY
Examples
DBG> DISPLAY REG
This command shows the predefined register display, REG, at its current window location.
DBG> DISPLAY/PUSH INST
This command pushes display INST to the bottom of the display pasteboard, behind all other displays.
DBG> DISPLAY NEWDISP AT RT2 DBG> SELECT/INPUT NEWDISP
In this example, the
DISPLAYcommand shows the user-defined display NEWDISP at the right middle third of the screen. TheSELECT/INPUTcommand selects NEWDISP as the current input display. NEWDISP now echoes debugger input.DBG> DISPLAY DISP2 AT RS45 DBG> SELECT/OUTPUT DISP2
In this example, the
DISPLAYcommand creates a display named DISP2 essentially at the right bottom half of the screen, above the PROMPT display, which is located at S6. This is an output display by default. TheSELECT/OUTPUTcommand then selects DISP2 as the current output display.DBG> SET WINDOW TOP AT (1, 8, 45, 30) DBG> DISPLAY NEWINST AT TOP INSTRUCTION DBG> SELECT/INST NEWINST
In this example, the
SET WINDOWcommand creates a window named TOP starting at line 1 and column 45, and extending down for 8 lines and to the right for 30 columns. TheDISPLAYcommand creates an instruction display named NEWINST to be displayed through TOP. TheSELECT/INSTcommand selects NEWINST as the current instruction display.DBG> DISPLAY CALLS AT Q3 DO (SHOW CALLS)
This command creates a DO display named CALLS at window Q3. Each time the debugger gains control from the program, the
SHOW CALLScommand is executed and the output is displayed in display CALLS, replacing any previous contents.DBG> DISPLAY/MARK EXAM AT Q2 DO (EXAMINE A, B, C)
This command creates a DO display named EXAM at window Q2. The display shows the current values of variables A, B, and C whenever the debugger prompts for input. Any changed values are highlighted.
all> DISPLAY/PROCESS OUT_X AT S4
This command makes display OUT_X specific to the visible process (process 3) and puts the display at window S4.
DUMP
DUMP — Displays the contents of memory.
Synopsis
DUMP [address-expression1 [:address-expression2]]Parameters
Specifies the first memory location to be displayed.
Specifies the last memory location to be displayed (default is address-expression 1).
Qualifiers
- /BINARY
- /BYTE
Displays each examined entity as a byte integer (length 1 byte).
- /DECIMAL
- /HEXADECIMAL
- /LONGWORD (default)
Displays each examined entity in the longword integer type (length 4 bytes). This is the default type for program locations that do not have a compiler-generated type.
- /OCTAL
- /QUADWORD
Displays each examined entity in the quadword integer type (length 8 bytes).
- /WORD
Displays each examined entity in the word integer type (length 2 bytes).
Description
The DUMP command displays the contents of memory, including registers,
variables, and arrays. The DUMP command formats its output in a manner
similar to the DCL command DUMP. The debugger DUMP command
makes no attempt to interpret the structure of aggregates.
DUMP command, the debugger evaluates
address-expression 1 to yield a program location. The debugger then
displays the entity stored at that location as follows:If the entity has a symbolic name, the debugger uses the size of the entity to determine the address range to display.
If the entity does not have a symbolic name (and, therefore, no associated compiler-generated type) the debugger displays
address-expression1throughaddress-expression2(if specified).
In either case, the DUMP command displays the contents of these
locations as longword (by default) integer values in the current radix.
The default radix for display is decimal for most languages. The exceptions are BLISS and MACRO, which have a default radix of hexadecimal.
Use one of the four radix qualifiers (/BINARY,
/DECIMAL, /HEXADECIMAL, /OCTAL) to
display data in another radix. You can also use the SET RADIX and
SET RADIX/OVERRIDE commands to change the default radix.
Use one of the size qualifiers (/BYTE, /WORD,
/LONGWORD, /QUADWORD) to change the format of the
display.
The DUMP command sets the current entity built-in symbols %CURLOC and
period (.) to the location denoted by the address expression specified. Logical
predecessors (%PREVLOC or the circumflex character (^)) and successors
(%NEXTLOC) are based on the value of the current entity.
-
EXAMINE
Examples
DBG> DUMP/QUAD R16:R25 0000000000000078 0000000000030038 8.......x....... %R16 000000202020786B 0000000000030041 A.......kx ... %R18 0000000000030140 0000000000007800 .x......@....... %R20 0000000000010038 0000000000000007 ........8....... %R22 0000000000000006 0000000000000000 ................ %R24 DBG>
This command displays general registers R16 through R25 in quadword format and hexadecimal radix.
DBG> DUMP APPLES 00000000 00030048 00000000 00004220 B......H....... 00000000000300B0 63724F20 746E6F6D 646F6F57 000041B0 �A..Woodmont Orc 00000000000300C0 20202020 20202020 20202073 64726168 hards 00000000000300D0 6166202C 73646E61 6C747275 6F432020 Courtlands, fa 00000000000300E0 00002020 2079636E ncy .. 00000000000300F0 DBG>This command displays an entity named APPLES in longword format and hexadecimal radix.
DBG> DUMP/BYTE/DECIMAL 30000:30040 0 0 0 0 0 3 0 -80 �....... 0000000000030000 0 0 0 0 0 3 1 64 @....... 0000000000030008 0 0 0 0 0 3 0 48 0....... 0000000000030010 0 0 0 0 0 3 0 56 8....... 0000000000030018 0 0 0 0 0 3 0 -64 �....... 0000000000030020 0 0 0 0 0 3 0 -80 �....... 0000000000030028 0 0 0 0 0 0 7 -50 �....... 0000000000030030 101 101 119 32 116 120 101 110 next wee 0000000000030038 107 k 0000000000030040 DBG>This command displays locations 30000 through 30040 in byte format and decimal radix.
EDIT
EDIT — Starts the editor established with the SET EDITOR command. If you
did not enter a SET EDITOR command, starts the Language-Sensitive Editor
(LSE), if that editor is installed on your system.
Synopsis
EDIT [[module-name \] line-number]Parameters
Specifies the name of the module whose source file is to be edited. If you specify a module name, you must also specify a line number. If you omit the module name parameter, the source file whose code appears in the current source display is chosen for editing.
A positive integer that specifies the source line on which the editor's cursor is initially
placed. If you omit this parameter, the cursor is initially positioned at the beginning of the
source line that is centered in the debugger's current source display, or at the beginning of
line 1 if the editor was set to /NOSTART_POSITION (see the SET
EDITOR command.)
Qualifiers
- /EXIT
/NOEXIT (default) Controls whether you end the debugging session prior to starting the editor. If you specify
/EXIT, the debugging session is terminated and the editor is then started. If you specify/NOEXIT, the editing session is started and you return to your debugging session after terminating the editing session.
Description
If you have not specified an editor with the SET EDITOR command, the
EDIT command starts the Language-Sensitive Editor (LSE) in a spawned
subprocess (if LSE is installed on your system). The typical (default)way to use the
EDIT command is not to specify any parameters. In this case, the editing
cursor is initially positioned at the beginning of the line that is centered in the currently
selected debugger source display (the current source display).
The SET EDITOR command provides options for starting different editors,
either in a subprocess or through a callable interface.
- (
SET,SHOW)EDITOR - (
SET,SHOW,CANCEL)SOURCE
Examples
DBG> EDIT
This command spawns the Language-Sensitive Editor (LSE) in a subprocess to edit the source file whose code appears in the current source display. The editing cursor is positioned at the beginning of the line that was centered in the source display.
DBG> EDIT SWAP\12
This command spawns the Language-Sensitive Editor (LSE) in a subprocess to edit the source file containing the module SWAP. The editing cursor is positioned at the beginning of source line 12.
DBG> SET EDITOR/CALLABLE_EDT DBG> EDIT
In this example, the
SET EDITOR/CALLABLE_EDTcommand establishes that EDT is the default editor and is started through its callable interface (rather than spawned in a subprocess). TheEDITcommand starts EDT to edit the source file whose code appears in the current source display. The editing cursor is positioned at the beginning of source line 1, because the default qualifier/NOSTART_POSITIONapplies to EDT.
ENABLE AST
ENABLE AST — Enables the delivery of asynchronous system traps (ASTs) in your
program.
Synopsis
ENABLE AST Description
ENABLE AST command enables the delivery of ASTs while your program
is running, including any pending ASTs (ASTs waiting to be delivered). If ASTs are delivered
while the debugger is running (processing commands, and soon), they are queued and are delivered
when control is returned to the program. Delivery of ASTs in your program is initially enabled
by default.Note
Any call by your program to the $SETAST system service that disables ASTs overrides a
previous ENABLE AST command.
- (
DISABLE,SHOW)AST
Example
DBG> ENABLE AST DBG> SHOW AST ASTs are enabled DBG>
The ENABLE AST command enables the delivery of ASTs in your program, as
confirmed with the SHOW AST command.
EVALUATE
EVALUATE — Displays the value of a language expression in the current language (by default, the
language of the module containing the main program).
Synopsis
EVALUATE [language-expression[, …]]Parameters
Specifies any valid expression in the current language.
Qualifiers
- /BINARY
- /CONDITION_VALUE
Specifies that the expression be interpreted as a condition value (the kind of condition value you would specify using the condition-handling mechanism). The message text corresponding to that condition value is then displayed. The specified value must be an integer value.
- /DECIMAL
- /HEXADECIMAL
Specifies that the result be displayed in hexadecimal radix.
- /OCTAL
Description
The debugger interprets the expression specified in an EVALUATE command
as a language expression, evaluates it in the syntax of the current language and in the current
radix, and displays its value as a literal (for example, an integer value) in the current
language.
The current language is the language last established with the SET
LANGUAGE command. If you did not enter a SET LANGUAGE command, the
current language is, by default, the language of the module containing the main program.
If an expression contains symbols with different compiler-generated types, the debugger uses the type-conversion rules of the current language to evaluate the expression.
The debugger can interpret and display integer data in any one of four radixes: binary,
decimal, hexadecimal, and octal. The current radix is the radix last established with the
SET RADIX command.
If you did not enter a SET RADIX command, the default radix for both
data entry and display is decimal for most languages. The exceptions are BLISS and MACRO, which
have a default radix of hexadecimal.
You can use a radix qualifier (/BINARY, /OCTAL, and
so on) to display integer data in another radix. These qualifiers do not affect how the debugger
interprets the data you specify;they override the current output radix, but not the input
radix.
The EVALUATE command sets the current value of built-in symbols
%CURVAL and backslash (\) to the value denoted by the specified expression.
You cannot evaluate a language expression that includes a function call. For example, if
PRODUCT is a function that multiplies two integers, you cannot use the command EVALUATE PRODUCT
(3, 5). If your program assigns the returned value of a function to a variable, you can examine
the resulting value of that variable. On Alpha, the command EVALUATE
displays the procedure descriptor address
(not the code address) of a specified routine, entry point, or Ada package. procedure-name
For more information about debugger support for language-specific operators and constructs, type HELP Language.
-
EVALUATE/ADDRESS -
MONITOR - (
SET,SHOW)LANGUAGE - (
SET,SHOW,CANCEL)RADIX - (
SET,SHOW)TYPE
Examples
DBG> EVALUATE 100.34 * (14.2 + 7.9) 2217.514 DBG>
This command uses the debugger as a calculator by multiplying 100.34 by (14.2+ 7.9).
DBG> EVALUATE/OCTAL X 00000001512 DBG>
This command evaluates the symbol X and displays the result in octal radix.
DBG> EVALUATE TOTAL + CURR_AMOUNT 8247.20 DBG>
This command evaluates the sum of the values of two real variables, TOTAL and CURR_AMOUNT.
DBG> DEPOSIT WILLING = TRUE DBG> DEPOSIT ABLE = FALSE DBG> EVALUATE WILLING AND ABLE False DBG>
In this example, the
EVALUATEcommand evaluates the logical AND of the current values of two Boolean variables, WILLING and ABLE.DBG> EVALUATE COLOR'FIRST RED DBG>
In this Ada example, this command evaluates the first element of the enumeration type COLOR.
EVALUATE/ADDRESS
EVALUATE/ADDRESS — Evaluates an address expression and displays the result as a memory address or a
register name.
Synopsis
EVALUATE/ADDRESS [address-expression[, …]]Parameters
Specifies an address expression of any valid form (for example, a routine name, variable name, label, line number, and so on).
Qualifiers
Description
The EVALUATE/ADDRESS command enables you to determine the memory address
or register associated with an address expression.
The debugger can interpret and display integer data in any one of four radixes: binary, decimal, hexadecimal, and octal.
The default radix for both data entry and display is decimal for most languages. The exceptions are BLISS and MACRO, which have a default radix of hexadecimal.
You can use a radix qualifier (/BINARY, /OCTAL, and
so on) to display address values in another radix. These qualifiers do not affect how the
debugger interprets the data you specify;that is, they override the current output radix, but
not the input radix.
If the value of a variable is currently stored in a register instead of memory, the
EVALUATE/ADDRESS command identifies the register. The radix qualifiers have
no effect in that case.
The EVALUATE/ADDRESS command sets the current entity built-in symbols
%CURLOC and period (.) to the location denoted by the address expression
specified. Logical predecessors (%PREVLOC or the circumflex character (^)) and
successors (%NEXTLOC) are based on the value of the current entity.
On Alpha, the command EVALUATE/ADDRESS
displays the procedure descriptor address
(not the code address) of a specified routine, entry point, or Ada package.procedure-name
-
EVALUATE - (
SET,SHOW,CANCEL)RADIX -
SHOW SYMBOL/ADDRESS -
SYMBOLIZE
Routine names in debugger expressions have different meanings on Integrity server and Alpha systems.
On Alpha systems, the command EVALUATE/ADDRESS RTN-NAME evaluates to the
address of the procedure descriptor:
Examples
DBG> EVALUATE/ADDRESS RTN-NAME
On Integrity server systems, instead of displaying the address of the official function descriptor, the debugger just displays the code address. For example, on Alpha systems, you can enter the following command and then set a breakpoint when a variable contains the address, FOO:
DBG> SET BREAK .PC WHEN (.SOME_VARIABLE EQLA FOO)
The breakpoint occurs when the variable contains the address of the procedure descriptor. However, when you enter the same command on Integrity server systems, the breakpoint is never reached because, although the user variable might contain the address of the function descriptor for FOO, the "EQLA FOO" in the WHEN clause compares it to the code address for FOO. As a result, the user variable never contains the code address of FOO. However, the first quadword of an Integrity server function descriptor contains the code address, you can write it as:
DBG> SET BREAK .PC WHEN (..SOME_VARIABLE EQLA FOO)
Note
On Integrity server systems, you cannot copy the following line from your BLISS code:IF .SOME_VARIABLE EQLA FOO THEN do-something;
DBG> EVALUATE/ADDRESS MODNAME\%LINE 110 3942 DBG>
This command displays the memory address denoted by the address expression MODNAME \%LINE 110.
DBG> EVALUATE/ADDRESS/HEX A, B, C 000004A4000004AC000004A0 DBG>
This command displays the memory addresses denoted by the address expressions A, B, and C in hexadecimal radix.
DBG> EVALUATE/ADDRESS X MOD3\%R1 DBG>
This command indicates that variable X is associated with register R1. X is a nonstatic (register) variable.
EXAMINE
EXAMINE — Displays the current value of a program variable. More generally, displays the value
of the entity denoted by an address expression.
Synopsis
EXAMINE [address-expression[:address-expression]
[, …]]Parameters
Specifies an entity to be examined. With high-level languages, this is typically the name of a variable and can include a path name to specify the variable uniquely. More generally, an address expression can also be a memory address or a register and can be composed of numbers (offsets) and symbols, as well as one or more operators, operands, or delimiters. For information about the debugger symbols for the registers and about the operators you can use in address expressions, type Help Built_in_Symbols or Help Address_Expressions.
If you specify the name of an aggregate variable (a composite data structure such as an array or record structure) the debugger displays the values of all elements. For an array, the display shows the subscript (index) and value of each array element. For a record, the display shows the name and value of each record component.
To specify an individual array element, array slice, or record component, follow the syntax of the current language.
If you specify a range of entities, the value of the address expression that denotes the first entity in the range must be less than the value of the address expression that denotes the last entity in the range. The debugger displays the entity specified by the first address expression, the logical successor of that address expression, the next logical successor, and so on, until it displays the entity specified by the last address expression. You can specify a list of ranges by separating ranges with a comma.
For information specific to vector registers and vector instructions, see
/TMASK, /FMASK, /VMR, and
/OPERANDS qualifiers.
Qualifiers
- /ASCIC
/AC Interprets each examined entity as a counted ASCII string preceded by a1-byte count field that gives the length of the string. The string is then displayed.
- /ASCID
/AD Interprets each examined entity as the address of a string descriptor pointing to an ASCII string. The CLASS and DTYPE fields of the descriptor are not checked, but the LENGTH and POINTER fields provide the character length and address of the ASCII string. The string is then displayed.
- /ASCII:n
Interprets and displays each examined entity as an ASCII string of length
nbytes (ncharacters). If you omitn, the debugger attempts to determine a length from the type of the address expression.- /ASCIW
/AW Interprets each examined entity as a counted ASCII string preceded by a2-byte count field that gives the length of the string. The string is then displayed.
- /ASCIZ
/AZ Interprets each examined entity as a zero-terminated ASCII string. The ending zero byte indicates the end of the string. The string is then displayed.
- /BINARY
- /BYTE
Displays each examined entity in the byte integer type (length 1 byte).
- /CONDITION_VALUE
Interprets each examined entity as a condition-value return status and displays the message associated with that return status.
- /D_FLOAT
Displays each examined entity in the D_floating type (length 8 bytes).
- /DATE_TIME
Interprets each examined entity as a quadword integer (length 8 bytes)containing the internal representation of date and time. Displays the value in the format
dd-mmm-yyyy hh:mm:ss.cc.- /DECIMAL
- /DEFAULT
Displays each examined entity in the default radix.
The minimum abbreviation is
/DEFA.- /DEFINITIONS=n
(Alpha only, Integrity servers when optimized code is supported)When the code is optimized, displays
ndefinition points for a split-lifetime variable. A definition point is a location in the program where the variable could have received its value. By default, up to five definition points are displayed. If more than the given number of definitions (explicit or default) are available, then the number of additional definitions is reported as well. (For more information on split-lifetime variables, see Section 14.1.5, ''Split-Lifetime Variables''.The minimum abbreviation is
/DEFI.- /EXTENDED_FLOAT
/X_FLOAT (Integrity servers and Alpha only) Displays each examined entity in the IEEE X_floating type (length 16 bytes).
- /FLOAT
On Alpha, same as T_FLOAT. Displays each examined entity in the IEEE T_floating type (double precision, length 8 bytes).
- /FPCR
(Alpha only) Displays each examined entity in FPCR (floating-point control register) format.
- /G_FLOAT
Displays each examined entity in the G_floating type (length 8 bytes).
- /HEXADECIMAL
- /INSTRUCTION
Displays each examined entity as an assembly-language instruction(variable length, depending on the number of instruction operands and the kind of addressing modes used). See also the
/OPERANDSqualifier.In screen mode, the output of an
EXAMINE/INSTRUCTIONcommand is directed at the current instruction display, if any, not at an output or DO display. The arrow in the instruction display points to the examined instruction.On Alpha, the command
EXAMINE/INSTRUCTIONdisplays the first instruction at the code address of a specified routine, entry point, or Ada package.procedure-name- /LINE (default)
/NOLINE Controls whether program locations are displayed in terms of line numbers (%LINE
x) or asroutine-name + byte-offset. By default (/LINE), the debugger symbolizes program locations in terms of line numbers.- /LONG_FLOAT
/S_FLOAT (Integrity servers and Alpha only) Displays each examined entity in the IEEE S_floating type (single precision, length 4 bytes).
- /LONG_LONG_FLOAT
/T_FLOAT (Integrity servers and Alpha only) Displays each examined entity in the IEEE T_floating type (double precision, length 8 bytes).
- /LONGWORD
Displays each examined entity in the longword integer type (length 4 bytes). This is the default type for program locations that do not have a compiler-generated type.
- /OCTAL
- /OCTAWORD
Displays each examined entity in the octaword integer type (length 16 bytes).
- /PACKED:n
Interprets each examined entity as a packed decimal number. The value of
nis the number of decimal digits. Each digit occupies one nibble (4 bits).- /PS
(Alpha only) Displays each examined entity in PS (processor status register) format.
- /PSR
(Integrity servers only)Displays each examined entity in PSR (processor status register) format.
- /PSR
(Integrity servers only) Displays each examined entity in PSR (processor status register) format.
- /QUADWORD
Displays each examined entity in the quadword integer type (length 8 bytes).
- /S_FLOAT
(Alpha only) Displays each examined entity in the IEEE S_floating type (single precision, length 4 bytes).
- /SFPCR
(Alpha only) Displays each examined entity in SFPCR (software floating-point control register) format.
- /SOURCE
Note
This qualifier is not available in the VSI DECwindows Motif for OpenVMS user interface to the debugger.
Displays the source line corresponding to the location of each examined entity. The examined entity must be associated with a machine code instruction and, therefore, must be a line number, a label, a routine name, or the memory address of an instruction. The examined entity cannot be a variable name or any other address expression that is associated with data.
In screen mode, the output of an
EXAMINE/SOURCEcommand is directed at the current source display, if any, not at an output or DO display. The arrow in the source display points to the source line associated with the last entity specified (or the last one specified in a list of entities).On Alpha, the command
EXAMINE/SOURCEdisplays the source code at the code address of a specified routine, entry point, or Ada package.procedure-name- /SYMBOLIC (default)
/NOSYMBOLIC Controls whether symbolization occurs. By default (
/SYMBOLIC), the debugger symbolizes all addresses, if possible; that is, it converts numeric addresses into their symbolic representation. If you specify/NOSYMBOLIC, the debugger suppresses symbolization of entities you specify as absolute addresses. If you specify entities as variable names, symbolization still occurs. The/NOSYMBOLICqualifier is useful if you are interested in identifying numeric addresses rather than their symbolic names (if symbolic names exist for those addresses). Using/NOSYMBOLICmay speed up command processing because the debugger does not need to convert numbers to names.- /TASK
Applies to tasking (multithread) programs. Interprets each examined entity as a task (thread) object and displays the task value (the name or task ID) of that task object. When examining a task object, use
/TASKonly if the programming language does not have built-in tasking services.- /TYPE=(name)
/TYPE:(name)
/TYPE(name) Interprets and displays each examined entity according to the type specified by
nameand (which must be the name of a variable or data type declared in the program). This enables you to specify a user-declared type. You must use parentheses around the type expression.- /VARIANT=variant-selector address-expression
/VARIANT=(variant-selector, ...) address-expression Enables the debugger to display the correct item when it encounters an anonymous variant.
In a C program, a union contains members, only one of which is valid at any one time. When displaying a union, the debugger does not know which member is currently valid.
In a PASCAL program, a record with a variant part contains variants, only one of which is valid at any one time. When displaying a record with an anonymous variant part, the debugger does not know which variant is currently valid, and displays all variants by default.
You can use the
/VARIANTqualifier of theEXAMINEcommand to select which member of a union (C) or anonymous variant (PASCAL) to display.- /WCHAR_T[:n]
Interprets and displays each examined entity as a multibyte file code sequence of length n longwords (n characters). The default is 1 longword.
When converting the examined string, the debugger uses the locale database of the process in which the debugger runs. The default is C locale.
- /WORD
Displays each examined entity in the word integer type (length 2 bytes).
- /X_FLOAT
(Alpha and Integrity servers only) Displays each examined entity in the IEEE X_floating type (length 16 bytes).
Description
The EXAMINE command displays the entity at the location denoted by an
address expression. You can use the command to display the contents of any memory location or
register that is accessible in your program. For high-level languages, the command is used
mostly to obtain the current value of a variable (an integer, real, string, array, record, and
so on).
If you are debugging optimized code on Alpha systems, the EXAMINE
command displays the definition points at which a split-lifetime variable could have received
its value. Split-lifetime variables are discussed in Chapter 14, "Debugging Special Cases". By default,
the EXAMINE command displays up to five definition points. With the
/DEFINITIONS qualifier, you can specify the number of definition
points.
Variable names. When specifying a variable with the
EXAMINEcommand, use the same syntax that is used in the source code.Routine names, labels, and line numbers. These are associated with instructions. You can examine instructions using the same techniques as when examining variables.
EXAMINE command, the debugger evaluates
the address expression specified to yield a program location. The debugger then displays the
value stored at that location as follows:If the location has a symbolic name, the debugger formats the value according to the compiler-generated type associated with that symbol (that is, as a variable of a particular type or as an instruction).
If the location does not have a symbolic name (and, therefore, no associated compiler-generated type) the debugger formats the value in the type
longword integerby default. This means that, by default, theEXAMINEcommand displays the contents of these locations as longword (4-byte) integer values.
To change the default type for all locations that do not have a symbolic name, you can specify a new type with the
SET TYPEcommand.To change the default type for all locations (both those that do and do not have a symbolic name), you can specify a new type with the
SET TYPE/OVERRIDEcommand.To override the type currently associated with a particular location for the duration of a single
EXAMINEcommand, you can specify a new type by using a type qualifier (/ASCII:,n/BYTE,/TYPE=(), and so on). Most qualifiers for thenameEXAMINEcommand are type qualifiers.
The debugger can interpret and display integer data in any one of four radixes: binary, decimal, hexadecimal, and octal.
The default radix for both data entry and display is decimal for most languages. The exceptions are BLISS and MACRO, which have a default radix of hexadecimal.
The EXAMINE command has four radix qualifiers
(/BINARY, /DECIMAL, /HEXADECIMAL,
/OCTAL) that enable you to display data in another radix. You can also use
the SET RADIX and SET RADIX/OVERRIDE commands to change
the default radix.
EXAMINE command has
qualifiers for other purposes:The
/SOURCEqualifier enables you to identify the line of source code corresponding to a line number, routine name, label, or any other address expression that is associated with an instruction rather than data.The
/[NO]LINEand/[NO]SYMBOLICqualifiers enable you to control the symbolization of address expressions.
The EXAMINE command sets the current entity built-in symbols %CURLOC and
period (.) to the location denoted by the address expression specified. Logical
predecessors (%PREVLOC or the circumflex character (^)) and successors
(%NEXTLOC) are based on the value of the current entity.
The /VARIANT qualifier enables the debugger to display the correct item
when it encounters an anonymous variant.
In a C program, a union contains members, only one of which is valid at any one time. When displaying a union, the debugger does not know which member is currently valid. In a PASCAL program, a record with a variant part contains variants, only one of which is valid at any one time. When displaying a record with an anonymous variant part, the debugger does not know which variant is currently valid, and displays all variants by default.
/VARIANT qualifier of the EXAMINE
command to select which member of a union (C program) or anonymous variant (PASCAL program) to
display. The format is as
follows:DBG> EXAMINE /VARIANT=variant-selector address-expression DBG> EXAMINE /VARIANT=(variant-selector, ...) address-expression
NAME = name-string
DISCRIMINANT = expression
POSITION = expression
The /VARIANT qualifier takes a list of zero or more variant selectors.
/VARIANT without any variant selectors is the default: the first variant of
all anonymous variant lists will be displayed.
Each variant selector specifies either the name, the discriminant, or the position of the variant to be displayed.
If the debugger encounters an anonymous variable list while displaying address-expression, the debugger uses the variant selector to choose which variant to display.
Each time the debugger encounters an anonymous variant list, it attempts to use the next variant selector to choose which variant to display. If the variant selector matches one of the variants of the variant list (union), the debugger displays that variant.
The debugger walks the structure top-to-bottom, depth first, so that children are encountered before siblings.
If the debugger encounters an anonymous variant list and does not have a variant selector to match it with, the debugger displays the first variant.
- If the variant selector does not match any of the variants of an anonymous variant list, the debugger displays a single line to indicate that. This is similar to what the debugger does if the discriminant value fails to match any of the variants in a discriminated variant list. For example:
[Variant Record omitted - null or illegal Tag Value: 3]
A name specifies a name string. A name matches a variant if that variant contains a field with the name specified by name.
A discriminant specifies a language expression that must be type compatible with the tag type of the variant part it is meant to match. The discriminant expression matches a variant if it evaluates to a value in the variant's case-label list. Discriminants apply only to Pascal programs, because C and C++ unions do not have discriminants.
A positional-selector specifies a language expression, which should evaluate to a integer between 1 and N, where N is the number of variants in a variant list. A positional-selector that evaluates to I specifies that the Ith variant is to be displayed.
You can use asterisk (*) as a wildcard, which matches all variants of an anonymous variant list.
/VAR=D=* /VAR=N=* /VAR=P=*
EXAMINE /VARIANT=(DIS=3, DIS=1, DIS=54) x EXAMINE /VARIANT=(DIS=(3, 1, 54)) x EXAMINE /VARIANT=DIS=(3, 1, 54) x
EXAMINE /VARIANT=POS=3 EXAMINE /VARIANT=POS=(3) ! parentheses unnecessary EXAMINE /VARIANT=(POS=(3)) ! parentheses unnecessary EXAMINE /VARIANT=(POS=3) ! parentheses unnecessary EXAMINE /VARIANT=(POS=foo) ! parentheses necessary EXAMINE /VARIANT=POS=(foo) ! parentheses necessary EXAMINE /VARIANT=(POS=3-1) ! parentheses necessary
-
CANCEL TYPE/OVERRIDE -
DEPOSIT -
DUMP -
EVALUATE -
SET MODE [NO]OPERANDS -
SET MODE [NO]SYMBOLIC - (
SET,SHOW,CANCEL)RADIX - (
SET,SHOW)TYPE
Examples
DBG> EXAMINE COUNT SUB2\COUNT: 27 DBG>
This command displays the value of the integer variable COUNT in module SUB2.
DBG> EXAMINE PART_NUMBER INVENTORY\PART_NUMBER: "LP-3592.6-84" DBG>
This command displays the value of the string variable
PART_NUMBER.DBG> EXAMINE SUB1\ARR3 SUB1\ARR3 (1, 1): 27.01000 (1, 2): 31.01000 (1, 3): 12.48000 (2, 1): 15.08000 (2, 2): 22.30000 (2, 3): 18.73000 DBG>
This command displays the value of all elements in array ARR3 in module SUB1.ARR3 is a 2 by 3 element array of real numbers.
DBG> EXAMINE SUB1\ARR3(2, 1:3) SUB1\ARR3 (2, 1): 15.08000 (2, 2): 22.30000 (2, 3): 18.73000 DBG>
This command displays the value of the elements in a slice of array SUB1 \ARR3. The slice includes "columns" 1 to 3 of "row" 2.
DBG> EXAMINE VALVES.INTAKE.STATUS MONITOR\VALVES.INTAKE.STATUS: OFF DBG>
This command displays the value of the nested record component VALVES.INTAKE.STATUS in module MONITOR.
DBG> EXAMINE/SOURCE SWAP module MAIN 47: procedure SWAP(X, Y: in out INTEGER) is DBG>
This command displays the source line in which routine SWAP is declared (the location of routine SWAP).
DBG> DEPOSIT/ASCII:7 WORK+20 = 'abcdefg' DBG> EXAMINE/ASCII:7 WORK+20 DETAT\WORK+20: "abcdefg" DBG> EXAMINE/ASCII:5 WORK+20 DETAT\WORK+20: "abcde" DBG>
In this example, the
DEPOSITcommand deposits the entity 'abcdefg' as an ASCII string of length 7 bytes in to the location that is 20 bytes beyond the location denoted by the symbol WORK. The firstEXAMINEcommand displays the value of the entity at that location as an ASCII string of length 7 bytes (abcdefg). The secondEXAMINEcommand displays the value of the entity at that location as an ASCII string of length 5 bytes (abcde).DBG> EXAMINE/OPERANDS=FULL .0\%PC X\X$START+0C: mov r12 = r15 ;; DBG>
On Integrity servers, this command displays the instruction (MOV) at the current PC value. Using
/OPERANDS=FULLdisplays the maximum level of operand information.DBG> SET RADIX HEXADECIMAL DBG> EVALUATE/ADDRESS WORKDATA 0000086F DBG> EXAMINE/SYMBOLIC 0000086F MOD3\WORKDATA: 03020100 DBG> EXAMINE/NOSYMBOLIC 0000086F 0000086F: 03020100 DBG>
In this example, the
EVALUATE/ADDRESScommand indicates that the memory address of variable WORKDATA is 0000086F, hexadecimal. The twoEXAMINEcommands display the value contained at that address using/[NO]SYMBOLto control whether the address is symbolized to WORKDATA.DBG> EXAMINE/HEX FIDBLK FDEX1$MAIN\FIDBLK (1): 00000008 (2): 00000100 (3): 000000AB DBG>This command displays the value of the array variable FIDBLK in hexadecimal radix.
DBG> EXAMINE/DECIMAL/WORD NEWDATA:NEWDATA+6 SUB2\NEWDATA: 256 SUB2\NEWDATA+2: 770 SUB2\NEWDATA+4: 1284 SUB2\NEWDATA+6: 1798 DBG>
This command displays, in decimal radix, the values of word integer entities (2-byte entities) that are in the range of locations denoted by NEWDATA to NEWDATA + 6 bytes.
DBG> EXAMINE/TASK SORT_INPUT MOD3\SORT_INPUT: %TASK 12 DBG>
This command displays the task ID of a task object named SORT_INPUT.
DBG> EXAMINE /VARIANT=(NAME=m, DIS=4, POS=1) x
This command specifies that, for the first anonymous variant list encountered, display the variant part containing a field named "m", for the second anonymous variant list, display the part with the discriminant value 4, and, for the third anonymous variant list, display the first variant part.
DBG> ex %r9:%r12 TEST\%R9: 0000000000000000 TEST\%R10: 0000000000000000 TEST\%R11: 0000000000000000 TEST\%SP: 000000007AC8FB70 DBG> ex/bin grnat0 <9, 4, 0> TEST\%GRNAT0+1: 0110 DBG>
Debugger displays the string "NaT" when the integer register's NaT bit is set.
EXIT
EXIT — Ends a debugging session, or terminates one or more processes of a multiprocess
program, allowing any application-declared exit handlers to run. If used within a command
procedure or DO clause and no process is specified, it exits the command procedure or DO clause
at that point.
Synopsis
EXIT [process-spec[, …]]Parameters
|
[%PROCESS_NAME] |
The process name, if that name does not contain spaces or lowercase characters. The process name can include the asterisk (*) wildcard character. |
|
[%PROCESS_NAME] " |
The process name, if that name contains spaces or lowercase characters. You can also use apostrophes (') instead of quotation marks ("). |
|
%PROCESS_PID |
The process identifier (PID, a hexadecimal number). |
|
[%PROCESS_NUMBER] |
The number assigned to a process when it comes under debugger control. A new number
is assigned sequentially, starting with 1, to each process. If a process is terminated
with the |
|
|
A symbol defined with the |
|
%NEXT_PROCESS |
The next process after the visible process in the debugger's circular process list. |
|
%PREVIOUS_PROCESS |
The process previous to the visible process in the debugger's circular process list. |
|
%VISIBLE_PROCESS |
The process whose stack, register set, and images are the current context for looking up symbols, register values, routine calls, breakpoints, and so on. |
You can also use the asterisk (*) wildcard character to specify all processes.
Description
The EXIT command is one of the four debugger commands that can be used
to execute your program (the others are CALL, GO, and
STEP).
Ending a Debugging Session
To end a debugging session, enter the EXIT command at the debugger
prompt without specifying any parameters. This causes orderly termination of the session: the
program's application-declared exit handlers (if any) are executed, the debugger exit handler is
executed (closing log files, restoring the screen and keypad states, and so on), and control is
returned to the command interpreter. You cannot then continue to debug your program by entering
the DCL command DEBUG or CONTINUE (you must restart the
debugger).
Because EXIT runs any application-declared exit handlers, you can set
breakpoints in such exit handlers, and the breakpoints are triggered upon typing
EXIT. Thus, you can use EXIT to debug your exit handlers.
To end a debugging session without running any application-declared exit handlers, use the
QUIT command instead of EXIT.
Using the EXIT Command in Command Procedures and DO Clauses
When the debugger executes an EXIT command (without any parameters) in a
command procedure, control returns to the command stream that invoked the command procedure. A
command stream can be the terminal, an outer (containing) command procedure, or a DO clause in a
command or screen display definition. For example, if the command procedure was invoked from
within a DO clause, control returns to that DO clause, where the debugger executes the next
command (if any remain in the command sequence).
When the debugger executes an EXIT command (without any parameters) in a
DO clause, it ignores any remaining commands in that clause and displays its prompt.
Terminating Specified Processes
If you are debugging a multiprocess program you can use the EXIT command
to terminate specified processes without ending the debugging session. The same techniques and
behavior apply, whether you enter the EXIT command at the prompt or use it
within a command procedure or DO clause.
To terminate one or more processes, enter the EXIT command, specifying
these processes as parameters. This causes orderly termination of the images in these processes,
executing any application-declared exit handlers associated with these images. Subsequently, the
specified processes are no longer identified in a SHOW PROCESS/ALL display.
If any specified processes were on hold as the result of a SET PROCESS
command, the hold condition is ignored.
When the specified processes begin to exit, any unspecified process that is not on hold
begins execution. After execution is started, the way in which it continues depends on whether
you entered a SET MODE [NO]INTERRUPT command. By default (SET MODE
INTERRUPT), execution continues until it is suspended in any process. At that point,
execution is interrupted in any other processes that were executing images, and the debugger
prompts for input.
To terminate specified processes without running any application-declared exit handlers or
otherwise starting execution, use the QUIT command instead of
EXIT.
-
DISCONNECT -
@(Execute Procedure) -
Ctrl/C -
Ctrl/Y -
Ctrl/Z -
QUIT -
RERUN -
RUN -
SET ABORT_KEY -
SET MODE [NO]INTERRUPT -
SET PROCESS
Examples
DBG> EXIT $
This command ends the debugging session and returns you to DCL level.
all> EXIT %NEXT_PROCESS, JONES_3, %PROC 5 all>
This command causes orderly termination of three processes of a multiprocess program: the process after the visible process on the process list, process JONES_3, and process 5. Control is returned to the debugger after the specified processes have exited.
EXITLOOP
EXITLOOP — Exits one or more enclosing FOR, REPEAT, or WHILE loops.
Synopsis
EXITLOOP [integer]Parameters
A decimal integer that specifies the number of nested loops to exit from. The default is 1.
Description
Use the EXITLOOP command to exit one or more enclosing FOR, REPEAT, or
WHILE loops.
-
FOR -
REPEAT -
WHILE
Example
DBG> WHILE 1 DO (STEP; IF X .GT. 3 THEN EXITLOOP)
The WHILE 1 command generates an endless loop that executes a STEP
command with each iteration. After each STEP, the value of X is tested. If X
is greater than 3, the EXITLOOP command terminates the loop (Fortran
example).
EXPAND
EXPAND — Expands or contracts the window associated with a screen display.
Synopsis
EXPAND [display-name[, …]]Note
This command is not available in the VSI DECwindows Motif for OpenVMS user interface to the debugger.
Parameters
- A predefined display:
- SRC
- OUT
- PROMPT
- INST
- REG
- FREG (Integrity servers and Alpha only)
- IREG
A display previously created with the
DISPLAYcommand- A display built-in symbol:
- %CURDISP
- %CURSCROLL
- %NEXTDISP
- %NEXTINST
- %NEXTOUTPUT
- %NEXTSCROLL
- %NEXTSOURCE
If you do not specify a display, the current scrolling display, as established by the
SELECT command, is chosen.
Qualifiers
- /DOWN[:n]
Moves the bottom border of the display down by
nlines (ifnis positive) or up bynlines (ifnis negative). If you omitn, the border is moved down by 1 line.- /LEFT[:n]
Moves the left border of the display to the left by
nlines (ifnis positive) or to the right bynlines (ifnis negative). If you omitn, the border is moved to the left by 1 line.- /RIGHT[:n]
Moves the right border of the display to the right by
nlines (ifnis positive) or to the left bynlines (ifnis negative). If you omitn, the border is moved to the right by 1 line.- /UP[:n]
Moves the top border of the display up by
nlines (ifnis positive) or down bynlines (ifnis negative). If you omitn, the border is moved up by 1 line.
Description
You must specify at least one qualifier.
The EXPAND command moves one or more display-window borders according to
the qualifiers specified (/UP:,
[n]/DOWN:,
[n]RIGHT:,
[n]/LEFT:). [n]
The EXPAND command does not affect the order of a display on the display
pasteboard. Depending on the relative order of displays, the EXPAND command
can cause the specified display to hide or uncover another display or be hidden by another
display, partially or totally.
Except for the PROMPT display, any display can be contracted to the point where it disappears (at which point it is marked as "removed"). It can then be expanded from that point. Contracting a display to the point where it disappears causes it to lose any attributes that were selected for it. The PROMPT display cannot be contracted or expanded horizontally but can be contracted vertically to a height of 2 lines.
A window border can be expanded only up to the edge of the screen. The left and top window borders cannot be expanded beyond the left and top edges of the display, respectively. The right border can be expanded up to 255 columns from the left display edge. The bottom border of a source or instruction display can be expanded down only to the bottom edge of the display (to the end of the source module or routine's instructions). A register display cannot be expanded beyond its full size.
For a list of the key definitions associated with the EXPAND command,
type Help Keypad_Definitions_CI.Also, use the SHOW KEY
command to determine the current key definitions.
-
DISPLAY -
MOVE -
SELECT/SCROLL - (
SET,SHOW)TERMINAL
Examples
DBG> EXPAND/RIGHT:6
This command moves the right border of the current scrolling display to the right by 6 columns.
DBG> EXPAND/UP/RIGHT:-12 OUT2
This command moves the top border of display OUT2 up by 1 line, and the right border to the left by 12 columns.
DBG> EXPAND/DOWN:99 SRC
This command moves the bottom border of display SRC down to the bottom edge of the screen.
EXTRACT
EXTRACT — Saves the contents of screen displays in a file or creates a debugger command
procedure with all of the commands necessary to re-create the current screen state later on.
Synopsis
EXTRACT [display-name[, …]] [file-spec]Note
This command is not available in the VSI DECwindows Motif for OpenVMS user interface to the debugger.
Parameters
- A predefined display:
- SRC
- OUT
- PROMPT
- INST
- REG
- FREG (Integrity servers and Alpha only)
- IREG
A display previously created with the
DISPLAYcommand
You can use the asterisk (*) wildcard character in a display name. Do not
specify a display name with the /ALL qualifier.
Specifies the file to which the information is written. You can specify a logical name.
If you specify /SCREEN_LAYOUT, the default specification for the file is
SYS$DISK:[]DBGSCREEN.COM. Otherwise, the default specification is
SYS$DISK:[]DEBUG.TXT.
Qualifiers
- /ALL
Extracts all displays. Do not specify
/SCREEN_LAYOUTwith this qualifier.- /APPEND
Appends the information at the end of the file, rather than creating a new file. By default, a new file is created. Do not specify
/SCREEN_LAYOUTwith this qualifier.- /SCREEN_LAYOUT
Writes a file that contains the debugger commands describing the current state of the screen. This information includes the screen height and width, message wrap setting, and the position, display kind, and display attributes of every existing display. This file can then be executed with the execute procedure (@) command to reconstruct the screen at a later time. Do not specify
/ALLwith this qualifier.
Description
When you use the EXTRACT command to save the contents of a display into
a file, only those lines that are currently stored in the display's memory buffer (as determined
by the /SIZE qualifier on the DISPLAY command) are written
to the file.
You cannot extract the PROMPT display into a file.
-
DISPLAY -
SAVE
Examples
DBG> EXTRACT SRC
This command writes all the lines in display SRC into file
SYS$DISK:[]DEBUG.TXT.DBG> EXTRACT/APPEND OUT [JONES.WORK]MYFILE
This command appends all the lines in display OUT to the end of file
[JONES.WORK]MYFILE.TXT.DBG> EXTRACT/SCREEN_LAYOUT
This command writes the debugger commands needed to reconstruct the screen into file
SYS$DISK:[]DBGSCREEN.COM.
FOR
FOR — Executes a sequence of commands while incrementing a variable a specified number of
times.
Synopsis
FOR [name=expression1 TO expression2 [ BY expression3] DO (command[; …])]Parameters
Specifies the name of a count variable.
Specifies an integer or enumeration type value. The expression1 and
expression2 parameters must be of the same type.
Specifies an integer or enumeration type value. The expression1 and
expression2 parameters must be of the same type.
Specifies an integer.
Specifies a debugger command. If you specify more than one command, you must separate the commands with semicolons. At each execution, the debugger checks the syntax of any expressions in the commands and then evaluates them.
Description
FOR command depends on the value of the
expression3 parameter, as detailed in the following table: |
|
Action of the FOR Command |
|---|---|
|
Positive |
|
|
Negative |
|
|
0 |
The debugger returns an error message |
|
Omitted |
The debugger assumes it to have the value +1 |
-
EXITLOOP -
REPEAT -
WHILE
Examples
DBG> FOR I = 10 TO 1 BY -1 DO (EXAMINE A(I))
This command examines an array backwards.
DBG> FOR I = 1 TO 10 DO (DEPOSIT A(I) = 0)
This command initializes an array to zero.
GO
GO — Starts or resumes program execution.
Synopsis
GO [address-expression]Parameters
Specifies that program execution resume at the location denoted by the address expression. If you do not specify an address expression, execution resumes at the point of suspension or, in the case of debugger startup, at the image transfer address.
Description
The GO command starts program execution or resumes execution from the
point at which it is currently suspended. GO is one of the four debugger
commands that can be used to execute your program (the others are CALL,
EXIT, and STEP).
Specifying an address expression with the GO command can produce
unexpected results because it alters the normal control flow of your program. For example,
during a debugging session you can restart execution at the beginning of the program by entering
the GO %LINE 1 command. However, because the program has executed, the
contents of some variables might now be initialized differently from when you first ran the
program.
SET
BREAK/EXCEPTION or a STEP/EXCEPTION command), execution is
suspended before any application-declared condition handler is invoked. If you then resume
execution with the GO command, the behavior is as follows: Entering a
GOcommand to resume execution from the current location causes the debugger to resignal the exception. This enables you to observe which application-declared handler, if any, next handles the exception.Entering a
GOcommand to resume execution from a location other than the current location inhibits the execution of any application-declared handler for that exception.
If you are debugging a multiprocess program, the GO command is executed
in the context of the current process set. In addition, when debugging a multiprocess program,
the way in which execution continues in your process depends on whether you entered a
SET MODE [NO]INTERRUPT command or a SET MODE [NO]WAIT
command. By default (SET MODE NOINTERRUPT), when one process stops, the
debugger takes no action with regard to the other processes. Also by default (SET MODE
WAIT), the debugger waits until all process in the current process set have stopped
before prompting for a new command. See Chapter 15, "Debugging Multiprocess Programs" for more information.
-
CALL -
EXIT -
RERUN -
SET BREAK -
SET MODE [NO]INTERRUPT -
SET MODE [NO]WAIT -
SET PROCESS -
SET STEP -
SET TRACE -
SET WATCH -
STEP -
WAIT
Examples
DBG> GO … 'Normal successful completion' DBG>
This command starts program execution, which then completes successfully.
DBG> SET BREAK RESTORE DBG> GO ! start execution … break at routine INVENTORY\RESTORE137: procedure RESTORE; DBG> GO ! resume execution …In this example, the
SET BREAKcommand sets a breakpoint on routine RESTORE. The firstGOcommand starts program execution, which is then suspended at the breakpoint on routine RESTORE. The secondGOcommand resumes execution from the breakpoint.DBG> GO %LINE 42
This command resumes program execution at line 42 of the module in which execution is currently suspended.
HELP
HELP — Displays online help on debugger commands and selected topics.
Synopsis
HELP [topic [subtopic [ …]]]Note
This command is not available in the VSI DECwindows Motif for OpenVMS user interface to the debugger. Help on commands is available from the Help menu in a DECwindows debugger window.
Parameters
Specifies the name of a debugger command or topic about which you want help. You can specify the asterisk (*) wildcard character, either singly or within a name.
Specifies a subtopic, qualifier, or parameter about which you want further information. You can specify the asterisk wildcard (*), either singly or within a name.
Description
The debugger's online help facility provides the following information about any debugger command, including a description of the command, its format, explanations of any parameters that can be specified with the command, and explanations of any qualifiers that can be specified with the command.
To get information about a particular qualifier or parameter, specify it as a subtopic. If you want information about all qualifiers, specify "qualifier" as a subtopic. If you want information about all parameters, specify "parameter" as a subtopic. If you want information about all parameters, qualifiers, and any other subtopics related to a command, specify an asterisk (*) as a subtopic.
In addition to help on commands, you can get online help on various topics such as screen features, keypad mode, and so on. Topic keywords are listed along with the commands when you type HELP.
For help on the predefined keypad-key functions, type Help
Keypad_Definitions_CI. Also, use the SHOW KEY command to
determine the current key definitions.
Example
DBG> HELP GO
This command displays help for the GO command.
IF
IF — Executes a sequence of commands if a language expression (Boolean expression) is
evaluated as true.
Synopsis
IF [Boolean-expression THEN (command [; …]) [
ELSE (command [; …])]]Parameters
Specifies a language expression that evaluates as a Boolean value (true or false) in the currently set language.
Specifies a debugger command. If you specify more than one command, you must separate the commands with semicolons (;).
Description
The IF command evaluates a Boolean expression. If the value is true (as defined in the current language), the command list in the THEN clause is executed. If the expression is false, the command list in the ELSE clause (if any) is executed.
-
EXITLOOP -
FOR -
REPEAT -
WHILE
Example
DBG> SET BREAK R DO (IF X .LT. 5 THEN (GO) ELSE (EXAMINE X))
This command causes the debugger to suspend program execution at location R (a breakpoint) and then resume program execution if the value of X is less than 5 (Fortran example). If the value of X is 5 or more, its value is displayed.
MONITOR
MONITOR — Displays the current value of a program variable or language expression in the
monitor view of the VSI DECwindows Motif for OpenVMS user interface.
Synopsis
MONITOR [expression]Note
Requires the VSI DECwindows Motif for OpenVMS user interface.
Parameters
Specifies an entity to be monitored. With high-level languages, this is typically the name
of a variable. Currently, MONITOR does not handle composite expressions
(language expressions containing operators).
If you specify the name of an aggregate variable (a composite data structure such as an array or record structure), the monitor view lists "Aggregate" for the value of the variable. You can then double-click on the variable name to get the values of all the elements (see Section 10.5.4.1, ''Monitoring an Aggregate (Array or Structure) Variable '').
To specify an individual array element, array slice, or record component, follow the syntax of the current language.
Qualifiers
- /ASCIC
/AC Interprets each monitored entity as a counted ASCII string preceded by a1-byte count field that gives the length of the string. The string is then displayed.
- /ASCID
/AD Interprets each monitored entity as the address of a string descriptor pointing to an ASCII string. The CLASS and DTYPE fields of the descriptor are not checked, but the LENGTH and POINTER fields provide the character length and address of the ASCII string. The string is then displayed.
- /ASCII:n
Interprets and displays each monitored entity as an ASCII string of length
nbytes (ncharacters). If you omitn, the debugger attempts to determine a length from the type of the address expression.- /ASCIW
/AW Interprets each monitored entity as a counted ASCII string preceded by a2-byte count field that gives the length of the string. The string is then displayed.
- /ASCIZ
/AZ Interprets each monitored entity as a zero-terminated ASCII string. The ending zero byte indicates the end of the string. The string is then displayed.
- /BINARY
- /BYTE
Displays each monitored entity in the byte integer type (length 1 byte).
- /DATE_TIME
Interprets each monitored entity as a quadword integer (length 8 bytes) containing the internal OpenVMS representation of date and time. Displays the value in the format
dd-mmm-yyyy hh:mm:ss.cc.- /DECIMAL
- /DEFAULT
- /EXTENDED_FLOAT
(Integrity servers and Alpha only) Displays each monitored entity in the IEEE X_floating type (length 16 bytes).
- /FLOAT
On Alpha, displays each monitored entity in the IEEE T_floating type (double precision, length 8 bytes).
- /G_FLOAT
Displays each monitored entity in the G_floating type (length 8 bytes).
- /HEXADECIMAL
- /INSTRUCTION
Displays each monitored entity as an assembly-language instruction(variable length, depending on the number of instruction operands and the kind of addressing modes used). See also the
/OPERANDSqualifier.- /INT
Same as /LONGWORD qualifier.
- /LONG_FLOAT
(Integrity servers and Alpha only) Displays each monitored entity in the IEEE S_floating type (single precision, length 4 bytes).
- /LONG_LONG_FLOAT
(Integrity servers and Alpha only) Displays each monitored entity in the IEEE T_floating type (double precision, length 8 bytes).
- /LONGWORD
/INT
/LONG Displays each monitored entity in the longword integer type (length 4bytes). This is the default type for program locations that do not have a compiler-generated type.
- /OCTAL
- /OCTAWORD
Displays each monitored entity in the octaword integer type (length 16 bytes).
- /QUADWORD
Displays each monitored entity in the quadword integer type (length 8 bytes).
- /REMOVE
Removes a monitored item or items with the address expression specified from the Monitor View.
- /SHORT
Same as
/WORDqualifier.- /TASK
Applies to tasking (multithread) programs. Interprets each monitored entity as a task (thread) object and displays the task value (the name or task ID) of that task object. When monitoring a task object, use
/TASKonly if the programming language does not have built-in tasking services.- /WORD
/SHORT Displays each monitored entity in the word integer type (length 2 bytes).
Description
You can use the MONITOR command only with the debugger's
VSI DECwindows Motif for OpenVMS user interface, because the output of that command is directed at the monitor
view. With the command interface, you typically use the EVALUATE,
EXAMINE or SET WATCH command instead.
MONITOR command does the following:Displays the monitor view (if it is not already displayed by a previous
MONITORcommand).Puts the name of the specified variable or expression and its current value in the monitor view.
The debugger updates the monitor view whenever the debugger regains control from the program, regardless of whether the value of the variable or location you are monitoring has changed. (By contrast, a watchpoint halts execution when the value of the watched variable changes.)
For more information about the monitor view and the MONITOR command, see
Section 10.5.4, ''Monitoring a Variable ''.
-
DEPOSIT -
EVALUATE -
EXAMINE -
SET WATCH
Example
DBG> MONITOR COUNT
This command displays the name and current value of the variable COUNT in the monitor view of the debugger's VSI DECwindows Motif for OpenVMS user interface. The value is updated whenever the debugger regains control from the program.
MOVE
MOVE — Moves a screen display vertically or horizontally across the screen.
Synopsis
MOVE [display-name[, …]]Note
This command is not available in the VSI DECwindows Motif for OpenVMS user interface to the debugger.
Parameters
- A predefined display:
- SRC
- OUT
- PROMPT
- INST
- REG
- FREG (Integrity servers and Alpha only)
- IREG
A display previously created with the
DISPLAYcommand- A display built-in symbol:
- %CURDISP
- %CURSCROLL
- %NEXTDISP
- %NEXTINST
- %NEXTOUTPUT
- %NEXTSCROLL
- %NEXTSOURCE
If you do not specify a display, the current scrolling display, as established by the
SELECT command, is chosen.
Qualifiers
- /DOWN[:n]
Moves the display down by
nlines (ifnis positive)or up bynlines (ifnis negative). If you omitn, the display is moved down by 1 line.- /LEFT[:n]
Moves the display to the left by
nlines (ifnis positive) or right bynlines (ifnis negative). If you omitn, the display is moved to the left by 1 line.- /RIGHT[:n]
Moves the display to the right by
nlines (ifnis positive) or left bynlines (ifnis negative). If you omitn, the display is moved to the right by 1 line.- /UP[:n]
Moves the display up by
nlines (ifnis positive) or down bynlines (ifnis negative). If you omitn, the display is moved up by 1 line.
Description
You must specify at least one qualifier.
For each display specified, the MOVE command simply creates a window of
the same dimensions elsewhere on the screen and maps the display to it, while maintaining the
relative position of the text within the window.
The MOVE command does not change the order of a display on the display
pasteboard. Depending on the relative order of displays, the MOVE command can
cause the display to hide or uncover another display or be hidden by another display, partially
or totally.
A display can be moved only up to the edge of the screen.
For a list of the keypad-key definitions associated with the MOVE
command, type Help Keypad_Definitions_CI.Also, use the SHOW
KEY command to determine the current key definitions.
-
DISPLAY -
EXPAND -
SELECT/SCROLL - (
SET,SHOW)TERMINAL
Examples
DBG> MOVE/LEFT
This command moves the current scrolling display to the left by 1 column.
DBG> MOVE/UP:3/RIGHT:5 NEW_OUT
This command moves display NEW_OUT up by 3 lines and to the right by 5 columns.
PTHREAD
PTHREAD — Passes a command to the POSIX Threads debugger for execution.
Synopsis
PTHREAD [command]Note
This command is valid only when the event facility is THREADS and the program is running POSIX Threads 3.13 or later.
Parameters
A POSIX Threads debugger command.
Description
Passes a command to the POSIX Threads debugger for execution. The results appear in the command view. Once the POSIX Threads debugger command has been completed, control is returned to the OpenVMS debugger. You can get help on POSIX Threads debugger commands by typing PTHREAD HELP.
See the Guide to POSIX Threads Library for more information about using the POSIX Threads debugger.
SET EVENT FACILITYSET TASK|THREADSHOW EVENT FACILITYSHOW TASK|THREAD
Example
DBG_1> PTHREAD HELP
conditions [-afhwqrs] [-N <n>] [id]...: list condition variables
exit: exit from DECthreads debugger
help [topic]: display help information
keys [-v] [-N <n>] [id]...: list keys
mutexes [-afhilqrs] [-N <n>] [id]...: list mutexes
quit: exit from DECthreads debugger
show [-csuv]: show stuff
squeue [-c <n>] [-fhq] [-t <t>] [a]: format queue
stacks [-fs] [sp]...: list stacks
system: show system information
threads [-1] [-N <n>] [-abcdfhklmnor] [-s <v>] [-tz] [id]...: list threads
tset [-chna] [-s <v>] <id>: set state of thread
versions: display versions
write <st>: write a string
All keywords may be abbreviated: if the abbreviation is ambiguous,
the first match will be used. For more help, type 'help <topic>'.
DBG_1>This command invokes the POSIX Threads debugger help file, then returns control to the OpenVMS debugger. To get specific help on a POSIX Threads debugger Help topic, type PTHREAD HELP topic.
QUIT
QUIT — Ends a debugging session, or terminates one or more processes of a multiprocess
program (similar to EXIT), but without allowing any application-declared exit
handlers to run. If used within a command procedure or DO clause and no process is specified, it
exits the command procedure or DO clause at that point.
Synopsis
QUIT [process-spec[, …]]Parameters
|
[%PROCESS_NAME] |
The process name, if that name does not contain spaces or lowercase characters. The process name can include the asterisk (*) wildcard character. |
|
[%PROCESS_NAME] " |
The process name, if that name contains spaces or lowercase characters. You can also use apostrophes (') instead of quotation marks ("). |
|
%PROCESS_PID |
The process identifier (PID, a hexadecimal number). |
|
[%PROCESS_NUMBER] |
The number assigned to a process when it comes under debugger control. A new number
is assigned sequentially, starting with 1, to each process. If a process is terminated
with the |
|
|
A symbol defined with the |
|
%NEXT_PROCESS |
The next process after the visible process in the debugger's circular process list. |
|
%PREVIOUS_PROCESS |
The process previous to the visible process in the debugger's circular process list. |
|
%VISIBLE_PROCESS |
The process whose stack, register set, and images are the current context for looking up symbols, register values, routine calls, breakpoints, and so on. |
You can also use the asterisk (*) wildcard character to specify all processes.
Description
The QUIT command is similar to the EXIT command,
except that QUIT does not cause your program to execute and, therefore, does
not execute any application-declared exit handlers in your program.
Ending a Debugging Session
To end a debugging session, enter the QUIT command at the debugger
prompt without specifying any parameters. This causes orderly termination of the session: the
debugger exit handler is executed (closing log files, restoring the screen and keypad states,
and so on), and control is returned to DCL level. You cannot then continue to debug your program
by entering the DCL command DEBUG or CONTINUE (you must
restart the debugger).
Using the QUIT Command in Command Procedures and DO Clauses
When the debugger executes a QUIT command (without any parameters) in a
command procedure, control returns to the command stream that invoked the command procedure. A
command stream can be the terminal, an outer (containing) command procedure, or a DO clause in a
command or screen display definition. For example, if the command procedure was invoked from
within a DO clause, control returns to that DO clause, where the debugger executes the next
command (if any remain in the command sequence).
When the debugger executes a QUIT command (without any parameters) in a
DO clause, it ignores any remaining commands in that clause and displays its prompt.
Terminating Specified Processes
If you are debugging a multiprocess program, you can use the QUIT
command to terminate specified processes without ending the debugging session. The same
techniques and behavior apply, whether you enter the QUIT command at the
prompt or use it within a command procedure or DO clause.
To terminate one or more processes, enter the QUIT command, specifying
these processes as parameters. This causes orderly termination of the images in these processes
without executing any application-declared exit handlers associated with these images.
Subsequently, the specified processes are no longer identified in a SHOW
PROCESS/ALL display.
In contrast to the EXIT command, the QUIT command
does not cause any process to start execution.
-
DISCONNECT -
@(Execute Procedure) -
Ctrl/C -
Ctrl/Y -
Ctrl/Z -
EXIT -
RERUN -
RUN -
SET ABORT_KEY -
SET PROCESS
Examples
DBG> QUIT $
This command ends the debugging session and returns you to DCL level.
all> QUIT %NEXT_PROCESS, JONES_3, %PROC 5 all>
This command causes orderly termination of three processes of a multiprocess program: the process after the visible process on the process list, process JONES_3, and process 5. Control is returned to the debugger after the specified processes have exited.
REBOOT (Integrity servers and Alpha Only)
REBOOT (Integrity servers and Alpha Only) — When debugging operating system code with the OpenVMS System-Code Debugger, reboots
the target machine running the operating system code and executes (or reexecutes) your system
program. The REBOOT command, in other words, is similar to the
RUN or RERUN commands when you are within the OpenVMS
System-Code Debugger environment. (The OpenVMS System-Code Debugger is a kernel debugger that is
activated through the OpenVMS Debugger.) Before you issue this command, you must create an Alpha
or Integrity server device driver, activate the OpenVMS System-Code Debugger, and use the
CONNECT command that provides debugging capability. You must also have
started the OpenVMS Debugger with the DEBUG/KEEP command.
Synopsis
REBOOT Description
For complete information on using the OpenVMS System-Code Debugger, see the VSI OpenVMS System Analysis Tools Manual.
-
CONNECT -
DISCONNECT
Example
DBG> REBOOT
This command reboots the target machine where you will be debugging the OpenVMS operating system and reruns your program.
REPEAT
REPEAT — Executes a sequence of commands a specified number of times.
Synopsis
REPEAT [language-expression DO (command [;
…])]Parameters
Denotes any expression in the currently set language that evaluates to a positive integer.
Specifies a debugger command. If you specify more than one command, you must separate the commands with semicolons (;). At each execution, the debugger checks the syntax of any expressions in the commands and then evaluates them.
Description
The REPEAT command is a simple form of the FOR
command. The REPEAT command executes a sequence of commands repetitively a
specified number of times, without providing the options for establishing count parameters that
the FOR command does.
-
EXITLOOP -
FOR -
WHILE
Example
DBG> REPEAT 10 DO (EXAMINE Y; STEP)
This command line sets up a loop that issues a sequence of two commands (EXAMINE Y, then STEP) 10 times.
RERUN
RERUN — Reruns the program currently under debugger control.
Synopsis
RERUN Note
Requires that you started your debugging session with the DCL command
DEBUG/KEEP and then executed the debugger RUN command.
If you began your session with the DCL command RUN
instead, you cannot use the debugger
filespecRERUN command.
Qualifiers
- /ARGUMENTS="arg-list"
Specifies a list of arguments. If you specify a quoted string, you might have to add quotation marks because the debugger strips them when parsing the string. If you do not specify arguments, any arguments that were specified previously when running or rerunning that program are applied, by default.
- /HEAP_ANALYZER
(Applies only to workstation users.) Invokes the Heap Analyzer, a debugger feature that helps you understand how memory is used by your application. For more information on using the Heap Analyzer, see Chapter 12, "Using the Heap Analyzer ".
- /SAVE (default)
/NOSAVE Controls whether to save the current state (activated or deactivated) of all breakpoints, tracepoints, and static watchpoints for the next run of the program. The
/SAVEqualifier specifies that their state is saved, and/NOSAVEspecifies that their state is not saved./SAVEmay or may not save the state of a particular nonstatic watchpoint depending on the scope of the variable being watched relative to the main program unit (where execution restarts).
Description
If you invoked the debugger with the DCL command DEBUG/KEEP and
subsequently used the debugger RUN command to begin debugging your program,
you can then use the RERUN command to rerun the program currently under
debugger control.
The RERUN command terminates the image you were debugging and then
restarts that image under debugger control. Execution is paused at the start of the main program
unit, as if you had used the debugger RUN command or the DCL command
RUN/DEBUG.
The RERUN command uses the same version of the image that is currently
under debugger control. To debug a different version of that program (or a different program)
from the same debugging session, use the RUN command.
-
RUN(debugger command) -
RUN(DCL command) - (
ACTIVATE,DEACTIVATE)BREAK - (
ACTIVATE,DEACTIVATE)TRACE - (
ACTIVATE,DEACTIVATE)WATCH
Examples
DBG> RERUN
This command reruns the current program. By default, the debugger saves the current state of all breakpoints, tracepoints, and static watchpoints (activated or deactivated).
DBG> RERUN/NOSAVE
This command reruns the current program without saving the current state of breakpoints, tracepoints, and watchpoints - in effect, the same as using the
RUNcommand and specifying the image name.DBG> RERUN/ARGUMENTS="fee fii foo fum"
This command reruns the current program with new arguments.
RUN
RUN — Runs a program under debugger control.
Synopsis
RUN [program-image]Note
Requires that you started your debugging session with the DCL command
DEBUG/KEEP. If you began your session with the DCL command RUN
instead, you cannot use the debugger
filespecRUN command.
Parameters
Specifies the executable image of the program to be debugged. Do not specify an image if
you use the /COMMAND= qualifier.cmd-symbol
Qualifiers
- /ARGUMENTS="arg-list"
Specifies a list of arguments. If you specify a quoted string, you might have to add quotation marks because the debuggers trips quotes when parsing the string.
- /COMMAND="cmd-symbol"
Specifies a DCL foreign command for running the program.
Do not use this qualifier if you specify a
program-imageparameter.Do not specify a DCL command or any other command definition that was created with the
SET COMMANDcommand.- /HEAP_ANALYZER
(Applies only to workstation users.) Invokes the Heap Analyzer, a debugger feature that helps you understand how memory is used by your application. For more information on using the Heap Analyzer, see Chapter 12, "Using the Heap Analyzer ".
- /NEW
Runs a new program under debugger control without terminating any programs already running.
Description
If you invoked the debugger with the DCL command DEBUG/KEEP, you can use
the debugger RUN command at any time during a debugging session to start a
program under debugger control. If you are in the midst of debugging a program when you issue
the RUN command, that program will first be terminated unless you use the
/NEW qualifier.
To run the same program again (that is, the same version of the program that is currently
under debugger control), use the RERUN command. RERUN
enables you to save the current state (activated or deactivated) of any breakpoints,
tracepoints, and static watchpoints.
For a discussion of passing arguments when you use the RUN or
RERUN command, see Chapter 1, "Introduction to the Debugger ".
RUN command:You can use the
RUNcommand only if you started the debugger with the DCL commandDEBUG/KEEP.You cannot use the
RUNcommand to connect the debugger to a running program. See the description ofCtrl/Y.You cannot run a program under debugger control over a DECnet link. Both the image to be debugged and the debugger must reside on the same node.
-
RERUN -
RUN(DCL command) -
Ctrl/Y--DEBUG(DCL command) -
DEBUG(DCL command)
Examples
DBG> RUN EIGHTQUEENS Language: C, Module: EIGHTQUEENS
This command brings the program EIGHTQUEENS under debugger control.
$ RUNPROG == "$ DISK3:[SMITH]MYPROG.EXE" $ DEBUG/KEEP … DBG> RUN/COMMAND="RUNPROG"/ARGUMENTS="X Y Z"The first line of this example creates a command symbol
RUNPROG(at DCL level) to run an image namedMYPROG.EXE. The second line starts the debugger. The debuggerRUNcommand then brings the imageMYPROG.EXEunder debugger control. The/COMMANDqualifier specifies the command symbol previously created (in this caseRUNPROG), and the/ARGUMENTSqualifier passes the argumentsX Y Zto the image.DBG> RUN/ARGUMENTS="X Y Z" MYPROG
This command brings the program
MYPROG.EXEunder debugger control and passes the argumentsX Y Z.
SAVE
SAVE — Preserves the contents of an existing screen display in a new display.
Synopsis
SAVE [old-display AS new-display [, …]]Note
This command is not available in the VSI DECwindows Motif for OpenVMS user interface to the debugger.
Parameters
- A predefined display:
- SRC
- OUT
- PROMPT
- INST
- REG
- FREG (Integrity servers and Alpha only)
- IREG
A display previously created with the
DISPLAYcommand.- A display built-in symbol:
- %CURDISP
- %CURSCROLL
- %NEXTDISP
- %NEXTINST
- %NEXTOUTPUT
- %NEXTSCROLL
- %NEXTSOURCE
Specifies the name of the new display to be created. This new display then receives the
contents of the old-disp display.
Description
The SAVE command enables you to save a snaps hot copy of an existing
display in a new display for later reference. The new display is created with the same text
contents as the existing display. In general, the new display is given all the attributes or
characteristics of the old display except that it is removed from the screen and is never
automatically updated. You can later recall the saved display to the terminal screen with the
DISPLAY command.
When you use the SAVE command, only those lines that are currently
stored in the display's memory buffer (as determined by the /SIZE qualifier
on the DISPLAY command) are stored in the saved display. However, in the case
of a saved source or instruction display, you can also see any other source lines associated
with that module or any other instructions associated with that routine (by scrolling the saved
display).
You cannot save the PROMPT display.
-
DISPLAY -
EXITLOOP
Example
DBG> SAVE REG AS OLDREG
This command saves the contents of the display named REG into the newly created display named OLDREG.
SCROLL
SCROLL — Scrolls a screen display to make other parts of the text visible through the display
window.
Synopsis
SCROLL [display-name]Note
This command is not available in the VSI DECwindows Motif for OpenVMS user interface to the debugger.
Parameters
- A predefined display:
- SRC
- OUT
- PROMPT
- INST
- REG
- FREG (Integrity servers and Alpha only)
- IREG
A display previously created with the
DISPLAYcommand- A display built-in symbol:
- %CURDISP
- %CURSCROLL
- %NEXTDISP
- %NEXTINST
- %NEXTOUTPUT
- %NEXTSCROLL
- %NEXTSOURCE
If you do not specify a display, the current scrolling display, as established by the
SELECT command, is chosen.
Qualifiers
- /BOTTOM
Scrolls down to the bottom of the display's text.
- /DOWN:[n]
Scrolls down over the display's text by
nlines to reveal text further down in the display. If you omitn, the display is scrolled by approximately 3/4 of its window height.- /LEFT:[n]
Scrolls left over the display's text by
ncolumns to reveal text beyond the left window border. You cannot scroll past column 1. If you omitn, the display is scrolled left by 8 columns.- /RIGHT[:n]
Scrolls right over the display's text by
ncolumns to reveal text beyond the right window border. You cannot scroll past column 255. If you omitn, the display is scrolled right by 8 columns.- /TOP
Scrolls up to the top of the display's text.
- /UP[:n]
Scrolls up over the display's text by
nlines to reveal text further up in the display. If you omitn, the display is scrolled by approximately 3/4 of its window height.
Description
The SCROLL command moves a display up, down, right, or left relative to
its window so that various parts of the display text can be made visible through the window.
Use the SELECT/SCROLL command to select the target display for the
SCROLL command (the current scrolling display).
For a list of the key definitions associated with the SCROLL command,
type Help Keypad_Definitions_CI. Also, use the SHOW
KEY command to determine the current key definitions.
Related command: SELECT.
Examples
DBG> SCROLL/LEFT
This command scrolls the current scrolling display to the left by 8 columns.
DBG> SCROLL/UP:4 ALPHA
This command scrolls display ALPHA 4 lines up.
SEARCH
SEARCH — Searches the source code for a specified string and displays source lines that
contain an occurrence of the string.
Synopsis
SEARCH [range] [string]Parameters
|
|
Searches the specified module from line 0 to the end of the module. |
|
|
Searches the specified module from the specified line number to the end of the module. |
|
|
Searches the specified module from the line number specified on the left of the colon to the line number specified on the right. |
|
|
Uses the current scope to find a module and searches that module from the specified
line number to the end of the module. The current scope is established by a previous
|
|
|
Uses the current scope to find a module and searches that module from the line
number specified on the left of the colon to the line number specified on the right. The
current scope is established by a previous |
|
null (no entry) |
Searches the same module as that from which a source line was most recently
displayed (as a result of a |
Specifies the source code characters for which to search. If you do not specify a string,
the string specified in the last SEARCH command, if any, is used.
The string has any leading or ending space or tab characters
The string contains an embedded semicolon
The range parameter is null
If the string is enclosed in quotation marks, use two consecutive quotation marks (" ") to indicate an enclosed quotation mark. If the string is enclosed in apostrophes, use two consecutive apostrophes (' ') to indicate an enclosed apostrophe.
Qualifiers
- /ALL
Specifies that the debugger search for all occurrences of the string in the specified range and display every line containing an occurrence of the string.
- /IDENTIFIER
Specifies that the debugger search for an occurrence of the string in the specified range but display the string only if it is not bounded on either side by a character that can be part of an identifier in the current language.
- /NEXT
(Default) Specifies that the debugger search for the next occurrence of the string in the specified range and display only the line containing this occurrence.
- /STRING
(Default) Specifies that the debugger search for and display the string as specified, and not interpret the context surrounding an occurrence of the string, as it does in the case of
/IDENTIFIER.
Description
The SEARCH command displays the lines of source code that contain an
occurrence of a specified string.
If you specify a module name with the SEARCH command, that module must
be set. To determine whether a particular module is set, use the SHOW MODULE
command, then use the SET MODULE command, if necessary.
Qualifiers for the SEARCH command determine whether the debugger: (1)
searches for all occurrences (/ALL) of the string or only the next occurrence
(/NEXT); and (2) displays any occurrence of the string
(/STRING) or only those occurrences in which the string is not bounded on
either side by a character that can be part of an identifier in the current language
(/IDENTIFIER).
SEARCH commands with the same qualifier,
you can first use the SET SEARCH command to establish a new default qualifier
(for example, SET SEARCH ALL makes the SEARCH command
behave like SEARCH/ALL). Then you do not have to use that qualifier with the
SEARCH command. You can override the current default qualifiers for the
duration of a single SEARCH command by specifying other qualifiers. Related commands:- (
SET,SHOW)LANGUAGE - (
SET,SHOW)MODULE - (
SET,SHOW)SCOPE - (
SET,SHOW)SEARCH
Examples
DBG> SEARCH/STRING/ALL 40:50 D module COBOLTEST 40: 02 D2N COMP-2 VALUE -234560000000. 41: 02 D COMP-2 VALUE 222222.33. 42: 02 DN COMP-2 VALUE -222222.333333. 47: 02 DR0 COMP-2 VALUE 0.1. 48: 02 DR5 COMP-2 VALUE 0.000001. 49: 02 DR10 COMP-2 VALUE 0.00000000001. 50: 02 DR15 COMP-2 VALUE 0.0000000000000001. DBG>This command searches for all occurrences of the letter D in lines 40 to 50 of the module COBOLTEST, the module that is in the current scope.
DBG> SEARCH/IDENTIFIER/ALL 40:50 D module COBOLTEST 41: 02 D COMP-2 VALUE 222222.33. DBG>This command searches for all occurrences of the letter D in lines 40 to 50 of the module COBOLTEST. The debugger displays the only line where the letter D (the search string) is not bounded on either side by a character that can be part of an identifier in the current language.
DBG> SEARCH/NEXT 40:50 D module COBOLTEST 40: 02 D2N COMP-2 VALUE -234560000000. DBG>This command searches for the next occurrence of the letter D in lines 40 to 50 of the module COBOLTEST.
DBG> SEARCH/NEXT module COBOLTEST 41: 02 D COMP-2 VALUE 222222.33. DBG>This command searches for the next occurrence of the letter D. The debugger assumes D to be the search string because D was the last one entered and no other search string was specified.
DBG> SEARCH 43 D module COBOLTEST 47: 02 DR0 COMP-2 VALUE 0.1. DBG>This command searches for the next occurrence (by default) of the letter D, starting with line 43.
SDA
SDA — Invokes the System Dump Analyzer (SDA) from within the OpenVMS debugger without
terminating a debugger session.
Synopsis
SDA [sda-command]Parameters
One SDA command to be executed before returning control to the OpenVMS debugger.
Description
System code debugging with the System Code Debugger (SCD) (Alpha and Integrity servers only)
System dump analysis with the System Dump Debugger (SDD) (Alpha and Integrity servers only)
Process dump analysis with the System Dump Analyzer (SDA) (Integrity servers and Alpha only)
Note
The SDA command is not available when debugging user-mode programs.
-
ANALYZE/CRASH_DUMP -
ANALYZE/PROCESS_DUMP -
CONNECT %NODE
Example
DBG>SDA OpenVMS (TM) Alpha process dump analyzer SDA> . . . . SDA> EXIT DBG>
This example opens an SDA session within the OpenVMS debugger, performs some analysis, closes the SDA session and returns control to the debugger.
DBG> SDA SHOW PROCESS . . DBG>
This example show the execution of a single SDA command from within the debugger, followed by a return of control to the debugger.
SELECT
SELECT — Selects a screen display as the current error, input, instruction, output, program,
prompt, scrolling, or source display.
Synopsis
SELECT [display-name]Note
This command is not available in the VSI DECwindows Motif for OpenVMS user interface to the debugger.
Parameters
- A predefined display:
- SRC
- OUT
- PROMPT
- INST
- REG
- FREG (Integrity servers and Alpha only)
- IREG
A display previously created with the
DISPLAYcommand- A display built-in symbol:
- %CURDISP
- %CURSCROLL
- %NEXTDISP
- %NEXTINST
- %NEXTOUTPUT
- %NEXTSCROLL
- %NEXTSOURCE
If you omit this parameter and do not specify a qualifier, you "unselect" the current
scrolling display (no display then has the scrolling attribute). If you omit this parameter but
specify a qualifier (/INPUT, /SOURCE, and so on), you
unselect the current display with that attribute (see the qualifier descriptions).
Qualifiers
- /ERROR
Selects the specified display as the current error display. This causes all debugger diagnostic messages to go to that display. The display specified must be either an output display or the PROMPT display. If you do not specify a display, this qualifier selects the PROMPT display current error display. By default, the PROMPT display has the error attribute.
- /INPUT
Selects the specified display as the current input display. This causes that display to echo debugger input (which appears in the PROMPT display). The display specified must be an output display.
If you do not specify a display, the current input display is unselected and debugger input is not echoed to any display (debugger input appears only in the PROMPT display). By default, no display has the input attribute.
- /INSTRUCTION
Selects the specified display as the current instruction display. This causes the output of all
EXAMINE/INSTRUCTIONcommands to go to that display. The display specified must be an instruction display.If you do not specify a display, the current instruction display is unselected and no display has the instruction attribute.
By default, for all languages except MACRO--32, no display has the instruction attribute. If the language is set to MACRO--32, the INST display has the instruction attribute by default.
- /OUTPUT
Selects the specified display as the current output display. This causes debugger output that is not already directed to another display to go to that display. The display specified must be either an output display or the PROMPT display.
If you do not specify a display, the PROMPT display is selected as the current output display. By default, the OUT display has the output attribute.
- /PROGRAM
Selects the specified display as the current program display. This causes the debugger to try to force program input and output to that display. Currently, only the PROMPT display can be specified.
If you do not specify a display, the current program display is unselected and program input and output are no longer forced to the specified display.
By default, the PROMPT display has the program attribute, except on workstations, where the program attribute is unselected.
- /PROMPT
Selects the specified display as the current prompt display. This is where the debugger prompts for input. Currently, only the PROMPT display can be specified. Moreover, you cannot unselect the PROMPT display (the PROMPT display always has the prompt attribute).
- /SCROLL
(Default) Selects the specified display as the current scrolling display. This is the default display for the
SCROLL,MOVE, andEXPANDcommands. Although any display can have the scroll attribute, you can use only theMOVEandEXPANDcommands (not theSCROLLcommand) with the PROMPT display.If you do not specify a display, the current scrolling display is unselected and no display has the scroll attribute.
By default, for all languages except MACRO-32, the SRC display has the scroll attribute. If the language is set to MACRO-32, the INST display has the scroll attribute by default.
- /SOURCE
Selects the specified display as the current source display. This causes the output of all
TYPEandEXAMINE/SOURCEcommands to go to that display. The display specified must be a source display.If you do not specify a display, the current source display is unselected and no display has the source attribute.
By default, for all languages except MACRO--32, the SRC display has the source attribute. If the language is set to MACRO--32, no display has the source attribute by default.
Description
Attributes are used to select the current scrolling display and to direct various types of debugger output to particular displays. This gives you the option of mixing or isolating different types of information, such as debugger input, output, diagnostic messages, and so on in scrollable displays.
Use the SELECT command with one or more qualifiers
(/ERROR, /SOURCE, and so on) to assign one or more
corresponding attributes to a display. By default, if you do not specify a qualifier,
/SCROLL is assumed.
If you use the SELECT command without specifying a display name, the
attribute assignment indicated by the qualifier is canceled (unselected). To reassign display
attributes, you must use another SELECT command. For more information, see
the individual qualifier.
For a list of the key definitions associated with the SELECT command,
type Help Keypad_Definitions_CI. Also, use the SHOW
KEY command to determine the current key definitions.
-
DISPLAY -
EXPAND -
MOVE -
SCROLL -
SHOW SELECT
Examples
DBG> SELECT/SOURCE/SCROLL SRC2
This command selects display SRC2 as the current source and scrolling display.
DBG> SELECT/INPUT/ERROR OUT
This command selects display OUT as the current input and error display. This causes debugger input, debugger output (assuming OUT is the current output display), and debugger diagnostic messages to be logged in the OUT display in the correct sequence.
DBG> SELECT/SOURCE
This command unselects (deletes the source attribute from) the currently selected source display. The output of a
TYPEorEXAMINE/SOURCEcommand then goes to the currently selected output display.
SET ABORT_KEY
SET ABORT_KEY — Assigns the debugger's abort function to another Ctrl-key sequence. By default,
Ctrl/C does the abort function.
Synopsis
SET ABORT_KEY [= CTRL_character]Note
This command is not available in the VSI DECwindows Motif for OpenVMS user interface to the debugger.
Parameters
Specifies the key you press while holding down the Ctrl key. You can specify any alphabetic character.
Description
By default, the Ctrl/C sequence, when entered within a debugging
session, aborts the execution of a debugger command and interrupts program execution. The
SET ABORT_KEY command enables you to assign the abort function to another
Ctrl-key sequence. This might be necessary if your program has a Ctrl/C AST
service routine enabled.
Many Ctrl-key sequences have predefined functions, and the SET ABORT_KEY
command enables you to override such definitions (see the OpenVMS User's
Manual). Some of the Ctrl-key characters not used by the operating system are G, K,
N, and P.
The SHOW ABORT_KEY command identifies the Ctrl-key sequence currently in
effect for the abort function.
Do not use Ctrl/Y from within a debugging session. Instead, use either
Ctrl/C or an equivalent Ctrl-key sequence established with the SET
ABORT_KEY command.
-
Ctrl/C -
Ctrl/Y -
SHOW ABORT_KEY
Example
DBG> SHOW ABORT_KEY
Abort Command Key is CTRL_C
DBG> GO
…
Ctrl/C
DBG> EXAMINE/BYTE 1000:101000 !should have typed 1000:1010
1000: 01004: 01008: 01012: 01016: 0
Ctrl/C
%DEBUG-W-ABORTED, command aborted by user request
DBG> SET ABORT_KEY = CTRL_P
DBG> GO
…
Ctrl/P
DBG> EXAMINE/BYTE 1000:101000 !should have typed 1000:1010
1000: 01004: 01008: 01012: 01016: 0
Ctrl/P
%DEBUG-W-ABORTED, command aborted by user request
DBG>Use of
Ctrl/Cfor the abort function (default).Use of the
SET ABORT_KEYcommand to reassign the abort function toCtrl/P.
SET ATSIGN
SET ATSIGN — Establishes the default file specification that the debugger uses when searching for
command procedures.
Synopsis
SET ATSIGN [file-spec]Parameters
Specifies any part of a file specification (for example, a directory name or a file type)
that the debugger is to use by default when searching fora command procedure. If you do not
supply a full file specification, the debugger assumes SYS$DISK:[]DEBUG.COM
as the default file specification for any missing field.
You can specify a logical name that translates to a search list. In this case, the debugger processes the file specifications in the order they appear in the search list until the command procedure is found.
Description
When you invoke a debugger command procedure with the execute procedure
(@) command, the debugger assumes, by default, that the command procedure file
specification is SYS$DISK:[]DEBUG.COM. The SET ATSIGN
command enables you to override this default.
-
@(Execute Procedure) -
SHOW ATSIGN
Example
DBG> SET ATSIGN USER:[JONES.DEBUG].DBG DBG> @TEST
In this example, when you use the @TEST command, the debugger looks for
the file TEST.DBG in USER:[JONES.DEBUG].
SET BREAK
SET BREAK — Establishes a breakpoint at the location denoted by an address expression, at
instructions of a particular class, or at the occurrence of specified events.
Synopsis
SET BREAK [address-expression[, …]]Parameters
Specifies an address expression (a program location) at which a breakpoint is to be set. With high-level languages, this is typically a line number, a routine name, or a label, and can include a path name to specify the entity uniquely. More generally, an address expression can also be a memory address or a register and can be composed of numbers (offsets) and symbols, as well as one or more operators, operands, or delimiters. For information about the operators that you can use in address expressions, see the Address_Expressions help topic.
-
/ACTIVATING -
/BRANCH -
/CALL -
/EXCEPTION -
/HANDLER -
/INSTRUCTION -
/INTO -
/LINE -
/OVER -
/[NO]SHARE -
/[NO]SYSTEM -
/SYSEMULATE(Alpha only) -
/TERMINATING -
/UNALIGNED_DATA(Integrity servers and Alpha only)
The /MODIFY and /RETURN qualifiers are used with
specific kinds of address expressions.
If you specify a memory address or an address expression whose value is not a symbolic
location, check (with the EXAMINE command) that an instruction actually
begins at the byte of memory so indicated. If an instruction does not begin at this byte, a
run-time error can occur when an instruction including that byte is executed. When you set a
breakpoint by specifying an address expression whose value is not a symbolic location, the
debugger does not verify that the location specified marks the beginning of an
instruction.
Specifies a conditional expression in the currently set language that is to be evaluated whenever execution reaches the breakpoint. (The debugger checks the syntax of the expressions in the WHEN clause when execution reaches the breakpoint, not when the breakpoint is set.)If the expression is true, the debugger reports that a breakpoint has been triggered. If an action (DO clause) is associated with the breakpoint, it will occur at this time. If the expression is false, a report is not issued, the commands specified by the DO clause (if one was specified) are not executed, and program execution is continued.
Specifies a debugger command to be executed as part of the DO clause when break action is taken. The debugger checks the syntax of the commands in a DO clause when it executes the DO clause, not when the breakpoint is set.
Qualifiers
- /ACTIVATING
Causes the debugger to break when a new process comes under debugger control. The debugger prompt is displayed when the first process comes under debugger control. This enables you to enter debugger commands before the program has started execution. See also the
/TERMINATINGqualifier.- /AFTER:n
Specifies that break action not be taken until the
nthtime the designated breakpoint is encountered (nis a decimal integer). Thereafter, the breakpoint occurs every time it is encountered provided that conditions in the WHEN clause (if specified) are true. TheSET BREAK/AFTER:1command has the same effect asSET BREAK.- /BRANCH
Causes the debugger to break on every branch instruction encountered during program execution. See also the
/INTOand/OVERqualifiers.- /CALL
Causes the debugger to break on every call instruction encountered during program execution, including the RET instruction. See also the
/INTOand/OVERqualifiers.- /EVENT=event-name
Causes the debugger to break on the specified event (if that event is defined and detected by the current event facility). If you specify an address expression with
/EVENT, causes the debugger to break whenever the specified event occurs for that address expression. You cannot specify an address expression with certain event names.Event facilities are available for programs that call Ada or SCAN routines or that use POSIX Threads services. Use the
SHOW EVENT_FACILITYcommand to identify the current event facility and the associated event names.- /EXCEPTION
Causes the debugger to break whenever an exception is signaled. The break action occurs before any application-declared exception handlers are invoked.
As a result of aSET BREAK/EXCEPTIONcommand, whenever your program generates an exception, the debugger suspends program execution, reports the exception, and displays its prompt. When you resume execution from an exception breakpoint, the behavior is as follows:If you enter a
GOcommand without anaddress-expressionparameter, the exception is resignaled, thus allowing any application-declared exception handler to execute.If you enter a
GOcommand with anaddress-expressionparameter, program execution continues at the specified location, thus inhibiting the execution of any application-declared exception handler.On Alpha, you must explicitly set a breakpoint in the exception handler before entering a
STEPor aGOcommand to get the debugger to suspend execution within the handler.If you enter a
CALLcommand, the routine specified is executed.
On Alpha, an exception might not be delivered (to the program or debugger) immediately after the execution of the instruction that caused the exception. Therefore, the debugger might suspend execution on an instruction beyond the one that actually caused the exception.
- /HANDLER
Causes the debugger to scan the call stack and attempt to set a breakpoint on every established frame-based handler whenever the program being debugged has an exception. The debugger does not discriminate between standard RTL handlers and user-established handlers.
On Integrity servers and Alpha systems, most RTLs establish a jacket RTL handler on a frame where the user program has defined a handler. The RTL jacket performs setup, argument manipulation, and dispatch to the user written handlers. When processing the exception, the debugger can only set the breakpoint on the RTL jacket handler, because that is the address on the call stack. If the debugger suspends program execution in a jacket RTL handler, you can usually reach the user-defined handler by finding the dispatch point(s) via some number of STEP/CALLs followed by a STEP/INTO.
See the OpenVMS Calling Standard for more information on frame-based handlers.
If the jacket RTL handler is part of an installed shared image such as ALPHA LIBOTS, the debugger cannot set a breakpoint on it(no private user mode write access). In this case, activate ALL RTLs as private images via logical names. For example:$DEFINE LIBOTS SYS$SHARE:LIBOTS.EXE;
Note that the trailing semicolon (;) is required. Note also that all (or none) of your shared installed RTLs should be activated privately. Use
SHOW IMAGE/FULLdata to realize the list of images with system space code sections and then define logicals for all of them and rerun your debug session.- /INSTRUCTION
/INSTRUCTION[=(opcode[, …])] When you do not specify an opcode, causes the debugger to break on every instruction encountered during program execution.
See also the
/INTOand/OVERqualifiers.- /INTO
- (Default) Applies only to breakpoints set with the following qualifiers (that is, when an address expression is not explicitly specified):
-
/BRANCH -
/CALL -
/INSTRUCTION -
/LINE
When used with those qualifiers,
/INTOcauses the debugger to break at the specified points within called routines (as well as within the routine in which execution is currently suspended). The/INTOqualifier is the default and is the opposite of/OVER.When using
/INTO, you can further qualify the break action with/[NO]JSB,/[NO]SHARE, and/[NO]SYSTEM. -
- /LINE
Causes the debugger to break on the beginning of each source line encountered during program execution. See also the
/INTOand/OVERqualifiers.- /MODIFY
Causes the debugger to break on every instruction that writes to and modifies the value of the location indicated by the address expression. The address expression is typically a variable name.
The
SET BREAK/MODIFYcommand acts exactly like aSET WATCHcommand and operates under the same restrictions.If you specify an absolute address for the address expression, the debugger might not be able to associate the address with a particular data object. In this case, the debugger uses a default length of 4 bytes. You can change this length, however, by setting the type to either WORD (
SET TYPE WORD, which changes the default length to 2 bytes) or BYTE (SET TYPE BYTE, which changes the default length to 1 byte).SET TYPE LONGWORDrestores the default length of 4 bytes.- /OVER
- Applies only to breakpoints set with the following qualifiers (that is, when an address expression is not explicitly specified):
-
/BRANCH -
/CALL -
/INSTRUCTION -
/LINE
When used with those qualifiers,
/OVERcauses the debugger to break at the specified points only within the routine in which execution is currently suspended (not within called routines). The/OVERqualifier is the opposite of/INTO(which is the default). -
- /RETURN
Causes the debugger to break on the return instruction of the routine associated with the specified address expression (which can be a routine name, line number, and so on). Breaking on the return instruction enables you to inspect the local environment (for example, obtain the values of local variables) while the routine is still active. Note that the view of a local environment may differ depending on your architecture.
The
address-expressionparameter is an instruction address within a routine. It can simply be a routine name, in which case it specifies the routine start address. However, you can also specify another location in a routine, so you can see only those returns that are taken after a certain code path is followed.A
SET BREAK/RETURNcommand cancels a previousSET BREAKif you specify the same address expression.- /SHARE (default)
/NOSHARE - Qualifies
/INTO. Use with/INTOand one of the following qualifiers:-
/BRANCH -
/CALL -
/INSTRUCTION -
/LINE
The
/SHAREqualifier permits the debugger to break within shareable image routines as well as other routines. The/NOSHAREqualifier specifies that breakpoints not be set within shareable images. -
- /SILENT
/NOSILENT (default) Controls whether the "break …" message and the source line for the current location are displayed at the breakpoint. The
/NOSILENTqualifier specifies that the message is displayed. The/SILENTqualifier specifies that the message and the source line are not displayed. The/SILENTqualifier overrides/SOURCE. See also theSET STEP [NO]SOURCEcommand.- /SOURCE (default)
/NOSOURCE Controls whether the source line for the current location is displayed at the breakpoint. The
/SOURCEqualifier specifies that the source line is displayed. The/NOSOURCEqualifier specifies that no source line is displayed. The/SILENTqualifier overrides/SOURCE. See also theSET STEP [NO]SOURCEcommand.- /SYSEMULATE[=mask]
(Alpha only) Stops program execution and returns control to the debugger after the operating system emulates an instruction. The optional argument mask is an unsigned quadword with bits set to specify which emulated instruction groups shall cause breakpoints. The only emulated instruction group currently defined consists of the BYTE and WORD instructions. Select this instruction group by setting bit 0 of mask to 1.
If
maskis not specified or ifmask = FFFFFFFFFFFFFFFF, the debugger stops program execution when the operating system emulates any instruction.- /SYSTEM (default)
/NOSYSTEM - Qualifies
/INTO. Use with/INTOand one of the following qualifiers:-
/BRANCH -
/CALL -
/INSTRUCTION -
/LINE
The
/SYSTEMqualifier permits the debugger to break within system routines(P1 space) as well as other routines. The/NOSYSTEMqualifier specifies that breakpoints not be set within system routines. -
- /TEMPORARY
Causes the breakpoint to disappear after it is triggered (the breakpoint does not remain permanently set).
- /TERMINATING
Causes the debugger to break when a process does an image exit. The debugger gains control and displays its prompt when the last image of a one-process or multiprocess program exits. A process is terminated when the image has executed the $EXIT system service and all of its exit handlers have executed. See also the
/ACTIVATINGqualifier.- /UNALIGNED_DATA
(Integrity servers and Alpha only)Causes the debugger to break directly after any instruction that accesses unaligned data (for example, after a load word instruction that accesses data that is not on a word boundary).
Description
Suspends program execution at the breakpoint location.
If you specified
/AFTERwhen you set the breakpoint, checks the AFTER count. If the specified number of counts has not been reached, execution resumes and the debugger does not do the remaining steps.Evaluates the expression in a WHEN clause, if you specified one when you set the breakpoint. If the value of the expression is false, execution resumes and the debugger does not do the remaining steps.
Reports that execution has reached the breakpoint location by issuing a "break …" message, unless you specified
/SILENT.Displays the line of source code at which execution is suspended, unless you specified
/NOSOURCEor/SILENTwhen you set the breakpoint or unless you previously enteredSET STEP NOSOURCE.Executes the commands in a DO clause, if you specified one when you set the breakpoint. If the DO clause contains a
GOcommand, execution continues and the debugger does not perform the next step.Issues the prompt.
You set a breakpoint at a particular location in your program by specifying an address
expression with the SET BREAK command. You set a breakpoint on consecutive
source lines, classes of instructions, or events by specifying a qualifier with the SET
BREAK command. Generally, you must specify either an address expression or a
qualifier, but not both. Exceptions are /EVENT and
/RETURN.
The /LINE qualifier sets a breakpoint on each line of source code.
/LINE causes the debugger to trace every instruction of your program as
it executes and thus significantly slows down execution: -
/BRANCH -
/CALL -
/INSTRUCTION -
/RETURN
-
/INTO -
/OVER -
/[NO]SHARE -
/[NO]SYSTEM
-
/[NO]SILENT -
/[NO]SOURCE
-
/AFTER:n -
/TEMPORARY
Use the /MODIFY qualifier to monitor changes at program locations
(typically changes in the values of variables).
If you set a breakpoint at a location currently used as a tracepoint, the tracepoint is canceled in favor of the breakpoint, and vice versa.
On OpenVMS Integrity server and Alpha systems, the SET
BREAK/UNALIGNED_DATA command calls the $START_ALIGN_FAULT_REPORT
system service routine. Do not issue this command if the program you are debugging includes a
call to the same $START_ALIGN_FAULT_REPORT routine. If you issue the command
before the program call, the program call fails. If the program call occurs before you issue the
command, unaligned breaks are not set.
Breakpoints can be user defined or predefined. User-defined breakpoints are set explicitly
with the SET BREAK command. Predefined breakpoints, which depend on the type
of program you are debugging (for example, Ada or multiprocess), are established automatically
when you start the debugger. Use the SHOW BREAK command to identify all
breakpoints that are currently set. Any predefined breakpoints are identified as such.
User-defined and predefined breakpoints are set and canceled independently. For example, a location or event can have both a user-defined and a predefined breakpoint. Canceling the user-defined breakpoint does not affect the predefined breakpoint, and conversely.
- (
ACTIVATE,DEACTIVATE,SHOW,CANCEL)BREAK -
CANCEL ALL -
GO - (
SET,SHOW)EVENT_FACILITY -
SET STEP [NO]SOURCE -
SET TRACE -
SET WATCH -
STEP
Examples
DBG> SET BREAK SWAP\%LINE 12
This command causes the debugger to break on line 12 of module SWAP.
DBG> SET BREAK/AFTER:3 SUB2
This command causes the debugger to break on the third and subsequent times that SUB2 (a routine) is executed.
DBG> SET BREAK/NOSOURCE LOOP1 DO (EXAMINE D; STEP; EXAMINE Y; GO)
This command causes the debugger to break at location LOOP1. At the breakpoint, the following commands are issued, in the order given: (1)
EXAMINE D, (2)STEP, (3)EXAMINE Y, and (4)GO. The/NOSOURCEqualifier suppresses the display of source code at the breakpoint.DBG> SET BREAK ROUT3 WHEN (X > 4) DO (EXAMINE Y)
This command causes the debugger to break on routine ROUT3 when X is greater than 4. At the breakpoint, the
EXAMINE Ycommand is issued. The syntax of the conditional expression in the WHEN clause is language-dependent.DBG> SET BREAK/TEMPORARY 1440 DBG> SHOW BREAK breakpoint at 1440 [temporary] DBG>
This command sets a temporary breakpoint at memory address 1440. After that breakpoint is triggered, it disappears.
DBG> SET BREAK/LINE
This command causes the debugger to break on the beginning of every source line encountered during program execution.
DBG> SET BREAK/LINE WHEN (X .NE. 0) DBG> SET BREAK/INSTRUCTION WHEN (X .NE. 0)
These two commands cause the debugger to break when X is not equal to 0.The first command tests for the condition at the beginning of every source line encountered during execution. The second command tests for the condition at each instruction. The syntax of the conditional expression in the WHEN clause is language-dependent.
DBG> SET BREAK/LINE/INTO/NOSHARE/NOSYSTEM
This command causes the debugger to break on the beginning of every source line, including lines in called routines (
/INTO) but not in shareable image routines (/NOSHARE) or system routines (/NOSYSTEM).DBG> SET BREAK/RETURN ROUT4
This command causes the debugger to break whenever the return instruction of routine ROUT4 is about to be executed.
DBG> SET BREAK/RETURN %LINE 14
This command causes the debugger to break whenever the return instruction of the routine that includes line 14 is about to be executed. This form of the command is useful if execution is currently suspended within a routine and you want to set a breakpoint on that routine's return instruction.
DBG> SET BREAK/EXCEPTION DO (SET MODULE/CALLS; SHOW CALLS)
This command causes the debugger to break whenever an exception is signaled. At the breakpoint, the
SET MODULE/CALLSandSHOW CALLScommands are issued.DBG> SET BREAK/EVENT=RUN RESERVE, %TASK 3
This command sets two breakpoints, which are associated with task RESERVE and task 3 (task ID = 3), respectively. Each breakpoint is triggered whenever its associated task makes a transition to the RUN state.
all> SET BREAK/ACTIVATING
This command causes the debugger to break whenever a process of a multiprocess program is brought under debugger control.
SET DEFINE
SET DEFINE — Establishes a default qualifier (/ADDRESS,
/COMMAND, /PROCESS_GROUP, or /VALUE)
for the DEFINE command.
Synopsis
SET DEFINE [define-default]Parameters
DEFINE command. Valid
keywords (which correspond to DEFINE command qualifiers) are as follows:|
ADDRESS |
Subsequent |
|
COMMAND |
Subsequent |
|
PROCESS_SET |
Subsequent |
|
VALUE |
Subsequent |
Description
The SET DEFINE command establishes a default qualifier for subsequent
DEFINE commands. The parameters that you specify in the SET
DEFINE command have the same names as the qualifiers for the
DEFINE command. The qualifiers determine whether the
DEFINE command binds a symbol to an address, a command string, a list of
processes, or a value.
You can override the current DEFINE default for the duration of a single
DEFINE command by specifying another qualifier. Use the SHOW
DEFINE command to identify the current DEFINE defaults.
-
DEFINE -
DEFINE/PROCESS_SET -
DELETE -
SHOW DEFINE -
SHOW SYMBOL/DEFINED
Example
DBG> SET DEFINE VALUE
The SET DEFINE VALUE command specifies that subsequent
DEFINE commands are treated as DEFINE/VALUE.
SET EDITOR
SET EDITOR — Establishes the editor that is started by the EDIT command.
Synopsis
SET EDITOR [command-line]Parameters
Specifies a command line to start a particular editor on your system when you use the
EDIT command.
You need not specify a command line if you use /CALLABLE_EDT,
/CALLABLE_LSEDIT, or /CALLABLE_TPU. If you do not use one
of these qualifiers, the editor specified in the SET EDITOR command line is
spawned to a subprocess when you enter the EDIT command.
You can specify a command line with /CALLABLE_LSEDIT or
/CALLABLE_TPU but not with /CALLABLE_EDT.
Qualifiers
- /CALLABLE_EDT
Specifies that the callable version of the EDT editor is started when you use the
EDITcommand. Do not specify a command line with this qualifier (a command line of "EDT" is used).- /CALLABLE_TPU
Specifies that the callable version of the DEC Text Processing Utility (DECTPU) is started when you use the
EDITcommand. If you also specify a command line, it is passed to callable DECTPU. If you do not specify a command line, the default command line is TPU.- /START_POSITION
/NOSTART_POSITION (default) Controls whether the
/START_POSITIONqualifier is appended to the specified or default command line when you enter theEDITcommand. Currently, only DECTPU and the DEC Language-Sensitive Editor (specified as TPU or/CALLABLE_TPU, andLSEDITor/CALLABLE_LSEDIT, respectively) support this qualifier.The
/START_POSITIONqualifier affects the initial position of the editor's cursor. By default (/NOSTART_POSITION), the editor's cursor is placed at the beginning of source line 1, regardless of which line is centered in the debugger's source display or whether you specify a line number in theEDITcommand. If you specify/START_POSITION, the cursor is placed either on the line whose number you specify in theEDITcommand, or (if you do not specify a line number) on the line that is centered in the current source display.
Description
The SET EDITOR command enables you to specify any editor that is
installed on your system. In general, the command line specified as parameter to the
SET EDITOR command is spawned and executed in a subprocess.
On Alpha and Integrity servers, if you use EDT, LSEDIT, or DECTPU, you can start these
editors in a more efficient way. You can specify /CALLABLE_EDT or
/CALLABLE_TPU which causes the callable versions of EDT and DECTPU
respectively, to be invoked by the EDIT command. In the case of DECTPU, you
can also specify a command line that is executed by the callable
editor.
-
EDIT - (
SET,SHOW,CANCEL)SOURCE -
SHOW DEFINE
Examples
DBG> SET EDITOR '@MAIL$EDIT ""'
This command causes the
EDITcommand to spawn the command line'@MAIL$EDIT ""', which starts the same editor as you use in MAIL.DBG> SET EDITOR/CALLABLE_TPU
This command causes the
EDITcommand to start callable DECTPU with the default command line of TPU.DBG> SET EDITOR/CALLABLE_TPU TPU/SECTION=MYSECINI.TPU$SECTION
This command causes the
EDITcommand to start callable DECTPU with the command lineTPU/SECTION=MYSECINI.TPU$SECTION.DBG> SET EDITOR/CALLABLE_EDT/START_POSITION
This command causes the
EDITcommand to start callable EDT with the default command line of EDT. Also the/START_POSITIONqualifier is appended to the command line, so that the editing session starts on the source line that is centered in the debugger's current source display.
SET EVENT_FACILITY
SET EVENT_FACILITY — Establishes the current event facility. Event facilities are available for programs
that call Ada or SCAN routines or that use POSIX Threads services.
Synopsis
SET EVENT_FACILITY [facility-name]Parameters
facility-name keywords are as
follows: |
ADA |
If the event facility is set to ADA, the ( You can set the event facility to ADA only if the main program is written in Ada or if the program calls an Ada routine. |
|
THREADS |
If the event facility is set to THREADS, the ( You can set the event facility to THREADS only if the shareable image CMA$RTL is
currently part of the program's process (if that image is listed in a |
Description
The current event facility (ADA, THREADS, or SCAN) defines the eventpoints that you can set
with the SET BREAK/EVENT and SET TRACE/EVENT commands.
When started with a program that is linked with an event facility, the debugger automatically sets the facility in a manner appropriate for the type of program. For example, if the main program is written in Ada or SCAN, the event facility is set to ADA or SCAN, respectively.
The SET EVENT_FACILITY command enables you to change the event facility
and thereby change your debugging context. This is useful if you have a multilanguage program
and want to debug a routine that is associated with an event facility but that facility is not
currently set.
Use the SHOW EVENT_FACILITY command to identify the event names
associated with the current event facility. These are the keywords that you can specify with the
(SET, CANCEL) BREAK/EVENT and
(SET, CANCEL) TRACE/EVENT
commands.
- (
SET,CANCEL)BREAK/EVENT - (
SET,CANCEL)TRACE/EVENT -
SHOW BREAK -
SHOW EVENT_FACILITY -
SHOW IMAGE -
SHOW TASK -
SHOW TRACE
Example
DBG> SET EVENT_FACILITY THREADS
This command establishes THREADS (POSIX Threads) as the current event facility.
SET IMAGE
SET IMAGE — Loads symbol information for one or more shareable images and establishes the current
image.
Synopsis
SET IMAGE [image-name[, …]]Parameters
Specifies a shareable image to be set. Do not use the asterisk (*)
wildcard character. Instead, use the /ALL qualifier. Do not specify an image
name with /ALL.
Description
The SET IMAGE command builds data structures for one or more specified
images but does not set any modules within the images specified.
The current image is the current debugging context: you have access to symbols in the
current image. If you specify only one image with the SET IMAGE command, that
image becomes the current image. If you specify a list of images, the last one in the list
becomes the current image. If you specify /ALL, the current image is
unchanged.
Before an image can be set with the SET IMAGE command, it must have been
linked with the /DEBUG or /TRACEBACK qualifier on the DCL
command LINK. If an image was linked /NOTRACEBACK, no
symbol information is available for that image and you cannot specify it with the SET
IMAGE command.
Definitions created with the DEFINE/ADDRESS and
DEFINE/VALUE commands are available only when the image in whose context
they were created is the current image. When you use the SET IMAGE command to
establish a new current image, these definitions are temporarily unavailable. However,
definitions created with the DEFINE/COMMAND and DEFINE/KEY
commands are available for all images.
-
SET MODE [NO]DYNAMIC - (
SET,SHOW,CANCEL)MODULE - (
SHOW,CANCEL)IMAGE
Example
DBG> SET IMAGE SHARE1 DBG> SET MODULE SUBR DBG> SET BREAK SUBR
This sequence of commands shows how to set a breakpoint on routine SUBR in module SUBR of
shareable image SHARE1. The SET IMAGE command sets the debugging context to
SHARE1. The SET MODULE command loads the symbol records of module SUBR into
the run-time symbol table (RST). The SET BREAK command sets a breakpoint on
routine SUBR.
SET KEY
SET KEY — Establishes the current key state.
Synopsis
SET KEY Note
This command is not available in the VSI DECwindows Motif for OpenVMS user interface to the debugger.
Qualifiers
- /LOG (default)
/NOLOG Controls whether a message is displayed indicating that the key state has been set. The
/LOGqualifier displays the message. The/NOLOGqualifier suppresses the message.- /STATE[=state-name]
/NOSTATE (default) Specifies a key state to be established as the current state. You can specify a predefined key state, such as GOLD, or a user-defined state. A state name can be any appropriate alphanumeric string. The
/NOSTATEqualifier leaves the current state unchanged.
Description
Keypad mode must be enabled (SET MODE KEYPAD) before you can use this
command. Keypad mode is enabled by default.
By default, the current key state is the DEFAULT state. When you define function keys, you
can use the DEFINE/KEY/IF_STATE command to assign a specific state name to
the key definition. If that state is not set when you press the key, the definition is not
processed. The SET KEY/STATE command enables you to change the current state
to the appropriate state.
You can also change the current state by pressing a key that causes a state change (a key
that was defined with DEFINE/KEY/LOCK_STATE/SET_STATE).
-
DELETE/KEY -
DEFINE/KEY -
SHOW KEY
Example
DBG> SET KEY/STATE=PROG3
This command changes the key state to the PROG3 state. You can now use the key definitions that are associated with this state.
SET LANGUAGE
SET LANGUAGE — Establishes the current language.
Synopsis
SET LANGUAGE [language-name]Parameters
Specifies a language.
|
AMACRO |
BASIC |
BLISS |
C |
|
C++ |
COBOL |
Fortran |
PASCAL |
|
UNKNOWN |
|
ADA |
AMACRO |
BASIC |
BLISS |
|
C |
C_PLUS_PLUS |
COBOL |
FORTRAN |
|
MACRO |
MACRO64 |
PASCAL |
PLI |
|
UNKNOWN |
MACRO-32 must be compiled with the AMACRO compiler.
Description
When you start the debugger, the current language is set to that in which the module
containing the main program is written. This is usually the module containing the image transfer
address. To debug a module written in a different source language from that of the main program,
you can change the language with the SET LANGUAGE command.
The current language setting determines how the debugger parses and interprets the names, operators, and expressions you specify in debugger commands, including things like the typing of variables, array and record syntax, the default radix for the entry and display of integer data, case sensitivity, and so on. The language setting also determines how the debugger formats and displays data associated with your program.
The default radix for both data entry and display is decimal for most languages. The exceptions are BLISS and MACRO, which have a default radix of hexadecimal.
The default type for program locations that do not have a compiler-generated type is longword integer. This is appropriate for debugging 32-bit applications.
It is advisable to change the default type to quadword for debugging applications that use
the 64-bit address space (on OpenVMS Integrity servers, the default type is quadword). Use the
SET TYPE QUADWORD command.
Use the SET LANGUAGE UNKNOWN command when debugging a program written in
an unsupported language. To maximize the usability of the debugger with unsupported languages,
SET LANGUAGE UNKNOWN causes the debugger to accept a large set of data
formats and operators, including some that might be specific to only a few supported languages.
Note that SET LANGUAGE UNKNOWN can be an easy, quick workaround for
language-related problems because it uses the "loosest" set of rules.
For information about debugger support for language-specific operators and constructs, type HELP Language. See the Language_Support help topic.
-
EVALUATE -
EXAMINE -
DEPOSIT -
SET MODE -
SET RADIX -
SET TYPE -
SHOW LANGUAGE
Examples
DBG> SET LANGUAGE COBOL
This command establishes COBOL as the current language.
DBG> SET LANGUAGE PASCAL
This command establishes Pascal as the current language.
SET LANGUAGE/DYNAMIC
SET LANGUAGE/DYNAMIC — Toggles the state of automatic language setting.
Synopsis
SET LANGUAGE/DYNAMIC Description
When you start the debugger, the current language is set to that in which the module containing the main program is written. This is usually the module containing the image transfer address. By default, when the scope of the program being executed changes to a module written in a different language, the debugger changes the current language to that of the module.
You can prevent the debugger from automatically changing the current language with the
SET LANGUAGE/NODYNAMIC command.
-
SET LANGUAGE -
SHOW LANGUAGE
Examples
DBG> SET LANGUAGE/NODYNAMIC
This command prevents the debugger from changing the current language until you enter a
SET LANGUAGE or SET LANGUAGE/DYNAMIC command.
SET LOG
SET LOG — Specifies a log file to which the debugger writes after a SET OUTPUT
LOG command has been entered.
Synopsis
SET LOG [file-spec]Parameters
Denotes the file specification of the log file. If you do not supply a full file
specification, the debugger assumes SYS$DISK:[]DEBUG.LOG as the default
file specification for any missing field.
If you specify a version number and that version of the file already exists, the debugger writes to the file specified, appending the log of the debugging session onto the end of that file.
Description
The SET LOG command determines only the name of a log file; it does not
cause the debugger to create or write to the specified file. The SET OUTPUT
LOG command accomplishes that.
If you entered a SET OUTPUT LOG command but no SET
LOG command, the debugger writes to the file
SYS$DISK:[]DEBUG.LOG by default.
If the debugger is writing to a log file and you specify another log file with the
SET LOG command, the debugger closes the former file and begins writing to
the file specified in the SET LOG command.
-
SET OUTPUT LOG -
SET OUTPUT SCREEN_LOG -
SHOW LOG
Examples
DBG> SET LOG CALC DBG> SET OUTPUT LOG
In this example, the
SET LOGcommand specifies the debugger log file to beSYS$DISK:[]CALC.LOG. TheSET OUTPUT LOGcommand causes user input and debugger output to be logged to that file.DBG> SET LOG [CODEPROJ]FEB29.TMP DBG> SET OUTPUT LOG
In this example, the
SET LOGcommand specifies the debugger log file to be[CODEPROJ]FEB29.TMP. TheSET OUTPUT LOGcommand causes user input and debugger output to be logged to that file.
SET MARGINS
SET MARGINS — Specifies the leftmost and rightmost source-line character position at which to begin
and end display of a source line.
Synopsis
SET MARGINS [rm lm:rm lm: :rm]Note
This command is not available in the VSI DECwindows Motif for OpenVMS user interface to the debugger.
Parameters
The source-line character position at which to begin display of the line of source code (the left margin).
The source-line character position at which to end display of the line of source code (the right margin).
Description
The SET MARGINS command affects only the display of source lines. It
does not affect the display of other debugger output, as from an EXAMINE
command.
The SET MARGINS command is useful for controlling the display of source
code when, for example, the code is deeply indented or long lines wrap at the right margin. In
such cases, you can set the left margin to eliminate indented space in the source display, and
you can decrease the right margin setting (from its default value of 255) to truncate lines and
prevent them from wrapping.
The SET MARGINS command is useful mostly in line (no screen) mode. In
line mode, the SET MARGINS command affects the display of source lines
resulting from a TYPE, EXAMINE/SOURCE,
SEARCH, or STEP command, or when a breakpoint,
tracepoint, or watchpoint is triggered.
In screen mode, the SET MARGINS command has no effect on the display of
source lines in a source display, such as the predefined display SRC. Therefore it does not
affect the output of a TYPE or EXAMINE/SOURCE command,
since that output is directed at a source display. The SET MARGINS command
affects only the display of any source code that might appear in an output or DO display (for
example, after a STEP command has been executed). However, such source-code
display is normally suppressed if you enable screen mode by pressing PF1-PF3, because that
sequence issues the SET STEP NOSOURCE command as well as SET MODE
SCREEN to eliminate redundant source display.
By default, the debugger displays a source line starting at character position 1 of the
source line. This is actually character position 9 on your terminal screen. The first eight
character positions on the screen are reserved for the line number and cannot be manipulated by
the SET MARGINS command.
If you specify a single number, the debugger sets the left margin to 1 and the right margin to the number specified.
If you specify two numbers, separated with a colon, the debugger sets the left margin to the number on the left of the colon and the right margin to the number on the right.
If you specify a single number followed by a colon, the debugger sets the left margin to that number and leaves the right margin unchanged.
If you specify a colon followed by a single number, the debugger sets the right margin to that number and leaves the left margin unchanged.
-
SET STEP [NO]SOURCE -
SHOW MARGINS
Examples
DBG> SHOW MARGINS left margin: 1 , right margin: 255 DBG> TYPE 14 module FORARRAY 14: DIMENSION IARRAY(4:5, 5), VECTOR(10), I3D(3, 3, 4) DBG>
This example displays the default margin settings for a line of source code (1and 255).
DBG> SET MARGINS 39 DBG> SHOW MARGINS left margin: 1 , right margin: 39 DBG> TYPE 14 module FORARRAY 14: DIMENSION IARRAY(4:5, 5), VECTOR DBG>
This example shows how the display of a line of source code changes when you change the right margin setting from 255 to 39.
DBG> SET MARGINS 10:45 DBG> SHOW MARGINS left margin: 10 , right margin: 45 DBG> TYPE 14 module FORARRAY 14: IMENSION IARRAY(4:5, 5), VECTOR(10), DBG>
This example shows the display of the same line of source code after both margins are changed.
DBG> SET MARGINS :100 DBG> SHOW MARGINS left margin: 10 , right margin: 100 DBG>
This example shows how to change the right margin setting while retaining the previous left margin setting.
DBG> SET MARGINS 5: DBG> SHOW MARGINS left margin: 5 , right margin: 100 DBG>
This example shows how to change the left margin setting while retaining the previous right margin setting.
SET MODE
SET MODE — Enables or disables a debugger mode.
Synopsis
SET MODE
[mode[=keyword[+keyword[+...]]][,
...] Parameters
mode |
DYNAMIC |
(Default) Enables dynamic mode. When dynamic mode is enabled, the debugger sets
modules and images automatically during program execution so that you typically do not
have to enter the | |
|
NODYNAMIC |
Disables dynamic mode. Because additional memory is allocated when a module or image
is set, you might want to disable dynamic mode if performance becomes a problem (you can
also free up memory by canceling modules and images with the | |
|
G_FLOAT |
Specifies that the debugger interpret double-precision floating-point constants entered in expressions as G_FLOAT (does not affect the interpretation of variables declared in your program). | |
|
NOG_FLOAT |
(Default) Specifies that the debugger interpret double-precision floating-point constants entered in expressions as D_FLOAT (does not affect the interpretation of variables declared in your program). | |
|
INTERRUPT |
Useful when debugging a multiprocess program. Specifies that, when program execution is suspended in any process, the debugger interrupts execution in all other processes that were executing images and prompts for input. See Chapter 15, "Debugging Multiprocess Programs" for more information. | |
|
NOINTERRUPT |
(Default) Useful when debugging a multiprocess program. Specifies that, when program execution is suspended in any process, the debugger take no action with regard to other processes. | |
|
KEYPAD |
(Default) Enables keypad mode. Note that this parameter is not available in the
VSI DECwindows Motif for OpenVMS user interface to the debugger. When keypad mode is enabled, you can
use the keys on the numeric keypad to perform certain predefined functions. Several
debugger commands, especially useful in screen mode, are bound to the keypad keys. (Type
Help Keypad_Definitions_CI; also, use the | |
|
NOKEYPAD |
Disables keypad mode. Note that this parameter is not available in the
VSI DECwindows Motif for OpenVMS user interface to the debugger. When keypad mode is disabled, the keys
on the numeric keypad do not have predefined functions, nor can you assign debugger
functions to those keys with | |
|
LINE |
(Default) Specifies that the debugger display program locations in terms of line numbers, if possible. | |
|
NOLINE |
Specifies that the debugger display program locations as | |
|
SCREEN |
Enables screen mode. Note that this parameter is not available in the VSI DECwindows Motif for OpenVMS user interface the debugger. When screen mode is enabled, you can divide the terminal screen into rectangular regions, so different data can be displayed in different regions. Screen mode enables you to view more information more conveniently than the default, line-oriented, no screen mode. You can use the predefined displays, or you can define your own. | |
|
NOSCREEN |
(Default) Disables screen mode. Note that this parameter is not available in the VSI DECwindows Motif for OpenVMS user interface to the debugger. | |
|
SCROLL |
(Default) Enables scroll mode. Note that this parameter is not available in the VSI DECwindows Motif for OpenVMS user interface to the debugger. When scroll mode is enabled, a screen-mode output or DO display is updated by scrolling the output line byline, as it is generated. | |
|
NOSCROLL |
Note that this parameter is not available in the VSI DECwindows Motif for OpenVMS user interface to the debugger. Disables scroll mode. Note that this parameter is not available in the VSI DECwindows Motif for OpenVMS user interface to the debugger. When scroll mode is disabled, a screen-mode output or DO display is updated only once per command, instead of line by line as it is generated. Disabling scroll mode reduces the amount of screen updating that takes place and can be useful with slow terminals. | |
|
SYMBOLIC |
(Default) Enables symbolic mode. When symbolic mode is enabled, the debugger displays
the locations denoted by address expressions symbolically (if possible) and displays
instruction operands symbolically (if possible). | |
|
NOSYMBOLIC |
Disables symbolic mode. When symbolic mode is disabled, the debugger does not attempt
to symbolize numeric addresses (it does not cause the debugger to convert numbers to
names). This is useful if you are interested in identifying numeric addresses rather than
their symbolic names (if symbolic names exist for those addresses). When symbolic mode is
disabled, command processing might speed up somewhat, because the debugger does not need
to convert numbers to names. | |
| TRIM |
Specifies a list of options indicating which special characters should be stripped from the trailing end of source lines displayed by the debugger. These options are intended to improve the experience of users who are primarily editing their source code on non-OpenVMS platforms, such as Microsoft Windows or GNU/Linux. The following options are available: | |
| WHITESPACE |
Strips all printing white space characters, which includes:
| |
| LINECONTROL |
(Default) Strips all line control characters, which includes:
| |
| NONPRINTING |
Strips all non-printing characters, which includes:
| |
| ALL | Enables all three of the above options. | |
| NOTRIM | Specifies that no modification to the printing of
source lines would be made. Trailing space will print as expected, and non-printing
characters will be written as escape codes – for example, a carriage-return
(^X'0D') will be written as <CR>. | |
|
WAIT |
(Default) Enables wait mode. In wait mode the debugger waits until all processes under its control have stopped before prompting for a new command. See Chapter 15, "Debugging Multiprocess Programs" for more information. | |
|
NOWAIT |
Disable wait mode. In no wait mode, the debugger immediately prompts for new commands even if some or all processes are still running. | |
Description
For details about the SET MODE command, see the parameter descriptions.
The default values of these modes are the same for all languages.
-
EVALUATE -
EXAMINE -
DEFINE/KEY -
DEPOSIT -
DISPLAY - (
SET,SHOW,CANCEL)IMAGE - (
SET,SHOW,CANCEL)MODULE -
SET PROMPT - (
SET,SHOW,CANCEL)RADIX - (
SET,SHOW)TYPE - (
SHOW,CANCEL)MODE -
SYMBOLIZE
Example
DBG> SET MODE SCREEN
This command puts the debugger in screen mode.
SET MODULE
SET MODULE — Loads the symbol records of a module in the current image into the run-time symbol
table (RST) of that image.
Synopsis
SET MODULE [module-name[, …]]Note
The current image is either the main image (by default) or the image established as the
current image by a previous SET IMAGE command.
By default, the debugger automatically loads symbols in a module as needed. As such, this
behavior makes the use of an explicit SET MODULE command optional. For more
information, see SET MODE DYNAMIC.
Parameters
Specifies a module of the current image whose symbol records are loaded into the RST. Do
not use the asterisk (*) wildcard character. Instead, use the
/ALL qualifier. Do not specify a module name with /ALL or
/CALLS.
Qualifiers
- /ALL
Specifies that the symbol records of all modules in the current image be loaded into the RST.
- /CALLS
Sets all the modules that currently have routines on the call stack. If a module is already set,
/CALLShas no effect on that module.- /RELATED (default)
/NORELATED (Applies to Ada programs.) Controls whether the debugger loads into the RST the symbol records of a module that is related to a specified module through a with-clause or subunit relationship. Once loaded, you can reference names declared in related modules within debugger commands exactly as you reference them within the Ada source code.
Description
The SET MODULE command loads the symbol records of a module in the
current image into the run-time symbol table (RST) of that image. Symbol records must be present
in the RST if the debugger is to recognize and properly interpret the symbols declared in your
program. The process by which the symbol records of a module are loaded into the RST is called
setting a module. This command also supports user-provided mixed-case
and lowercase module names on Alpha and Integrity servers.
At debugger startup, the debugger sets the module containing the transfer address (the main
program). By default, dynamic mode is enabled (SET MODE DYNAMIC). Therefore,
the debugger sets modules (and images) automatically as the program executes so that you can
reference symbols as you need them. Specifically, whenever execution is suspended, the debugger
sets the module and image containing the routine in which execution is suspended. In the case of
Ada programs, as a module is set dynamically, its related modules are also set automatically, by
default, to make the appropriate symbols accessible (visible).
- If the module is in the current image, use the
SET MODULEcommand to set the module where the symbol is defined or reference the symbol with a fully-qualified path name. For example:DBG>SET BREAK X\Y
If the module is in another image, use the
SET IMAGEcommand to make that image the current image, then use theSET MODULEcommand to set the module where the symbol is defined.
If dynamic mode is disabled (SET MODE NODYNAMIC), only the module
containing the transfer address is set automatically. You must set any other modules explicitly.
If you use the SET IMAGE command to establish a new current image, all
modules previously set remain set. However, only the symbols in the set modules of the current
image are accessible. Symbols in the set modules of other images are temporarily inaccessible.
When dynamic mode is enabled, memory is allocated automatically to accommodate the increasing size of the RST. If dynamic mode is disabled, the debugger automatically allocates more memory as needed when you set a module or an image.
If a parameter in a SET SCOPE command designates a program location in a
module that is not already set, the SET SCOPE command sets that module.
For information specific to Ada programs, type Help Language_Support Ada.
- (
SET,SHOW,CANCEL)IMAGE -
SET MODE [NO]DYNAMIC - (
SHOW)MODULE
Examples
DBG> SET MODULE SUB1
This command sets module SUB1 (loads the symbol records of module SUB1 into the RST).
DBG> SET IMAGE SHARE3 DBG> SET MODULE MATH DBG> SET BREAK %LINE 31
In this example, the
SET IMAGEcommand makes shareable image SHARE3 the current image. TheSET MODULEcommand sets module MATH in image SHARE3. TheSET BREAKcommand sets a breakpoint on line 31 of module MATH.DBG> SHOW MODULE/SHARE module name symbols language size FOO yes MACRO 432 MAIN no FORTRAN 280 … SHARE$DEBUG no Image 0 SHARE$LIBRTL no Image 0 SHARE$MTHRTL no Image 0 SHARE$SHARE1 no Image 0 SHARE$SHARE2 no Image 0 total modules: 17. bytes allocated: 162280. DBG> SET MODULE SHARE$SHARE2 DBG> SHOW SYMBOL * IN SHARE$SHARE2In this example, the
SHOW MODULE/SHAREcommand identifies all modules in the current image and all shareable images (the names of the shareable images are prefixed with SHARE$). TheSET MODULE SHARE$SHARE2command sets the shareable image module SHARE$SHARE2. TheSHOW SYMBOLcommand identifies any universal symbols defined in the shareable image SHARE2. For more information, see theSHOW MODULE/SHAREcommand.DBG> SET BREAK X/Y:
In this example, the debugger automatically loads the module information when you specify the module name in the command. Debugger ensures that the module information for module X is loaded, and then locates the information for the routine named Y.
SET OUTPUT
SET OUTPUT — Enables or disables a debugger output option.
Synopsis
SET OUTPUT [output-option[, …]]Parameters
|
LOG |
Specifies that debugger input and output be recorded in a log file. If you specify
the log file by the |
|
NOLOG |
(Default) Specifies that debugger input and output not be recorded in a log file. |
|
SCREEN_LOG |
Specifies that, while in screen mode, the screen contents be recorded in a log file
as the screen is updated. To log the screen contents, you must also specify |
|
NOSCREEN_LOG |
(Default) Specifies that the screen contents, while in screen mode, not be recorded in a log file. |
|
TERMINAL |
NoteThis parameter is not available in the VSI DECwindows Motif for OpenVMS user interface to the debugger. (Default) Specifies that debugger output be displayed at the terminal. |
|
NOTERMINAL |
NoteThis parameter is not available in the VSI DECwindows Motif for OpenVMS user interface to the debugger. Specifies that debugger output, except diagnostic messages, not be displayed at the terminal. |
|
VERIFY |
Specifies that the debugger echo, on the current output device, each input command string that it is executing from a command procedure or DO clause. The current output device is by default SYS$OUTPUT (your terminal) but can be redefined with the logical name DBG$OUTPUT. |
|
NOVERIFY |
(Default) Specifies that the debugger not display each input command string that it is executing from a command procedure or DO clause. |
Description
Debugger output options control the way in which debugger responses to commands are
displayed and recorded. For details about the SET OUTPUT command, see the
parameter descriptions.
-
@(Execute Procedure) - (
SET,SHOW)ATSIGN - (
SET,SHOW)LOG -
SET MODE SCREEN -
SHOW OUTPUT
Example
DBG> SET OUTPUT VERIFY, LOG, NOTERMINAL
Output each command string that it is executing from a command procedure or DO clause (VERIFY)
Record debugger output and user input in a log file (LOG)
Not display output at the terminal, except diagnostic messages (NOTERMINAL)
SET PROCESS
SET PROCESS — Establishes the visible process or enables/disables dynamic process setting. Used
only when debugging multiprocess programs (kept debugger only).
Synopsis
SET PROCESS [process-spec[, …]]Parameters
|
[%PROCESS_NAME] |
The process name, if that name does not contain spaces or lowercase characters. The process name can include the asterisk (*) wildcard character. |
|
[%PROCESS_NAME] " |
The process name, if that name contains spaces or lowercase characters. You can also use apostrophes (') instead of quotation marks ("). |
|
%PROCESS_PID |
The process identifier (PID, a hexadecimal number). |
|
[%PROCESS_NUMBER] |
The number assigned to a process when it comes under debugger control. A new number
is assigned sequentially, starting with 1, to each process. If a process is terminated
with the |
|
|
A symbol defined with the |
|
%NEXT_PROCESS |
The next process after the visible process in the debugger's circular process list. |
|
%PREVIOUS_PROCESS |
The process previous to the visible process in the debugger's circular process list. |
|
%VISIBLE_PROCESS |
The process whose stack, register set, and images are the current context for looking up symbols, register values, routine calls, breakpoints, and so on. |
You can also use the asterisk (*) wildcard character to specify process set all.
Do not specify a process with the /[NO]DYNAMIC qualifier.
Qualifiers
- /DYNAMIC (default)
/NODYNAMIC Controls whether dynamic process setting is enabled or disabled. When dynamic process setting is enabled (
/DYNAMIC), whenever the debugger suspends execution and displays its prompt, the process in which execution is suspended automatically becomes the visible process. When dynamic process setting is disabled (/NODYNAMIC), the visible process remains unchanged until you specify another process with theSET PROCESS/VISIBLEcommand.- /VISIBLE
Makes the specified process the visible process. This switches your debugging context to the specified process, so that symbol lookups and the setting of breakpoints, and so on, are done in the context of that process. When using
/VISIBLE, you must specify one process.
Description
The SET PROCESS command establishes the visible process, defines the
current process set, or defines the visible process.
By default, commands are executed in the context of the visible process (the process that is your current debugging context). Symbol lookups, the setting of breakpoints, and so on, are done in the context of the visible process.
Dynamic process setting is enabled by default and is controlled with
/[NO]DYNAMIC. When dynamic process setting is enabled, whenever the debugger
suspends program execution and displays its prompt, the process in which execution is suspended
becomes the visible process automatically.
-
CALL -
EXIT -
GO -
QUIT -
SHOW PROCESS -
STEP
Example
all> SET PROCESS TEST_Y all> SHOW PROCESS Number Name State Current PC * 2 TEST_Y break PROG\%LINE 71 all>
The SET PROCESS TEST_Y command makes process TEST_Y the visible process.
The SHOW PROCESS command displays information about the visible process by
default.
SET PROMPT
SET PROMPT — Changes the debugger prompt string to your personal preference.
Synopsis
SET PROMPT [prompt-parameter]Parameters
Specifies the new prompt string. If the string contains spaces, semicolons (;), or lowercase characters, you must enclose it in quotation marks (") or apostrophes ('). If you do not specify a string, the current prompt string remains unchanged.
By default, the prompt string is DBG> when debugging a single process
program.
By default, when debugging a multiprocess program, the prompt string is the name of the
current process set followed by a right angle bracket (>). You should not use
the SET PROMPT command when debugging multiprocess programs.
Qualifiers
- /POP
/NOPOP (default) (Applies only to workstations running VWS.) The
/POPqualifier causes the debugger window to pop over other windows and become attached to the keyboard when the debugger prompts for input. The/NOPOPqualifier disables this behavior (the debugger window is not popped over other windows and is not attached to the keyboard automatically when the debugger prompts for input).
Description
The SET PROMPT command enables you to tailor the debugger prompt string
to your individual preference.
If you are debugging a multiprocess program, you should not use the SET
PROMPT command.
If you are using the debugger at a workstation, /[NO]POP enables you to
control whether the debugger window is popped over other windows whenever the debugger prompts
for input.
- (
SET,SHOW)PROCESS
Examples
DBG> SET PROMPT "$ " $ SET PROMPT "d b g : " d b g : SET PROMPT "DBG> " DBG>
In this example, the successive SET PROMPT commands change the debugger
prompt from "DBG>" to "$", to
"d b g :", then back to "DBG>".
SET RADIX
SET RADIX — Establishes the radix for the entry and display of integer data. When used with
/OVERRIDE, it causes all data to be displayed as integer data of the
specified radix.
Synopsis
SET RADIX [radix]Parameters
|
BINARY |
Sets the radix to binary. |
|
DECIMAL |
Sets the radix to decimal. This is the default for all languages except BLISS, MACRO--32, and MACRO--64 (Integrity servers and Alpha only). |
|
DEFAULT |
Sets the radix to the language default. |
|
OCTAL |
Sets the radix to octal. |
|
HEXADECIMAL |
Sets the default radix to hexadecimal. This is the default for BLISS, MACRO--32, and MACRO--64 (Integrity servers and Alpha only). |
Qualifiers
Description
Integer data that you specify in address expressions or language expressions.
Integer data that is displayed by the
EXAMINEandEVALUATEcommands.
The default radix for both data entry and display is decimal for most languages. The exceptions are BLISS and MACRO, which have a default radix of hexadecimal.
The SET RADIX command enables you to specify a new radix for data entry
or display (the input radix and output radix, respectively).
If you do not specify a qualifier, the SET RADIX command changes both
the input and output radix. If you specify /INPUT or
/OUTPUT, the command changes the input or output radix, respectively.
Using SET RADIX/OVERRIDE changes only the output radix but causes
all data (not just data that has an integer type) to be displayed as
integer data of the specified radix.
Except when used with /OVERRIDE, the SET RADIX
command does not affect the interpretation or display of non integer values (such as real or
enumeration type values).
The EVALUATE, EXAMINE, and DEPOSIT
commands have radix qualifiers (/BINARY, /HEXADECIMAL, and
so on) which enable you to override, for the duration of that command, any radix previously
established with SET RADIX or SET RADIX/OVERRIDE.
You can also use the built-in symbols %BIN, %DEC, %HEX, and %OCT in address expressions and language expressions to specify that an integer literal should be interpreted in binary, decimal, hexadecimal, or octal radix.
-
DEPOSIT -
EVALUATE -
EXAMINE - (
SET,SHOW,CANCEL)MODE - (
SHOW,CANCEL)RADIX
Examples
DBG> SET RADIX HEX
This command sets the radix to hexadecimal. This means that, by default, integer data is interpreted and displayed in hexadecimal radix.
DBG> SET RADIX/INPUT OCT
This command sets the radix for input to octal. This means that, by default, integer data that is entered is interpreted in octal radix.
DBG> SET RADIX/OUTPUT BIN
This command sets the radix for output to binary. This means that, by default, integer data is displayed in binary radix.
DBG> SET RADIX/OVERRIDE DECIMAL
This command sets the override radix to decimal. This means that, by default, all data (not just data that has an integer type) is displayed as decimal integer data.
SET SCOPE
SET SCOPE — Establishes how the debugger looks up symbols (variable names, routine names, line
numbers, and so on) when a path-name prefix is not specified.
Synopsis
SET SCOPE [location[, …]]Parameters
/CURRENT or /MODULE. When you specify more than one location parameter, you establish a scope search list. If the debugger cannot interpret the symbol using the first parameter, it uses the next parameter, and continues using parameters in order of their specification until it successfully interprets the symbol or until it exhausts the parameters specified.
Qualifiers
- /CURRENT
Establishes a scope search list that is like the default search list (0, 1, 2, …,
n), numeric scope specified as the command parameter. Scope 0 is the PC scope, andnis the number of calls in the call stack.When usingSET SCOPE/CURRENT, note the following conventions and behavior:The default scope search list must be in effect when the command is entered. To restore the default scope search list, enter the
CANCEL SCOPEcommand.The command parameter specified must be one (and only one) decimal integer from 0 to
n.In screen mode, the command updates the predefined source, instruction, and register displays SRC, INST, and REG, respectively, to show the routine on the call stack in which symbol searches are to start.
The default scope search list is restored when program execution is resumed.
- /MODULE
Indicates that the name specified as the command parameter is a module name and not a routine name. You need to use
/MODULEonly if you specify a module name as the command parameter and that module name is the same as the name of a routine.
Description
By default, the debugger looks up a symbol specified without a path-name prefix
according to the scope search list 0, 1, 2, …, n, where
n is the number of calls in the call stack. This scope search list is based
on the current PC value and changes dynamically as the program executes. The default scope
search list specifies that a symbol lookup such as EXAMINE X first looks for
X in the routine that is currently executing (scope 0, also known as the PC scope); if no X is
visible there, the debugger looks in the caller of that routine (scope 1), and so on down the
call stack; if X is not found in scope n, the debugger searches the rest of
the run-time symbol table (RST) - that is, all set modules and the global symbol table (GST), if
necessary.
- Specify the symbol with a path-name prefix. The path-name prefix consists of any nesting program units (for example,
module \routine \block) that are necessary to specify the symbol uniquely. For example:DBG> EXAMINE MOD4\ROUT3\X DBG> TYPE MOD4\27
- Establish a new default scope (or a scope search list) for symbol lookup by using the
SET SCOPEcommand. You can then specify the symbol without using a path-name prefix. For example:DBG> SET SCOPE MOD4\ROUT3 DBG> EXAMINE X DBG> TYPE 27
The SET SCOPE command is useful in those cases where otherwise you would
need to use a path name repeatedly to specify symbols.
SET SCOPE changes the debugger's language setting to the language of the
specified scope.
To restore the default scope search list, use the CANCEL SCOPE
command.
When the default scope search list is in effect, you can use the SET
SCOPE/CURRENT command to specify that symbol searches start at a numeric scope other
than scope 0, relative to the call stack (for example, scope 2).
When you use the SET SCOPE command, the debugger searches only the
program locations you specify explicitly, unless you specify /CURRENT. Also,
the scope or scope search list established with a SET SCOPE command remains
in effect until you restore the default scope search list or enter another SET
SCOPE command. However, if you specify /CURRENT, the default scope
search list is restored whenever program execution is resumed.
The SET SCOPE command updates a screen-mode source or instruction
display only if you specify /CURRENT.
If a name you specify in a SET SCOPE command is the name of both a
module and a routine, the debugger sets the scope to the routine. In such cases, use the
SET SCOPE/MODULE command if you want to set the scope to the module.
If you specify a module name in a SET SCOPE command, the debugger sets
that module if it is not already set. However, if you want only to set a module, use the
SET MODULE command rather than the SET SCOPE command, to
avoid the possibility of disturbing the current scope search list.
-
CANCEL ALL -
SEARCH -
SET MODULE - (
SHOW,CANCEL)SCOPE -
SHOW SYMBOL -
SYMBOLIZE -
TYPE
Examples
DBG> EXAMINE Y %DEBUG-W-NOUNIQUE, symbol 'Y' is not unique DBG> SHOW SYMBOL Y data CHECK_IN\Y data INVENTORY\COUNT\Y DBG> SET SCOPE INVENTORY\COUNT DBG> EXAMINE Y INVENTORY\COUNT\Y: 347.15 DBG>In this example, the first
EXAMINE Ycommand indicates that symbol Y is defined multiple times and cannot be resolved from the current scope search list. TheSHOW SYMBOLcommand displays the different declarations of symbol Y. TheSET SCOPEcommand directs the debugger to look for symbols without path-name prefixes in routine COUNT of module INVENTORY. The subsequentEXAMINEcommand can now interpret Y unambiguously.DBG> CANCEL SCOPE DBG> SET SCOPE/CURRENT 1
In this example, the
CANCEL SCOPEcommand restores the default scope search list (0, 1, 2, …,n). TheSET SCOPE/CURRENTcommand then changes the scope search list to 1, 2, …,n, so that symbol searches start with scope 1 (that is, with the caller of the routine in which execution is currently suspended). The predefined source and instruction displays SRC and INST, respectively, are updated and now show the source and instructions for the caller of the routine in which execution is suspended.DBG> SET SCOPE 1 DBG> EXAMINE %R5
In this example, the
SET SCOPEcommand directs the debugger to look for symbols without pathname prefixes in scope 1 (that is, in the caller of the routine in which execution is suspended). TheEXAMINEcommand then displays the value of register R5 in the caller routine. TheSET SCOPEcommand without/CURRENTdoes not update any source or instruction display.DBG> SET SCOPE 0, STACKS\R2, SCREEN
This command directs the debugger to look for symbols without path-name prefixes according to the following scope search list. First the debugger looks in the PC scope (denoted by 0). If the debugger cannot find a specified symbol in the PC scope, it then looks in routine R2 of module STACKS. If necessary, it then looks in module SCREEN. If the debugger still cannot find a specified symbol, it looks no further.
DBG> SHOW SYMBOL X data ALPHA\X ! global X data ALPHA\BETA\X ! local X data X (global) ! same as ALPHA\X DBG> SHOW SCOPE scope: 0 [ = ALPHA\BETA ] DBG> SYMBOLIZE X address ALPHA\BETA\%R0: ALPHA\BETA\X DBG> SET SCOPE \ DBG> SYMBOLIZE X address 00000200: ALPHA\X address 00000200: (global) X DBG>In this example, the
SHOW SYMBOLcommand indicates that there are two declarations of the symbol X - a global ALPHA \X (shown twice) and a local ALPHA \BETA \X. Within the current scope, the local declaration of X (ALPHA \BETA \X) is visible. After the scope is set to the global scope (SET SCOPE \), the global declaration of X is made visible.
SET SEARCH
SET SEARCH — Establishes default qualifiers (/ALL or /NEXT,
/IDENTIFIER or /STRING) for the SEARCH
command.
Synopsis
SET SEARCH [search-default[, …]]Parameters
SEARCH command. Valid
keywords(which correspond to SEARCH command qualifiers) are as follows:|
ALL |
Subsequent |
|
IDENTIFIER |
Subsequent |
|
NEXT |
(Default) Subsequent |
|
STRING |
(Default) Subsequent |
Description
The SET SEARCH command establishes default qualifiers for subsequent
SEARCH commands. The parameters that you specify with SET
SEARCH have the same names as the qualifiers for the SEARCH
command. The qualifiers determine whether the SEARCH command: (1) searches
for all occurrences of a string (ALL) or only the next occurrence (NEXT); and (2) displays any
occurrence of the string (STRING) or only those occurrences in which the string is not bounded
on either side by a character that can be part of an identifier in the current language
(IDENTIFIER).
You can override the current SEARCH default for the duration of a single
SEARCH command by specifying other qualifiers. Use the SHOW
SEARCH command to identify the current SEARCH defaults.
-
SEARCH - (
SET,SHOW)LANGUAGE -
SHOW SEARCH
Example
DBG> SHOW SEARCH search settings: search for next occurrence, as a string DBG> SET SEARCH IDENTIFIER DBG> SHOW SEARCH search settings: search for next occurrence, as an identifier DBG> SET SEARCH ALL DBG> SHOW SEARCH search settings: search for all occurrences, as an identifier DBG>
In this example, the SET SEARCH IDENTIFIER command directs the debugger
to search for an occurrence of the string in the specified range but display the string only if
it is not bounded on either side by a character that can be part of an identifier in the current
language.
The SET SEARCH ALL command directs the debugger to search for (and
display) all occurrences of the string in the specified range.
SET SOURCE
SET SOURCE — Specifies a directory search list, a directory search method, or both a list and a
method for source files.
Synopsis
SET SOURCE [directory-spec[, …]]Parameters
Specifies any part of an OpenVMS file specification (typically a device/directory) that the debugger is to use by default when searching for a source file. For any part of a full file specification that you do not supply, the debugger uses the file specification stored in the module's symbol record (that is, the file specification that the source file had at compile time).
If you specify more than one directory in a single SET SOURCE command,
you create a source directory search list (you can also specify a search list logical name that
is defined at your process level). In this case, the debugger locates the source file by
searching the first directory specified, then the second, and so on, until it either locates the
source file or exhausts the list of directories.
Qualifiers
- /DISPLAY
Specifies the directory search list used when the debugger displays source code. The default display search directory is the compilation directory.
- /EDIT
Specifies the directory search list used during execution of the debugger's
EDITcommand. The default edit search directory is the compilation directory.- /EXACT (default)
Specifies the directory search method used. In this case, the debugger searches for the exact version of the source file, as indicated in the debugger symbol table.
- /LATEST
Specifies the directory search method used. In this case, the debugger searches for the latest version of the source file, that is, the highest-numbered version in your directory.
- /MODULE=module-name
Specifies the directory search list used only for the designated module. You can append one or more of the qualifiers listed above to the
SET SOURCE/MODULEcommand.- /ORIGINAL
(Applies to STDL programs only. Requires installation of the Correlation Facility (a separate layered product) and invocation of the kept debugger.) Specifies that the debugger display the original STDL source file, rather than the intermediate files produced during STDL compilation.
Description
By default, the debugger expects a source file to be in the same directory it was in at
compile time. If a source file has been moved to a different directory since compile time, use
the SET SOURCE command to specify a directory search list and search method
to locate the file.
Specifying the Directory Search List
node::device:[directory]file-name.file-type;version-number
This format reflects the DECnet node name functionality used in DECnet Phase IV that shipped with the OpenVMS operating system. For more information, see the VSI OpenVMS DECnet Networking Manual.
namespace:.directory ... .directory.node-name
In this syntax statement, namespace identifies the global naming service, directory ... .directory defines the hierarchical directory path within the naming service, and node-name is the specific object defining the DECnet node.
For information on full names and suggestions for setting up a system of names, see the VSI OpenVMS System Manager's Manual, Volume 1: Essentials and VSI OpenVMS System Manager's Manual, Volume 2: Tuning, Monitoring, and Complex Systems. For information on DECnet-Plus, see the VSI DECnet-Plus for OpenVMS Introduction and User's Guide
If the full file specification of a source file exceeds 255 characters, the debugger cannot
locate the file. You can work around this problem by first defining a logical name "X" (at DCL
level) to expand to your long file specification, and then using the SET SOURCE
X command.
A SET SOURCE command with neither the /DISPLAY nor
the /EDIT qualifier changes both the display and edit search directories.
When compiling a program with
the /DEBUG qualifier, if you use a rooted-directory logical name to specify
the location of the source file, make sure that it is a concealed
rooted-directory logical name. If it is not concealed and you move the source file to another
directory after compilation, you cannot then use the debugger SET SOURCE
command to specify the new location of the source file.
To create a concealed rooted-directory logical name, use the DCL command
DEFINE with the /TRANSLATION_ATTR=CONCEALED qualifier.
Specifying the Directory Search Method
When you issue a SET SOURCE command, be aware that one of the two
qualifiers - /LATEST or /EXACT - will always be active.
These qualifiers affect the debugger search method. The /LATEST qualifier
directs the debugger to search for the version last created (the highest-numbered version in
your directory). The /EXACT qualifier directs the debugger to search for the
version last compiled (the version recorded in the debugger symbol table created at compile
time).For example, a SET SOURCE/LATEST command might search for
SORT.FOR;3 while a SET SOURCE/EXACT command might
search for SORT.FOR;1.
If the debugger locates this version using the directory search list, it checks that the creation or revision date and time, file size, record format, and file organization are the same as the original compile-time source file. If these characteristics match, the debugger concludes that the original source file has been located in its new directory.
If the debugger cannot locate this version using the directory search list, it identifies the file that has the closest revision date and time (if such a file exists in that directory) and issues a NOTORIGSRC message ("original version of source file not found") when first displaying the source code.
Specifying the /EDIT Qualifier
The /EDIT qualifier is needed when the files used for the display of
source code are different from the files to be edited by using the EDIT
command. This is the case with Ada programs. For Ada programs, the (SET,
SHOW, CANCEL) SOURCE commands affect
the search of files used for source display (the "copied" source files in Ada program
libraries); the (SET, SHOW, CANCEL)
SOURCE/EDIT commands affect the search of the source files you edit when
using the EDIT command. If you use /MODULE with
/EDIT, the effect of /EDIT is further qualified by
/MODULE.
For information specific to Ada programs, type HELP Language_Support Ada.
Specifying the /ORIGINAL Qualifier
Before you can use the /ORIGINAL qualifier in a SET
SOURCE command, the Correlation Facility (a separate layered product) must be
installed on your system. Refer to Correlation Facility documentation for information on
creating a correlation library before debugging.
SET SOURCE/ORIGINAL command
as follows:
$ DEBUG/KEEP
DBG> SET SOURCE/ORIGINAL
DBG> RUN filename.EXEAfter issuing these commands, you can debug STDL source code in the same way you debug any other supported language program.
- (
SHOW,CANCEL)SOURCE
Examples
DBG> SHOW SOURCE no directory search list in effect DBG> SET SOURCE [PROJA], [PROJB], [PETER.PROJC] DBG> SHOW SOURCE source directory list for all modules, match the latest source file version: [PROJA] [PROJB] [PETER.PROJC]In this example, the
SET SOURCEcommand specifies that the debugger should search directories [PROJA], [PROJB], and [PETER.PROJC], in that order, for the latest version of source files.DBG> SET SOURCE/MODULE=CTEST/EXACT [], SYSTEM::DEVICE:[PROJD] DBG> SHOW SOURCE source directory search list for CTEST, match the exact source file version: [] SYSTEM::DEVICE:[PROJD] source directory list for all other modules, match the latest source file version: [PROJA] [PROJB] [PETER.PROJC]In this continuation of the previous example, the
SET SOURCE/MODULE=CTESTcommand specifies that the debugger should search the current default directory ([]) andSYSTEM::DEVICE:[PROJD], in that order, for source files to use with the module CTEST. The/EXACTqualifier specifies that the search will try to locate the exact version of the CTEST source files found in the debug symbol table.DBG> SET SOURCE /EXACT DBG> SHOW SOURCE no directory search list in effect, match the exact source file DBG> SET SOURCE [JONES] DBG> SHOW SOURCE source directory list for all modules, match the exact source file version: [JONES] DBG> CANCEL SOURCE /EXACT DBG> SHOW SOURCE source directory list for all modules, match the latest source file version: [JONES]In this example, the
SET SOURCE/EXACTcommand establishes a search method (exact version) that remains in effect for theSET SOURCE [JONES]command. TheCANCEL SOURCE/EXACTcommand not only cancelsSET SOURCE/EXACTcommand, but also affects theSET SOURCE [JONES]command.
SET STEP
SET STEP — Establishes default qualifiers (/LINE, /INTO,
and so on) for the STEP command.
Synopsis
SET STEP [step-default[, …]]Parameters
STEP command. Valid
keywords(which correspond to STEP command qualifiers) are as follows: |
BRANCH |
Subsequent |
|
CALL |
Subsequent |
|
EXCEPTION |
Subsequent |
|
INSTRUCTION |
Subsequent |
|
INTO |
Subsequent |
|
LINE |
(Default) Subsequent |
|
OVER |
(Default) Subsequent |
|
RETURN |
Subsequent |
|
SEMANTIC_EVENT |
(Alpha only) Subsequent |
|
SHARE |
(Default) If INTO is in effect, subsequent |
|
NOSHARE |
If INTO is in effect, subsequent |
|
SILENT |
Subsequent |
|
NOSILENT |
(Default) Subsequent |
|
SOURCE |
(Default) Subsequent |
|
NOSOURCE |
Subsequent |
|
SYSTEM |
(Default) If INTO is in effect, subsequent |
|
NOSYSTEM |
If INTO is in effect, subsequent STEP commands are treated as
|
Description
SET STEP command establishes default qualifiers for subsequent
STEP commands. The parameters that you specify in the SET
STEP command have the same names as the qualifiers for the STEP
command. The following parameters affect where the STEP command suspends
execution after a step:-
BRANCH -
CALL -
EXCEPTION -
INSTRUCTION -
LINE -
RETURN -
SEMANTIC_EVENT(Alpha only)
STEP command
is executed: -
[NO]SILENT -
[NO]SOURCE
-
INTO -
OVER -
[NO]SHARE -
[NO]SYSTEM
You can override the current STEP defaults for the duration of a single
STEP command by specifying other qualifiers. Use the SHOW
STEP command to identify the current STEP defaults.
Enabling screen mode by pressing PF1-PF3 enters the SET STEP NOSOURCE
command as well as the SET MODE SCREEN command. Therefore, any display of
source code in output and DO displays that would result from a STEP command
or from a breakpoint, tracepoint, or watchpoint being triggered is suppressed, to eliminate
redundancy with the source
display.
-
SHOW STEP -
STEP
Examples
DBG> SET STEP INSTRUCTION, NOSOURCE
This command causes the debugger to execute the program to the next instruction when a
STEPcommand is entered, and not to display lines of source code with eachSTEPcommand.DBG> SET STEP LINE, INTO, NOSYSTEM, NOSHARE
This command causes the debugger to execute the program to the next line when a
STEPcommand is entered, and to step into called routines in user space only. The debugger steps over routines in system space and in shareable images.
SET TASK |THREAD
SET TASK |THREAD — Changes characteristics of one or more tasks of a tasking program (also called a
multithread program).
Synopsis
SET TASK|THREAD [task-spec[, …]]Note
SET TASK and SET THREAD are synonymous commands.
They perform identically.
Parameters
- When the event facility is THREADS:
A task (thread) ID number as declared in the program, or a language expression that yields a task ID number.
A task ID number (for example, 2), as indicated in a
SHOW TASKdisplay.
- When the event facility is ADA:
A task (thread) name as declared in the program, or a language expression that yields a task value. You can use a path name.
A task ID (for example, %TASK 2), as indicated in a
SHOW TASKdisplay.
- One of the following task built-in symbols:
%ACTIVE_TASK
The task that runs when a
GO,STEP,CALL, orEXITcommand executes.%CALLER_TASK
(Applies only to Ada programs.) When an accept statement executes, the task that called the entry associated with the accept statement.
%NEXT_TASK
The task after the visible task in the debugger's task list. The ordering of tasks is arbitrary but consistent within a single run of a program.
%PREVIOUS_TASK
The task previous to the visible task in the debugger's task list.
%VISIBLE_TASK
The task whose call stack and register set are the current context for looking up symbols, register values, routine calls, breakpoints, and so on.
Do not use the asterisk (*) wildcard character. Instead, use the
/ALL qualifier. Do not specify a task with /ALL or
/TIME_SLICE. If you do not specify a task or /ALL with
/ABORT, /[NO]HOLD, /PRIORITY, or
/RESTORE, the visible task is selected.
Qualifiers
- /ABORT
Marks the specified tasks for termination. Termination occurs at the next allowable point after a specified task resumes execution.
For HP Ada tasks, the effect is identical to executing an Ada abort statement for the tasks specified and causes these tasks to be marked as abnormal. Any dependent tasks are also marked for termination.
For POSIX Threads threads, use the following command:PTHREAD tset -c thread-number
You can get help on POSIX Threads debugger commands by typing PTHREAD HELP.
See the Guide to POSIX Threads Library for more information about using the POSIX Threads debugger.
- /ACTIVE
Makes the specified task the active task, which is the task that runs when a
STEP,GO,CALL, orEXITcommand executes. This causes a task switch to the new active task and makes that task the visible task. The specified task must be in either the RUNNING or READY state. When using/ACTIVE, you must specify one task.For POSIX Threads programs or HP Ada on Alpha programs, use one of the following alternatives:For query-type actions, use the
SET TASK/VISIBLEcommand.To gain control of execution, use a strategic placement of breakpoints.
Use the
PTHREAD tset -a thread-numbercommand.
You can get help on POSIX Threads debugger commands by typing PTHREAD HELP.
See the Guide to POSIX Threads Library for more information about using the POSIX Threads debugger.
- /ALL
- /HOLD
/NOHOLD (default) When the event facility is THREADS, use the
PTHREAD tset -h thread-numberor thePTHREAD tset -n thread-numcommand.Controls whether a specified task is put on hold. The
/HOLDqualifier puts a specified task on hold.Putting a task on hold prevents a task from entering the RUNNING state. A task put on hold is allowed to make other state transitions; in particular, it can change from the SUSPENDED to the READY state.
Putting a task on hold prevents a task from entering the RUNNING state. A task put on hold is allowed to make other state transitions; in particular, it can change from the SUSPENDED to the READY state.
A task already in the RUNNING state (the active task) can continue to execute as long as it remains in the RUNNING state, even though it is put on hold. If the task leaves the RUNNING state for any reason (including expiration of a time slice, if time slicing is enabled), it will not return to the RUNNING state until released from the hold condition.
You can override the hold condition and force a task into the RUNNING state with the
SET TASK/ACTIVEcommand even if the task is on hold.The
/NOHOLDqualifier releases a specified task from hold.You can get help on POSIX Threads debugger commands by typing PTHREAD HELP.
See the Guide to POSIX Threads Library for more information about using the POSIX Threads debugger.
- /PRIORITY=n
When the event facility is THREADS, use the
PTHREAD tset -s thread-numbercommand.Or, sets the priority of a specified task to
n, wherenis a decimal integer from 0 to 15. This does not prevent the priority from later changing in the course of execution, for example, while executing an Ada rendezvous or POSIX Threads synchronization event. This qualifier does not affect a task's scheduling policy.You can get help on POSIX Threads debugger commands by typing PTHREAD HELP.
See the Guide to POSIX Threads Library for more information about using the POSIX Threads debugger.
- /VISIBLE
Makes the specified task the visible task, which is the task whose call stack and register set are the current context for looking up symbols, register values, routine calls, breakpoints, and so on. Commands such as
EXAMINEare directed at the visible task. The/VISIBLEqualifier does not affect the active task. When using/VISIBLE, you must specify one task.
Description
The SET TASK (or SET THREAD) command enables you to
establish the visible task and the active task, control the execution of tasks, and cause task
state transitions, directly or indirectly.
To determine the current state of a task, use the SHOW TASK command. The
possible states are RUNNING, READY, SUSPENDED, and TERMINATED.
-
DEPOSIT/TASK -
EXAMINE/TASK -
SET BREAK/EVENT -
SET TRACE/EVENT - (
SET,SHOW)EVENT_FACILITY -
SHOW TASK|THREAD
Examples
DBG> SET TASK/ACTIVE %TASK 3
(Event facility = ADA) This command makes task 3 (task ID = 3) the active task.
DBG> PTHREAD tset -a 3
(Event facility = THREADS) This command makes task 3 (task ID = 3) the active task.
DBG> SET TASK %NEXT_TASK
This command makes the next task in the debugger's task list the visible task. (The
/VISIBLEqualifier is a default for theSET TASKcommand.)DBG> SET TASK/HOLD/ALL DBG> SET TASK/ACTIVE %TASK 1 DBG> GO … DBG> SET TASK/ACTIVE %TASK 3 DBG> STEP …In this example, the
SET TASK/HOLD/ALLcommand freezes the state of all tasks except the active task. Then,SET TASK/ACTIVEis used selectively (along with theGOandSTEPcommands) to observe the behavior of one or more specified tasks in isolation.
SET TERMINAL
SET TERMINAL — Sets the terminal-screen height or width that the debugger uses when it formats
screen and other output.
Synopsis
SET TERMINAL []Note
This command is not available in the VSI DECwindows Motif for OpenVMS user interface to the debugger.
Qualifiers
- /PAGE:n
Specifies that the terminal screen height should be set to
nlines. You can use any value from 18 to 100.- /WIDTH:n
Specifies that the terminal screen width should be set to
ncolumns. You can use any value from 20 to 255. For a VT100-, VT200-, or VT300 series terminal,nis typically either 80 or 132.- /WRAP
Tells the debugger to wrap output text in predefined display OUT at the column specified by the
/WIDTHqualifier. If you do not specify/WIDTHin the current command,/WRAPdefaults to the %WIDTH setting.
Description
The SET TERMINAL command enables you to define the portion of the screen
that the debugger has available for formatting screen output.
This command is useful with VT100-, VT200-, or VT300-series terminals, where you can set the screen width to typically 80 or 132 columns. It is also useful with workstations, where you can modify the size of the terminal-emulator window that the debugger uses.
You must specify at least one qualifier. You can specify all. The /PAGE
and /WIDTH qualifiers each require a value.
When you enter the SET TERMINAL command, all display window definitions
are automatically adjusted to reflect the new screen dimensions. For example, RH1 changes
dimensions proportionally to remain in the top right half of the screen.
Similarly, all "dynamic" display windows are automatically adjusted to maintain their
relative proportions. Note that all display windows are dynamic unless referenced with the
DISPLAY/NODYNAMIC command. In that case, the display window retains its
current dimensions after subsequent SET TERMINAL commands. However, you can
use the DISPLAY command to reconfigure the display window (you can also use
keypad-key combinations, such as BLUE-MINUS, to enter predefined DISPLAY
commands).
-
DISPLAY/[NO]DYNAMIC -
EXPAND - (
SET,SHOW,CANCEL)WINDOW -
SHOW TERMINAL
Example
DBG> SET TERMINAL/WIDTH:132
This command specifies that the terminal screen width be set to 132 columns.
SET TRACE
SET TRACE — Establishes a tracepoint at the location denoted by an address expression, at
instructions of a particular class, or at the occurrence of specified events.
Synopsis
SET TRACE [address-expression[, …]]Parameters
Specifies an address expression (a program location) at which a tracepoint is to be set. With high-level languages, this is typically a line number, a routine name, or a label, and can include a path name to specify the entity uniquely. More generally, an address expression can also be a memory address or a register and can be composed of numbers (offsets) and symbols, as well as one or more operators, operands, or delimiters. For information about the operators that you can use in address expressions, type Help Address_Expressions.
-
/ACTIVATING -
/BRANCH -
/CALL -
/EXCEPTION -
/INSTRUCTION -
/INTO -
/LINE -
/OVER -
/[NO]SHARE -
/[NO]SYSTEM -
/TERMINATING
The /MODIFY and /RETURN qualifiers are used with
specific kinds of address expressions.
If you specify a memory address or an address expression whose value is not a symbolic
location, check (with the EXAMINE command) that an instruction actually
begins at the byte of memory so indicated. If an instruction does not begin at this byte, a
run-time error can occur when an instruction including that byte is executed. When you set a
tracepoint by specifying an address expression whose value is not a symbolic location, the
debugger does not verify that the location specified marks the beginning of an instruction.
Specifies a conditional expression in the currently set language that is to be evaluated whenever execution reaches the tracepoint. (The debugger checks the syntax of the expressions in the WHEN clause when execution reaches the tracepoint, not when the tracepoint is set.) If the expression is true, the debugger reports that a tracepoint has been triggered. If an action (DO clause) is associated with the tracepoint, it will occur at this time. If the expression is false, a report is not issued, the commands specified by the DO clause (if one was specified) are not executed, and program execution is continued.
Specifies a debugger command to be executed as part of the DO clause when trace action is taken. The debugger checks the syntax of the commands in a DO clause when it executes the DO clause, not when the tracepoint is set.
Qualifiers
- /ACTIVATING
Causes the debugger to trace when a new process comes under debugger control. See also the
/TERMINATINGqualifier.- /AFTER:n
Specifies that trace action not be taken until the
nthtime the designated tracepoint is encountered (nis a decimal integer).Thereafter, the tracepoint occurs every time it is encountered provided that conditions in the WHEN clause (if specified) are true. TheSET TRACE/AFTER:1command has the same effect asSET TRACE.- /BRANCH
Causes the debugger to trace every branch instruction encountered during program execution. See also the
/INTOand/OVERqualifiers.- /CALL
Causes the debugger to trace every call instruction encountered during program execution, including the return instruction. See also the
/INTOand/OVERqualifiers.- /EVENT=event-name
Causes the debugger to trace the specified event (if that event is defined and detected by the current event facility). If you specify an address expression with
/EVENT, causes the debugger to trace whenever the specified event occurs for that address expression. You cannot specify an address expression with certain event names.Event facilities are available for programs that call Ada or SCAN routines or that use POSIX Threads services. To identify the current event facility and the associated event names, use the
SHOW EVENT_FACILITYcommand.- /EXCEPTION
Causes the debugger to trace every exception that is signaled. The trace action occurs before any application-declared exception handlers are invoked.
As a result of a
SET TRACE/EXCEPTIONcommand, whenever your program generates an exception, the debugger reports the exception and resignals the exception, thus allowing any application-declared exception handler to execute.- /INSTRUCTION
When you do not specify an opcode, causes the debugger to trace every instruction encountered during program execution.
See also the
/INTOand/OVERqualifiers.- /INTO
- (Default) Applies only to tracepoints set with the following qualifiers (that is, when an address expression is not explicitly specified):
-
/BRANCH -
/CALL -
/INSTRUCTION -
/LINE
When used with those qualifiers,
/INTOcauses the debugger to trace the specified points within called routines (as well as within the routine in which execution is currently suspended). The/INTOqualifier is the default and is the opposite of/OVER.When using
/INTO, you can further qualify the trace action with the/[NO]JSB,/[NO]SHARE, and/[NO]SYSTEMqualifiers. -
- /LINE
Causes the debugger to trace the beginning of each source line encountered during program execution. See also the
/INTOand/OVERqualifiers.- /MODIFY
Causes the debugger to trace when an instruction writes to and changes the value of a location indicated by a specified address expression. The address expression is typically a variable name.
The
SET TRACE/MODIFY Xcommand is equivalent toSET WATCH X DO (GO). TheSET TRACE/MODIFYcommand operates under the same restrictions asSET WATCH.If you specify an absolute address for the address expression, the debugger might not be able to associate the address with a particular data object. In this case, the debugger uses a default length of 4 bytes. You can change this length, however, by setting the type to either WORD (
SET TYPE WORD, which changes the default length to 2 bytes) or BYTE (SET TYPE BYTE, which changes the default length to 1 byte). TheSET TYPE LONGWORDcommand restores the default length of 4 bytes.- /OVER
- Applies only to tracepoints set with the following qualifiers (that is, when an address expression is not explicitly specified):
-
/BRANCH -
/CALL -
/INSTRUCTION -
/LINE
When used with those qualifiers,
/OVERcauses the debugger to trace the specified points only within the routine in which execution is currently suspended (not within called routines). The/OVERqualifier is the opposite of/INTO(which is the default). -
- /RETURN
Causes the debugger to break on the return instruction of the routine associated with the specified address expression (which can be a routine name, line number, and so on). Breaking on the return instruction enables you to inspect the local environment(for example, obtain the values of local variables)while the routine is still active. Note that the view of a local environment may differ depending on your architecture. On Alpha, this qualifier can be applied to any routine.
The
address-expressionparameter is an instruction address within a routine. It can simply be a routine name, in which case it specifies the routine start address. However, you can also specify another location in a routine, so you can see only those returns that are taken after a certain code path is followed.A
SET TRACE/RETURNcommand cancels a previousSET TRACEif you specify the same address expression.- /SHARE (default)
/NOSHARE - Qualifies
/INTO. Use with/INTOand one of the following qualifiers:-
/BRANCH -
/CALL -
/INSTRUCTION -
/LINE
The
/SHAREqualifier permits the debugger to set tracepoints with in shareable image routines as well as other routines. The/NOSHAREqualifier specifies that tracepoints not be set within shareable images. -
- /SILENT
/NOSILENT (default) Controls whether the "trace …" message and the source line for the current location are displayed at the tracepoint. The
/NOSILENTqualifier specifies that the message is displayed. The/SILENTqualifier specifies that the message and source line are not displayed. The/SILENTqualifier overrides/SOURCE.- /SOURCE
/NOSOURCE (default) Controls whether the source line for the current location is displayed at the tracepoint. The
/SOURCEqualifier specifies that the source line is displayed. The/NOSOURCEqualifier specifies that the source line is not displayed. The/SILENTqualifier overrides/SOURCE. See also theSET STEP [NO]SOURCEcommand.- /SYSTEM (default)
/NOSYSTEM - Qualifies
/INTO. Use with/INTOand one of the following qualifiers:-
/BRANCH -
/CALL -
/INSTRUCTION -
/LINE
The
/SYSTEMqualifier permits the debugger to set tracepoints within system routines (P1 space) as well as other routines. The/NOSYSTEMqualifier specifies that tracepoints not be set within system routines. -
- /TEMPORARY
Causes the tracepoint to disappear after it is triggered (the tracepoint does not remain permanently set).
- /TERMINATING
(Default) Causes the debugger to trace when a process does an image exit. The debugger gains control and displays its prompt when the last image of a one-process or multiprocess program exits. See also the
/ACTIVATINGqualifier.
Description
Suspends program execution at the tracepoint location.
If you specified
/AFTERwhen you set the tracepoint, checks the AFTER count. If the specified number of counts has not been reached, execution is resumed and the debugger does not perform the remaining steps.Evaluates the expression in a WHEN clause, if you specified one when you set the tracepoint. If the value of the expression is false, execution is resumed and the debugger does not perform the remaining steps.
Reports that execution has reached the tracepoint location by issuing a "trace …" message, unless you specified
/SILENT.Displays the line of source code corresponding to the tracepoint, unless you specified
/NOSOURCEor/SILENTwhen you set the tracepoint or entered a previousSET STEP NOSOURCEcommand.Executes the commands in a DO clause, if you specified one when you set the tracepoint.
Resumes execution.
You set a tracepoint at a particular location in your program by specifying an address
expression with the SET TRACE command. You set a tracepoint on consecutive
source lines, classes of instructions, or events by specifying a qualifier with the SET
TRACE command. Generally, you must specify either an address expression or a
qualifier, but not both. Exceptions are /EVENT and
/RETURN.
The /LINE qualifier sets a tracepoint on each line of source code.
/LINE causes the debugger to trace every instruction of your program as
it executes and thus significantly slows down execution.-
/BRANCH -
/CALL -
/INSTRUCTION -
/RETURN -
/SYSEMULATE(Alpha only)
-
/ACTIVATING -
/EVENT=event-name -
/EXCEPTION -
/TERMINATING
-
/INTO -
/OVER -
/[NO]SHARE -
/[NO]SYSTEM
-
/[NO]SILENT -
/[NO]SOURCE
-
/AFTER:n -
/TEMPORARY
Use the /MODIFY qualifier to monitor changes at program locations
(typically changes in the values of variables).
If you set a tracepoint at a location currently used as a breakpoint, the breakpoint is canceled in favor of the tracepoint, and conversely.
Tracepoints can be user defined or predefined. User-defined tracepoints are set explicitly
with the SET TRACE command. Predefined tracepoints, which depend on the type
of program you are debugging (for example, Ada or multiprocess), are established automatically
when you start the debugger. Use the SHOW TRACE command to identify all
tracepoints that are currently set. Any predefined tracepoints are identified as such.
User-defined and predefined tracepoints are set and canceled independently. For example, a location or event can have both a user-defined and a predefined tracepoint. Canceling the user-defined tracepoint does not affect the predefined tracepoint, and conversely.
- (
ACTIVATE,DEACTIVATE,SHOW,CANCEL)TRACE -
CANCEL ALL -
GO -
SET BREAK - (
SET,SHOW)EVENT_FACILITY -
SET STEP [NO]SOURCE -
SET WATCH
Examples
DBG> SET TRACE SUB3
This command causes the debugger to trace the beginning of routine SUB3 when that routine is executed.
DBG> SET TRACE/BRANCH/CALL
This command causes the debugger to trace every BRANCH instruction and every CALL instruction encountered during program execution.
DBG> SET TRACE/LINE/INTO/NOSHARE/NOSYSTEM
This command causes the debugger to trace the beginning of every source line, including lines in called routines (
/INTO) but not in shareable image routines (/NOSHARE) or system routines (/NOSYSTEM).DBG> SET TRACE/NOSOURCE TEST5\%LINE 14 WHEN (X .NE. 2) DO (EXAMINE Y)
This command causes the debugger to trace line 14 of module TEST5 when X is not equal to 2. At the tracepoint, the
EXAMINE Ycommand is issued. The/NOSOURCEqualifier suppresses the display of source code at the tracepoint. The syntax of the conditional expression in the WHEN clause is language-dependent.DBG> SET TRACE/INSTRUCTION WHEN (X .NE. 0)
This command causes the debugger to trace when X is not equal to 0. The condition is tested at each instruction encountered during execution. The syntax of the conditional expression in the WHEN clause is language-dependent.
DBG> SET TRACE/SILENT SUB2 DO (SET WATCH K)
This command causes the debugger to trace the beginning of routine SUB2 during execution. At the tracepoint, the DO clause sets a watchpoint on variable K. The
/SILENTqualifier suppresses the "trace …" message and the display of source code at the tracepoint. This example shows a convenient way of setting a watchpoint on a nonstatic (stack or register) variable. A nonstatic variable is defined only when its defining routine (SUB2, in this case) is active (on the call stack).DBG> SET TRACE/RETURN ROUT4 DO (EXAMINE X)
This command causes the debugger to trace the return instruction of routine ROUT4 (that is, just before execution returns to the calling routine). At the tracepoint, the DO clause issues the
EXAMINE Xcommand. This example shows a convenient way of obtaining the value of a nonstatic variable just before execution leaves that variable's defining routine.DBG> SET TRACE/EVENT=TERMINATED
This command causes the debugger to trace the point at which any task makes a transition to the TERMINATED state.
SET TYPE
SET TYPE — Establishes the default type to be associated with program locations that do not have
a symbolic name (and, therefore, do not have an associated compiler-generated type). When used
with /OVERRIDE, it establishes the default type to be associated with all
locations, overriding any compiler-generated types.
Synopsis
SET TYPE [type-keyword]Parameters
|
ASCIC |
Sets the default type to counted ASCII string with a 1-byte count field that precedes the string and gives its length. AC is also accepted as a keyword. |
|
ASCID |
Sets the default type to ASCII string descriptor. The CLASS and DTYPE fields of the descriptor are not checked, but the LENGTH and POINTER fields provide the character length and address of the ASCII string. The string is then displayed. AD is also accepted as a keyword. |
|
ASCII: |
Sets the default type to ASCII character string (length |
|
ASCIW |
Sets the default type to counted ASCII string with a 2-byte count field that precedes the string and gives its length. This data type occurs in Pascal and PL/I. AW is also accepted as a keyword. |
|
ASCIZ |
Sets the default type to zero-terminated ASCII string. The ending zero byte indicates the end of the string. AZ is also accepted as a keyword. |
|
BYTE |
Sets the default type to byte integer (length 1 byte). |
|
D_FLOAT |
Sets the default type to D_floating (length 8 bytes). |
|
DATE_TIME |
Sets the default type to date and time. This is a quadword integer (length 8 bytes)
containing the internal representation of date and time. Values are displayed in the
format
dd-mmm-yyyy hh:mm:ss.cc. Specify an absolute date and time as
follows: [dd-mmm-yyyy[:]] [hh:mm:ss.cc] |
|
EXTENDED_FLOAT |
(Integrity servers and Alpha only) Sets the default type to IEEE X_floating (length 16 bytes). |
|
G_FLOAT |
Sets the default type to G_floating (length 8 bytes). |
|
INSTRUCTION |
Sets the default type to instruction (variable length, depending on the number of instruction operands and the kind of addressing modes used). |
|
LONG_FLOAT |
(Integrity servers and Alpha only) Sets the default type to IEEE S_Floating type (single precision, length 4 bytes). |
|
LONG_LONG_FLOAT |
(Integrity servers and Alpha only) Sets the default type to IEEE T_Floating type (double precision, length 8 bytes). |
|
LONGWORD |
Sets the default type to longword integer (length 4 bytes). This is the default type for program locations that do not have a symbolic name (do not have a compiler-generated type). |
|
OCTAWORD |
Sets the default type to octaword integer (length 16 bytes). |
|
PACKED: |
Sets the default type to packed decimal. The value of |
|
QUADWORD |
Sets the default type to quadword integer (length 8 bytes). This might be advisable for debugging 64-bit applications. |
|
TYPE=( |
Sets the default type to the type denoted by |
|
S_FLOAT |
(Integrity servers and Alpha only)Same as LONG_FLOAT. |
|
T_FLOAT |
(Integrity servers and Alpha only)Same as LONG_LONG_FLOAT. |
|
WORD |
Sets the default type to word integer (length 2 bytes). |
|
X_FLOAT |
(Integrity servers and Alpha only) Same as EXTENDED_FLOAT. |
Qualifiers
Description
When you use EXAMINE, DEPOSIT, or
EVALUATE commands, the default types associated with address expressions
affect how the debugger interprets and displays program entities.
The debugger recognizes the compiler-generated types associated with symbolic address expressions (symbolic names declared in your program), and it interprets and displays the contents of these locations accordingly. For program locations that do not have a symbolic name and, therefore, no associated compiler-generated type, the default type in all languages is longword integer, which is appropriate for debugging 32-bit applications.
The default data type for untyped storage locations is changed from longword (32-bits) to quadword (64-bits).
On Alpha systems, when debugging applications that use the 64-bit address space, you should
use the SET TYPE QUADWORD command.
The SET TYPE command enables you to change the default type associated
with locations that do not have a symbolic name. The SET TYPE/OVERRIDE
command enables you to set a default type for all program locations, both
those that do and do not have a symbolic name.
The EXAMINE and DEPOSIT commands have type qualifiers
(/ASCII, /BYTE, /G_FLOAT, and so on)
which enable you to override, for the duration of a single command, the type previously
associated with any program location.
-
CANCEL TYPE/OVERRIDE -
DEPOSIT -
EXAMINE - (
SET,SHOW,CANCEL)RADIX - (
SET,SHOW,CANCEL)MODE -
SHOW TYPE
Examples
DBG> SET TYPE ASCII:8
This command establishes an 8-byte ASCII character string as the default type associated with untyped program locations.
DBG> SET TYPE/OVERRIDE LONGWORD
This command establishes longword integer as the default type associated with both untyped program locations and program locations that have compiler-generated types.
DBG> SET TYPE D_FLOAT
This command establishes D_Floating as the default type associated with untyped program locations.
DBG> SET TYPE TYPE=(S_ARRAY)
This command establishes the type of the variable S_ARRAY as the default type associated with untyped program locations.
SET WATCH
SET WATCH — Establishes a watchpoint at the location denoted by an address expression.
Synopsis
SET WATCH [address-expression[, …]]Parameters
Specifies an address expression (a program location) at which a watchpoint is to be set. With high-level languages, this is typically the name of a program variable and can include a path name to uniquely specify the variable. More generally, an address expression can also be a memory address or a register and can be composed of numbers (offsets) and symbols, as well as one or more operators, operands, or delimiters. For information about the operators that you can use in address expressions, type Help Address_Expressions.
Do not specify the asterisk (*) wildcard character.
Specifies a conditional expression in the currently set language;the expression is to be evaluated whenever execution reaches the watchpoint. (The debugger checks the syntax of the expressions in the WHEN clause when execution reaches the watchpoint, not when the watchpoint is set.) If the expression is true, the debugger reports that a watchpoint has been triggered. If an action (DO clause) is associated with the watchpoint, it will occur at this time. If the expression is false, a report is not issued, the commands specified by the DO clause (if one was specified) are not executed, and program execution is continued.
Specifies a debugger command to be executed as part of the DO clause when watch action is taken. The debugger checks the syntax of the commands in a DO clause when it executes the DO clause, not when the watchpoint is set.
Qualifiers
- /AFTER:n
Specifies that watch action not be taken until the
nthtime the designated watchpoint is encountered (nis a decimal integer).Thereafter, the watchpoint occurs every time it is encountered provided that conditions in the WHEN clause are true. TheSET WATCH/AFTER:1command has the same effect asSET WATCH.- /INTO
Specifies that the debugger is to monitor a nonstatic variable by tracing instructions not only within the defining routine, but also within a routine that is called from the defining routine (and any other such nested calls). The
SET WATCH/INTOcommand enables you to monitor nonstatic variables within called routines more precisely thanSET WATCH/OVER; but the speed of execution within called routines is faster withSET WATCH/OVER.- /OVER
Specifies that the debugger is to monitor a nonstatic variable by tracing instructions only within the defining routine, not within a routine that is called by the defining routine. As a result, the debugger executes a called routine at normal speed and resumes tracing instructions only when execution returns to the defining routine. The
SET WATCH/OVERcommand provides faster execution thanSET WATCH/INTO; but if a called routine modifies the watched variable, execution is interrupted only upon returning to the defining routine. When you set watchpoints on nonstatic variables,SET WATCH/OVERis the default.- /SILENT
/NOSILENT (default) Controls whether the "watch …" message and the source line for the current location are displayed at the watchpoint. The
/NOSILENTqualifier specifies that the message is displayed. The/SILENTqualifier specifies that the message and source line are not displayed. The/SILENTqualifier overrides/SOURCE.- /SOURCE (default)
/NOSOURCE Controls whether the source line for the current location is displayed at the watchpoint. The
/SOURCEqualifier specifies that the source line is displayed. The/NOSOURCEqualifier specifies that the source line is not displayed. The/SILENTqualifier overrides/SOURCE. See also theSET STEP [NO]SOURCEcommand.- /STATIC
/NOSTATIC Enables you to override the debugger's default determination of whether a specified variable (watchpoint location) is static or nonstatic. The
/STATICqualifier specifies that the debugger should treat the variable as a static variable, even though it might be allocated in P1 space. This causes the debugger to monitor the location by using the faster write-protection method rather than by tracing every instruction. The/NOSTATICqualifier specifies that the debugger should treat the variable as a nonstatic variable, even though it might be allocated in P0 space, and causes the debugger to monitor the location by tracing every instruction. Be careful when using these qualifiers.- /TEMPORARY
Causes the watchpoint to disappear after it is triggered (the watchpoint does not remain permanently set).
Description
Suspends program execution after that instruction has completed execution.
If you specified
/AFTERwhen you set the watchpoint, checks the AFTER count. If the specified number of counts has not been reached, execution continues and the debugger does not perform the remaining steps.Evaluates the expression in a WHEN clause, if you specified one when you set the watchpoint. If the value of the expression is false, execution continues and the debugger does not perform the remaining steps.
Reports that execution has reached the watchpoint location ("watch of …") unless you specified
/SILENT.Reports the old (unmodified) value at the watchpoint location.
Reports the new (modified) value at the watchpoint location.
Displays the line of source code at which execution is suspended, unless you specified
/NOSOURCEor/SILENTwhen you set the watchpoint or entered a previousSET STEP NOSOURCEcommand.Executes the commands in a DO clause, if you specified one when you set the watchpoint. If the DO clause contains a
GOcommand, execution continues and the debugger does not perform the next step.Issues the prompt.
For high-level language programs, the address expressions you specify with the SET
WATCH command are typically variable names. If you specify an absolute memory address
that is associated with a compiler-generated type, the debugger symbolizes the address and uses
the length in bytes associated with that type to determine the length in bytes of the watchpoint
location. If you specify an absolute memory address that the debugger cannot associate with a
compiler-generated type, the debugger watches 4 bytes of memory (by default), beginning at the
byte identified by the address expression. You can change this length, however, by setting the
type to either WORD (SET TYPE WORD, which changes the default length to 2
bytes) or BYTE (SET TYPE BYTE, which changes the default length to 1 byte).
SET TYPE LONGWORD restores the default length of 4 bytes.
SET WATCH 30000:300018
The debugger establishes a series of longword watches that cover the range.
You can set watchpoints on aggregates (that is, entire arrays or records). A watchpoint set on an array or record triggers if any element of the array or record changes. Thus, you do not need to set watchpoints on individual array elements or record components. Note, however, that you cannot set an aggregate watchpoint on a variant record.
You can also set a watchpoint on a record component, on an individual array element, or on an array slice (a range of array elements). A watchpoint set on an array slice triggers if any element within that slice changes. When setting the watchpoint, follow the syntax of the current language.
-
/[NO]SILENT -
/[NO]SOURCE
-
/AFTER:n -
/TEMPORARY
-
/INTO -
/OVER
-
/[NO]STATIC
Static and Nonstatic Watchpoints
The technique for setting a watchpoint depends on whether the variable is static or nonstatic.
A static variable is associated with the same memory address throughout execution of the program. You can always set a watchpoint on a static variable throughout execution.
A nonstatic variable is allocated on the call stack or in a register and has a value only when its defining routine is active (on the call stack). Therefore, you can set a watchpoint on a nonstatic variable only when execution is currently suspended within the scope of the defining routine (including any routine called by the defining routine). The watchpoint is canceled when execution returns from the defining routine. With a nonstatic variable, the debugger traces every instruction to detect any changes in the value of a watched variable or location.
Another distinction between static and nonstatic watchpoints is speed of execution. To watch a static variable, the debugger write-protects the page containing the variable. If your program attempts to write to that page, an access violation occurs and the debugger handles the exception, determining whether the watched variable was modified. Except when writing to that page, the program executes at normal speed.
To watch a nonstatic variable, the debugger traces every instruction in the variable's defining routine and checks the value of the variable after each instruction has been executed. Since this significantly slows execution, the debugger issues a message when you set a nonstatic watchpoint.
As explained in the next paragraphs, /[NO]STATIC,
/INTO, and /OVER enable you to exercise some control over
speed of execution and other factors when watching variables.
The debugger determines whether a variable is static or nonstatic by checking how it is allocated. Typically, a static variable is in P0 space (0 to 3FFFFFFF, hexadecimal); a nonstatic variable is in P1 space (40000000 to 7FFFFFFF) or in a register. The debugger issues a warning if you try to set a watchpoint on a variable that is allocated in P1 space or in a register when execution is not currently suspended within the scope of the defining routine.
The /[NO]STATIC qualifiers enable you to override this default behavior.
For example, if you have allocated nonstack storage in P1 space, use /STATIC
when setting a watchpoint on a variable that is allocated in that storage area. This enables the
debugger to use the faster write-protection method of watching the location instead of tracing
every instruction. Conversely, if, for example, you have allocated your own call stack in P0
space, use /NOSTATIC when setting a watchpoint on a variable that is
allocated on that call stack. This enables the debugger to treat the watchpoint as a nonstatic
watchpoint.
You can also control the execution speed for nonstatic watchpoints in called routines by
using /INTO and /OVER.
On Alpha processors both static and nonstatic watchpoints are available. With static watchpoints, the debugger write-protects the page of memory in which the watched variable is stored. Static watchpoints, therefore, would interfere with the system service itself if not for the debugger's use of system service interception (SSI).
If a static watchpoint is in effect then, through system service interception, the debugger deactivates the static watchpoint, asynchronous traps (ASTs), and thread switching, just before the system service call. The debugger reactivates them just after the system service call completes, putting the watchpoint, AST enabling, and thread switching back to their original state and, finally, checking for any watchpoint hits. This behavior is designed to allow the system service to run as it normally would (that is, without write-protected pages) and to prevent the AST code or a different thread from potentially changing the watchpointed location while the watchpoint is deactivated. Be aware of this behavior if, for example, your application tests to see if ASTs are enabled.
An active static watchpoint can cause a system service to fail, likely with an ACCVIO status, if the system service is not supported by the system service interception (SSI) vehicle (SYS$SSISHR on OpenVMS Alpha systems). Any system service that is not in SYS$PUBLIC_VECTORS is unsupported by SSI, including User Written System Services (UWSS) and any loadable system services, such as $MOUNT.
When a static watchpoint is active, the debugger write-protects the page containing the variable to be watched. A system service call not supported by SSI can fail if it tries to write to that page of user memory.
Deactivate the static watchpoint before the service call. When the call completes, check the watchpoint manually and reactivate it.
Use nonstatic watchpoints. Note that nonstatic watchpoints can slow execution.
If a watched location changes during a system service routine, you will be notified, as
usual, that the watchpoint occurred. Note that, on rare occasions, stack may show one or more
debugger frames on top of the frame or frames for your program. To work around this problem,
enter one or more STEP/RETURN commands to get back to your program.
$ DEFINE SSI$AUTO_ACTIVATE OFF
$ DEFINE SSI$AUTO_ACTIVATE ON $ DEASSIGN SSI$AUTO_ACTIVATE
Global Section Watchpoints (Integrity servers and Alpha Only)
On Alpha, you can set watchpoints on variables or arbitrary program locations in global sections. A global section is a region of memory that is shared among all processes of a multiprocess program. A watchpoint that is set on a location in a global section (a global section watchpoint) triggers when any process modifies the contents of that location.
You set a global section watchpoint just as you would set a watchpoint on a static
variable. However, because of the way the debugger monitors global section watchpoints, note the
following point. When setting watchpoints on arrays or records, performance is improved if you
specify individual elements rather than the entire structure with the SET
WATCH command.
If you set a watchpoint on a location that is not yet mapped to a global section, the watchpoint is treated as a conventional static watchpoint. When the location is subsequently mapped to a global section, the watchpoint is automatically treated as a global section watchpoint and an informational message is issued. The watchpoint is then visible from each process of the multiprocess program.
- (
ACTIVATE,DEACTIVATE,SHOW,CANCEL)WATCH -
MONITOR -
SET BREAK -
SET STEP [NO]SOURCE -
SET TRACE
Examples
DBG> SET WATCH MAXCOUNT
This command establishes a watchpoint on the variable MAXCOUNT.
DBG> SET WATCH ARR DBG> GO … watch of SUBR\ARR at SUBR\%LINE 12+8 old value: (1): 7 (2): 12 (3): 3 new value: (1): 7 (2): 12 (3): 28 break at SUBR\%LINE 14 DBG>In this example, the
SET WATCHcommand sets a watchpoint on the three-element integer array, ARR. Execution is then resumed with theGOcommand. The watchpoint triggers whenever any array element changes. In this case, the third element changed.DBG> SET WATCH ARR(3)
This command sets a watchpoint on element 3 of array ARR (Fortran array syntax). The watchpoint triggers whenever element 3 changes.
DBG> SET WATCH P_ARR[3:5]
This command sets a watchpoint on the array slice consisting of elements 3 to 5 of array P_ARR (Pascal array syntax). The watchpoint triggers whenever any of these elements change.
DBG> SET WATCH P_ARR[3]:P_ARR[5]
This command sets a separate watchpoint on each of elements 3 to 5 of array P_ARR (Pascal array syntax). Each watchpoint triggers whenever its target element changes.
DBG> SET TRACE/SILENT SUB2 DO (SET WATCH K)
In this example, variable K is a nonstatic variable and is defined only when its defining routine, SUB2, is active (on the call stack). The
SET TRACEcommand sets a tracepoint on SUB2. When the tracepoint is triggered during execution, the DO clause sets a watchpoint on K. The watchpoint is then canceled when execution returns from routine SUB2. The/SILENTqualifier suppresses the "trace …" message and the display of source code at the tracepoint.DBG> GO %DEBUG-I-ASYNCSSWAT, possible asynchronous system service and static watchpoint collision break at LARGE_UNION\main\%LINE 24192+60 DBG> SHOW CALL module name routine name line rel PC abs PC *LARGE_UNION main 24192 00000000000003A0 00000000000303A0 *LARGE_UNION __main 24155 0000000000000110 0000000000030110 FFFFFFFF80B90630 FFFFFFFF80B90630 DBG> EX/SOURCE %line 24192 module LARGE_UNION 24192: sstatus = sys$getsyi (EFN$C_ENF, &sysid, 0, &syi_ile, &myiosb, 0, 0);In this example, an asynchronous write by SYS$QIO to its IOSB output parameter fails if that IOSB is being watched directly or even if it simply lives on the same page as an active static watchpoint.
Debugger notices this problem and warns the user about potential collisions between static watchpoints and asynchronous system services.
Type
HELP MESSAGE ASYNCSSWATin the debugger to learn more about the actions to take when this condition is detected.
SET WINDOW
SET WINDOW — Creates a screen window definition.
Synopsis
SET WINDOW [window-name]Note
This command is not available in the VSI DECwindows Motif for OpenVMS user interface to the debugger.
Parameters
Specifies the name of the window you are defining. If a window definition with that name already exists, it is canceled in favor of the new definition.
Specifies the starting line number of the window. This line displays the window title, or header line. The top line of the screen is line 1.
Specifies the number of text lines in the window, not counting the header line. The value
must be at least 1. The sum of start-line and
line-count must not exceed the current screen height.
Specifies the starting column number of the window. This is the column at which the first character of the window is displayed. The leftmost column of the screen is column 1.
Specifies the number of characters per line in the window. The value must be at least 1.
The sum of start-column and column-countmust not
exceed the current screen width.
Description
A screen window is a rectangular region on the terminal screen through which you can view a
display. The SET WINDOW command establishes a window definition by
associating a window name with a screen region. You specify the screen region in terms of a
starting line and height (line count) and, optionally, a starting column and width (column
count). If you do not specify the starting column and column count, the starting column defaults
to column 1 and the column count defaults to the current screen width.
You can specify a window region in terms of expressions that use the built-in symbols %PAGE and %WIDTH.
You can use the names of any windows you have defined with the SET
WINDOW command in a DISPLAY command to position displays on the
screen.
Window definitions are dynamic - that is, window dimensions expand and contract
proportionally when a SET TERMINAL command changes the screen width or
height.
-
DISPLAY - (
SHOW,CANCEL)DISPLAY - (
SET,SHOW)TERMINAL - (
SHOW,CANCEL)WINDOW
Examples
DBG> SET WINDOW ONELINE AT (1, 1)
This command defines a window named ONELINE at the top of the screen. The window is one line deep and, by default, spans the width of the screen.
DBG> SET WINDOW MIDDLE AT (9, 4, 30, 20)
This command defines a window named MIDDLE at the middle of the screen. The window is 4 lines deep starting at line 9, and 20 columns wide starting at column 30.
DBG> SET WINDOW FLEX AT (%PAGE/4, %PAGE/2, %WIDTH/4, %WIDTH/2)
This command defines a window named FLEX that occupies a region around the middle of the screen and is defined in terms of the current screen height (%PAGE) and width (%WIDTH).
SHOW ABORT_KEY
SHOW ABORT_KEY — Identifies the Ctrl-key sequence currently defined to abort the execution of a
debugger command or to interrupt program execution.
Synopsis
SHOW ABORT_KEY Note
This command is not available in the VSI DECwindows Motif for OpenVMS user interface to the debugger.
Description
By default, the Ctrl/C sequence, when entered within a
debugging session, aborts the execution of a debugger command and interrupts program execution.
The SET ABORT_KEY command enables you to assign the abort function to another
Ctrl-key sequence. The SHOW ABORT_KEY command identifies the Ctrl-key
sequence currently in effect for the abort function.
-
Ctrl/C -
SET ABORT_KEY
Example
DBG> SHOW ABORT_KEY Abort Command Key is CTRL_C DBG> SET ABORT_KEY = CTRL_P DBG> SHOW ABORT_KEY Abort Command Key is CTRL_P DBG>
In this example, the first SHOW ABORT_KEY command identifies the default
abort command key sequence, Ctrl/C. The SET ABORT_KEY =
CTRL_P command assigns the abort-command function to Ctrl/P, as
confirmed by the second SHOW ABORT_KEY command.
SHOW AST
SHOW AST — Indicates whether delivery of asynchronous system traps (ASTs) is enabled or
disabled.
Synopsis
SHOW AST Description
The SHOW AST command indicates whether delivery of ASTs is enabled or
disabled. The command does not identify an AST whose delivery is pending. The delivery of ASTs
is enabled by default and with the ENABLE AST command. The delivery of ASTs
is disabled with the DISABLE AST command.
- (
ENABLE,DISABLE)AST
Example
DBG> SHOW AST ASTs are enabled DBG> DISABLE AST DBG> SHOW AST ASTs are disabled DBG>
The SHOW AST command indicates whether the delivery of ASTs is enabled.
SHOW ATSIGN
SHOW ATSIGN — Identifies the default file specification established with the last SET
ATSIGN command. The debugger uses this file specification when processing the execute
procedure (@) command.
Synopsis
SHOW ATSIGN Description
-
@(Execute Procedure) -
SET ATSIGN
Examples
DBG> SHOW ATSIGN No indirect command file default in effect, using DEBUG.COM DBG>
This example shows that if you did not use the
SET ATSIGNcommand, the debugger assumes command procedures have the default file specificationSYS$DISK:[]DEBUG.COM.DBG> SET ATSIGN USER:[JONES.DEBUG].DBG DBG> SHOW ATSIGN Indirect command file default is USER:[JONES.DEBUG].DBG DBG>
In this example, the
SHOW ATSIGNcommand indicates the default file specification for command procedures, as previously established with theSET ATSIGNcommand.
SHOW BREAK
SHOW BREAK — Displays information about breakpoints.
Synopsis
SHOW BREAK Qualifiers
Description
The SHOW BREAK command displays information about breakpoints that are
currently set, including any options such as WHEN or DO clauses, /AFTER
counts, and so on, and whether the breakpoints are deactivated.
By default, SHOW BREAK displays information about both user-defined and
predefined breakpoints (if any). This is equivalent to entering the SHOW
BREAK/USER/PREDEFINED command. User-defined breakpoints are set with the SET
BREAK command. Predefined breakpoints are set automatically when you start the
debugger, and they depend on the type of program you are debugging.
If you established a breakpoint using SET BREAK/AFTER:
, the nSHOW BREAK command displays the
current value of the decimal integer n, that is, the originally specified
integer value minus 1 for each time the breakpoint location was reached. (The debugger
decrements n each time the breakpoint location is reached until the value of
n is 0, at which time the debugger takes break action.)
On Alpha systems, the SHOW BREAK command does not display
individual instructions when the break is on a particular class of instruction (as with
SET BREAK/CALL or SET BREAK/RETURN).
- (
ACTIVATE,CANCEL,DEACTIVATE,SET)BREAK
Examples
DBG> SHOW BREAK breakpoint at SUB1\LOOP breakpoint at MAIN\MAIN+1F do (EX SUB1\D ; EX/SYMBOLIC PSL; GO) breakpoint at routine SUB2\SUB2 /after: 2 DBG>
The
SHOW BREAKcommand identifies all breakpoints that are currently set. This example indicates user-defined breakpoints that are triggered whenever execution reaches SUB1 \LOOP, MAIN \MAIN, and SUB2 \SUB2, respectively.DBG> SHOW BREAK/PREDEFINED predefined breakpoint on Ada event "DEPENDENTS_EXCEPTION" for any value predefined breakpoint on Ada event "EXCEPTION_TERMINATED" for any value DBG>
This command identifies the predefined breakpoints that are currently set. The example shows two predefined breakpoints, which are associated with Ada tasking exception events. These breakpoints are set automatically by the debugger for all Ada programs and for any mixed language program that is linked with an Ada module.
Synopsis
SHOW CALLS [integer]Parameters
A decimal integer that specifies the number of routine calls to be identified. If you omit the parameter, the debugger identifies all routine calls for which it has information.
Qualifiers
- /IMAGE
Displays the image name for each active call on the call stack.
Description
The SHOW CALLS command shows a traceback that lists the sequence of
active routine calls that lead to the routine in which execution appears suspended. Each
recursive routine call is shown in the display, that is, you can use the SHOW
CALLS command to examine the chain of recursion.
SHOW CALLS displays one line of information for each call frame on the
call stack, starting with the most recent call. The top line identifies the currently executing
routine, the next line identifies its caller, the following line identifies the caller of the
caller, and so on.
Even if your program contains no routine calls, the SHOW CALLS command
displays an active call because your program has at least one stack frame built for it when it
is first activated.
On Integrity server and Alpha processors, you also usually see a system and sometimes a DCL
base frame. Note that if the SHOW CALLS display shows no active calls, either
your program has terminated or the call stack has been corrupted. As your program executes,
whenever a call is made to a routine a new call frame is built on the stack(s) or in the
register set. Each call frame stores information about the calling or current routine. For
example, the frame PC value enables the SHOW CALLS command to symbolize to
module and routine information.
On Alpha processors, a routine invocation results in either a stack frame procedure (with a call frame on the memory stack), a register frame procedure (with a call frame stored in the register set), or a null frame procedure (without a call frame).
On Integrity server processors, a routine invocation can result in a memory stack
frame and/or a register stack frame. That is, there two stacks on Integrity servers, register
and memory. An Integrity server routine invocation could result in call frames on one or the
other or both of those stacks. Also, an Integrity server leaf routine invocation (that does not
itself make calls)can result in a null frame procedure, without a call frame on either stack.
SHOW CALLS provides one line of information, regardless of the which stack
or register results. (See the examples below.)
SHOW CALLS display:The name of the enclosing module. An asterisk (*) to the left of a module name indicates that the module is set.
The name of the calling routine, provided the module is set (the first line shows the currently executing routine).
The line number where the call was made in that routine, provided the module is set (the first line shows the line number at which execution is suspended).
The value of the PC in the calling routine at the time that control was transferred to the called routine.On Integrity server and Alpha processors, the PC is shown as a memory address relative to the first code address in the module and also as an absolute address.
When you specify the
/IMAGEqualifier, the debugger first does aSET IMAGEcommand for each image that has debug information (that is, it was linked using the/DEBUGor/TRACEBACKqualifier). The debugger then displays the image name for each active call on the calls stack. The output display has been expanded and displays the image name in the first column.The debugger suppresses the share$image_name module name, because that information is provided by the
/IMAGEqualifier.The
SET IMAGEcommand lasts only for the duration of theSHOW CALLS/IMAGEcommand. The debugger restores the set image state when theSHOW CALLS/IMAGEcommand is complete.
SHOW CALLS
command may include system call frames in addition to the user call frames associated with your
program. System call frames appear in the following circumstances:During exception dispatch
During asynchronous system trap dispatch
During system service dispatch
When a watchpoint triggers in system space
When stepping into system (includes installed resident RTLs) space
As the call stack base frame
The display of system call frames does not indicate a problem.
-
SHOW SCOPE -
SHOW STACK
Examples
DBG> SHOW CALLS module name routine name line rel PC abs PC *MAIN FFFF 31 00000000000002B8 00000000000203C4 -the above appears to be a null frame in the same scope as the frame below *MAIN MAIN 13 00000000000000A8 00000000000200A8
This example is on an Alpha system. Note that sections of routine prologues and epilogues appear to the debugger to be null frames. The portion of the prologue before the change in the frame pointer (FP) and the portion of the epilogue after restoration of the FP each look like a null frame, and are reported accordingly.
DBG> SHOW CALLS module name routine name line rel PC abs PC *MAIN FFFF 18 0000000000000190 0000000000010190 *MAIN MAIN 14 0000000000000180 0000000000010180 FFFFFFFF80C2A200 FFFFFFFF80C2A200This example is on Integrity servers. Note that Integrity server prologues do not appear to be null frames to the debugger.
SHOW DEFINE
SHOW DEFINE — Identifies the default (/ADDRESS, /COMMAND,
/PROCESS_GROUP, or /VALUE) currently in effect for the
DEFINE command.
Synopsis
SHOW DEFINE []Description
The default qualifier for the DEFINE command is the one last established
with the SET DEFINE command. If you did not enter a SET
DEFINE command, the default qualifier is /ADDRESS.
To identify a symbol defined with the DEFINE command, use the
SHOW SYMBOL/DEFINED command.
-
DEFINE -
DEFINE/PROCESS_SET -
DELETE -
SET DEFINE -
SHOW SYMBOL/DEFINED
Example
DBG> SHOW DEFINE Current setting is: DEFINE/ADDRESS DBG>
This command indicates that the DEFINE command is set for definition by
address.
SHOW DISPLAY
SHOW DISPLAY — Identifies one or more existing screen displays.
Synopsis
SHOW DISPLAY [display-name[, …]]Note
This command is not available in the VSI DECwindows Motif for OpenVMS user interface to the debugger.
Parameters
Specifies the name of a display. If you do not specify a name, or if you specify the
asterisk (*) wildcard character by itself, all display definitions are listed.
You can use the wildcard within a display name. Do not specify a display name with the
/ALL qualifier.
Description
The SHOW DISPLAY command lists all displays according to their order in
the display list. The most hidden display is listed first, and the display that is on top of the
display pasteboard is listed last.
For each display, the SHOW DISPLAY command lists its name, maximum size,
screen window, and display kind (including any debug command list). It also identifies whether
the display is removed from the pasteboard or is dynamic (a dynamic display automatically
adjusts its window dimensions if the screen size is changed with the SET
TERMINAL command).
-
DISPLAY -
EXTRACT/SCREEN_LAYOUT - (
CANCEL)DISPLAY - (
SET,CANCEL,SHOW)WINDOW -
SHOW SELECT
Example
DBG> SHOW DISPLAY
display SRC at H1, size = 64, dynamic
kind = SOURCE (EXAMINE/SOURCE .%SOURCE_SCOPE\%PC)
display INST at H1, size = 64, removed, dynamic
kind = INSTRUCTION (EXAMINE/INSTRUCTION .0\%PC)
display REG at RH1, size = 64, removed, dynamic, kind = REGISTER
display OUT at S45, size = 100, dynamic, kind = OUTPUT
display EXSUM at Q3, size = 64, dynamic, kind = DO (EXAMINE SUM)
display PROMPT at S6, size = 64, dynamic, kind = PROGRAM
DBG>The SHOW DISPLAY command lists all displays currently defined. In this
example, they include the five predefined displays (SRC, INST, REG, OUT, and PROMPT), and the
user-defined DO display EXSUM. Displays INST and REG are removed from the display pasteboard:
the DISPLAY command must be used to display them on the screen.
SHOW EDITOR
SHOW EDITOR — Indicates the action taken by the EDIT command, as established by
the SET EDITOR command.
Synopsis
SHOW EDITOR Description
-
EDIT -
SET EDITOR
Examples
DBG> SHOW EDITOR The editor is SPAWNed, with command line "EDT/START_POSITION=(n, 1)" DBG>In this example, the
EDITcommand spawns the EDT editor in a subprocess. The/START_POSITIONqualifier appended to the command line indicates that the editing cursor is initially positioned at the beginning of the line that is centered in the debugger's current source display.DBG> SET EDITOR/CALLABLE_TPU DBG> SHOW EDITOR The editor is CALLABLE_TPU, with command line "TPU" DBG>
In this example, the
SHOW EDITORcommand indicates that theEDITcommand invokes the callable version of the DEC Text Processing Utility (DECTPU). The editing cursor is initially positioned at the beginning of source line 1.
SHOW EVENT_FACILITY
SHOW EVENT_FACILITY — Identifies the current event facility and the associated event names. Event
facilities are available for programs that call Ada routines or that use POSIX Threads services.
On VAX, event facilities are also available for programs that call SCAN routines.
Synopsis
SHOW EVENT_FACILITY Description
The current event facility (ADA, THREADS, or SCAN) defines the event points that you can set
with the SET BREAK/EVENT and SET TRACE/EVENT commands.
The SHOW EVENT_FACILITY command identifies the event names associated
with the current event facility. These are the keywords that you can specify with the
(SET, CANCEL) BREAK/EVENT and
(SET, CANCEL) TRACE/EVENT commands.
- (
SET,CANCEL)BREAK/EVENT -
SET EVENT_FACILITY - (
SET,CANCEL)TRACE/EVENT -
SHOW BREAK -
SHOW TASK -
SHOW TRACE
Example
DBG> SHOW EVENT_FACILITY
event facility is THREADS
…This command identifies the current event facility to be THREADS (POSIX Threads) and lists
the associated event names that can be used with SET BREAK/EVENT or
SET TRACE/EVENT commands.
SHOW EXIT_HANDLERS
SHOW EXIT_HANDLERS — Identifies the exit handlers that have been declared in your program.
Synopsis
SHOW EXIT_HANDLERS Description
The exit handler routines are displayed in the order that they are called (that is, last in, first out). The routine name is displayed symbolically, if possible. Otherwise, its address is displayed. The debugger's exit handlers are not displayed.
Example
DBG> SHOW EXIT_HANDLERS exit handler at STACKS\CLEANUP DBG>
This command identifies the exit handler routine CLEANUP, which is declared in module STACKS.
SHOW IMAGE
SHOW IMAGE — Displays information about one or more images that are part of your running program.
Synopsis
SHOW IMAGE [image-name]Parameters
Specifies the name of an image to be included in the display. If you do not specify a name, or if you specify the asterisk (*) wildcard character by itself, all images are listed. You can use the wildcard within an image name.
Qualifiers
- /FULL
Displays complete information for a running image. This information includes all of the image sections and their addresses.
- /ALL
Displays all the images, including those for which the Debugger was unable to complete processing. In that case, the debugger shows the image name without the base and end address.
Description
SHOW IMAGE command displays the following information: Name of the image
Start and end addresses of the image
Whether the image has been set with the
SET IMAGEcommand (loaded into the run-time symbol table, RST)Current image that is your debugging context (marked with an asterisk (*))
Total number of images selected in the display
Approximate number of bytes allocated for the RST and other internal structures
A summary of the address space occupied by the images in your process
On Integrity servers and Alpha, if you specify an image name or use the
/FULL qualifier, the image sections for the image are also displayed.
On Integrity servers, the /ALL qualifier displays all the images,
including those for which the Debugger is unable to complete processing. In that case, the
debugger shows the image name without the base and end address.
DBG> SHOW IMAGE/ALL
image name set base address end address
CMA$TIS_SHR no 000000007B54A000 000000007B5694EF
*C_MAIN yes 0000000000010000 00000000000400F7
C_SHARED_AV no 0000000000042000 00000000000A20DF
DBGTBKMSG no 000000000068A000 0000000000697D03
DCL no 000000007ADCC000 000000007AEF7217
DEBUG no 00000000002DC000 000000000062F037
DECC$MSG no 000000000067E000 0000000000681F5F
DECC$SHR no 000000007B8F6000 000000007B95803F
DPML$SHR no 000000007B6DC000 000000007B738C97
LIBOTS no 000000007B37C000 000000007B38D9B7
LIBRTL no 000000007B34A000 000000007B37A06F
SHRIMGMSG no 0000000000682000 000000000068881C
SYS$PUBLIC_VECTORS no
SYS$SSISHR no 0000000000630000 00000000006442F7
SYS$SSISHRP no 0000000000646000 00000000006501F7
TIE$SHARE no 00000000000A4000 00000000002A87CFSHOW IMAGE does not display all of the memory ranges of an image
installed using the /RESIDENT qualifier. Instead, this command displays only
the process data region.
- (
SET,CANCEL)IMAGE - (
SET,SHOW)MODULE
Example
DBG> SHOW IMAGE SHARE* image name set base address end address *SHARE yes 00000200 00000FFF SHARE1 no 00001000 000017FF SHARE2 yes 00018C00 000191FF SHARE3 no 00019200 000195FF SHARE4 no 00019600 0001B7FF total images: 5 bytes allocated: 33032 DBG>
This SHOW IMAGE command identifies all of the images whose names start
with SHARE and which are associated with the program. Images SHARE and SHARE2 are set. The
asterisk (*) identifies SHARE as the current image.
SHOW KEY
SHOW KEY — Displays the debugger predefined key definitions and those created by the
DEFINE/KEY command.
Synopsis
SHOW KEY [key-name]Note
This command is not available in the VSI DECwindows Motif for OpenVMS user interface to the debugger.
Parameters
/ALL qualifier. Do
not specify a key name with /ALL or /DIRECTORY. Valid key
names are as follows: |
Key Name |
LK201 Keyboard |
VT100-type |
VT52-type |
|---|---|---|---|
|
PF1 |
PF1 |
PF1 |
Blue |
|
PF2 |
PF2 |
PF2 |
Red |
|
PF3 |
PF3 |
PF3 |
Black |
|
PF4 |
PF4 |
PF4 | |
|
KP0--KP9 |
Keypad 0--9 |
Keypad 0--9 |
Keypad 0--9 |
|
PERIOD |
Keypad period (.) |
Keypad period (.) | |
|
COMMA |
Keypad comma (, ) |
Keypad comma (, ) | |
|
ENTER |
Enter |
ENTER |
ENTER |
|
E1 |
Find | ||
|
E2 |
Insert Here | ||
|
E3 |
Remove | ||
|
E4 |
Select | ||
|
E5 |
Prev Screen | ||
|
E6 |
Next Screen | ||
|
HELP |
Help | ||
|
DO |
Do | ||
|
F6--F20 |
F6--F20 |
Qualifiers
- /ALL
Displays all key definitions for the current state, by default, or for the states specified with
/STATE.- /BRIEF
Displays only the key definitions (by default, all qualifiers associated with a key definition are also shown, including any specified state).
- /DIRECTORY
Displays the names of all the states for which keys have been defined. Do not specify other qualifiers with this qualifier.
- /STATE=(state-name [, …])
/NOSTATE (default) Selects one or more states for which a key definition is displayed. The
/STATEqualifier displays key definitions for the specified states. You can specify predefined key states, such as DEFAULT and GOLD, or user-defined states. A state name can be any appropriate alphanumeric string. The/NOSTATEqualifier displays key definitions for the current state only.
Description
Keypad mode must be enabled (SET MODE KEYPAD) before you can use this
command. Keypad mode is enabled by default.
By default, the current key state is the DEFAULT state. You can change the current state by
using the SET KEY/STATE command or by pressing a key that causes a state
change (that is, a key that was defined with DEFINE/KEY/LOCK_STATE or
/SET_STATE).
-
DEFINE/KEY -
DELETE/KEY -
SET KEY
Examples
DBG> SHOW KEY/ALL
This command displays all the key definitions for the current state.
DBG> SHOW KEY/STATE=BLUE KP8 GOLD keypad definitions: KP8 = "Scroll/Top" (noecho, terminate, nolock) DBG>
This command displays the definition for keypad key 8 in the BLUE state.
DBG> SHOW KEY/BRIEF KP8 DEFAULT keypad definitions: KP8 = "Scroll/Up" DBG>
This command displays the definition for keypad key 8 in the current state.
DBG> SHOW KEY/DIRECTORY MOVE_GOLD MOVE_BLUE MOVE GOLD EXPAND_GOLD EXPAND_BLUE EXPAND DEFAULT CONTRACT_GOLD CONTRACT_BLUE CONTRACT BLUE DBG>
This command displays the names of the states for which keys have been defined.
SHOW LANGUAGE
SHOW LANGUAGE — Identifies the current language.
Synopsis
SHOW LANGUAGE Description
The current language is the language last established with the SET
LANGUAGE command. If you did not enter a SET LANGUAGE command, the
current language is, by default, the language of the module containing the main program.
-
SET LANGUAGE
Example
DBG> SHOW LANGUAGE language: BASIC DBG>
This command displays the name of the current language as BASIC.
SHOW LOG
SHOW LOG — Indicates whether the debugger is writing to a log file and identifies the current
log file.
Synopsis
SHOW LOG Description
The current log file is the log file last established by a SET LOG
command. By default, if you did not enter a SET LOG command, the current log
file is the file SYS$DISK:[]DEBUG.LOG.
-
SET LOG -
SET OUTPUT [NO]LOG -
SET OUTPUT [NO]SCREEN_LOG
Examples
DBG> SHOW LOG not logging to DEBUG.LOG DBG>
This command displays the name of the current log file as
DEBUG.LOG(the default log file) and reports that the debugger is not writing to it.DBG> SET LOG PROG4 DBG> SET OUTPUT LOG DBG> SHOW LOG logging to USER$:[JONES.WORK]PROG4.LOG DBG>
In this example, the
SET LOGcommand establishes that the current log file isPROG4.LOG(in the current default directory). TheSET OUTPUT LOGcommand causes the debugger to log debugger input and output into that file. TheSHOW LOGcommand confirms that the debugger is writing to the log filePROG4.COMin your current default directory.
SHOW MARGINS
SHOW MARGINS — Identifies the current source-line margin settings for displaying source code.
Synopsis
SHOW MARGINS Note
This command is not available in the VSI DECwindows Motif for OpenVMS user interface to the debugger.
Description
The current margin settings are the margin settings last established with the SET
MARGINS command. By default, if you did not enter a SET MARGINS
command, the left margin is set to 1 and the right margin is set to 255.
-
SET MARGINS
Examples
DBG> SHOW MARGINS left margin: 1 , right margin: 255 DBG>
This command displays the default margin settings of 1 and 255.
DBG> SET MARGINS 50 DBG> SHOW MARGINS left margin: 1 , right margin: 50 DBG>
This command displays the default left margin setting of 1 and the modified right margin setting of 50.
DBG> SET MARGINS 10:60 DBG> SHOW MARGINS left margin: 10 , right margin: 60 DBG>
This command displays both margin settings modified to 10 and 60.
SHOW MODE
SHOW MODE — Identifies the current debugger modes (screen or no screen, keypad or no keypad, and
so on) and the current radix.
Synopsis
SHOW MODE Description
SET
MODE command. By default, if you did not enter a SET MODE command,
the current modes are the following:-
DYNAMIC -
NOG_FLOAT(D_float) -
INTERRUPT -
KEYPAD -
LINE -
NOSCREEN -
SCROLL -
NOSEPARATE -
SYMBOLIC
- (
SET,CANCEL)MODE - (
SET,SHOW,CANCEL)RADIX
Example
DBG> SHOW MODE modes: symbolic, line, d_float, screen, scroll, keypad, dynamic, nointerrupt, wait, no separate window source line trim: linecontrol input radix : decimal output radix: decimal DBG>
The SHOW MODE command displays the current modes and current input and
output radix.
SHOW MODULE
SHOW MODULE — Displays information about the modules in the current image.
Synopsis
SHOW MODULE [module-name]Parameters
Specifies the name of a module to be included in the display. If you do not specify a name,
or if you specify the asterisk (*) wildcard character by itself, all modules
are listed. You can use a wildcard within a module name. Shareable image modules are selected
only if you specify /SHARE.
Qualifiers
- /RELATED
/NORELATED (default) (Applies to Ada programs.) Controls whether the debugger includes, in the
SHOW MODULEdisplay, any module that is related to a specified module through a with-clause or subunit relationship.The
SHOW MODULE/RELATEDcommand displays related modules as well as those specified. The display identifies the exact relationship. By default (/NORELATED), no related modules are selected for display (only the modules specified are selected).- /SHARE
/NOSHARE (default) Controls whether the debugger includes, in the
SHOW MODULEdisplay, any shareable images that have been linked with your program. By default (/NOSHARE) no shareable image modules are selected for display.The debugger creates dummy modules for each shareable image in your program. The names of these shareable "image modules" have the prefix SHARE$.The
SHOW MODULE/SHAREcommand identifies these shareable image modules, as well as the modules in the current image.Setting a shareable image module loads the universal symbols for that image into the run-time symbol table so that you can reference these symbols from the current image. However, you cannot reference other (local or global) symbols in that image from the current image. This feature overlaps the effect of the newer
SET IMAGEandSHOW IMAGEcommands.
Description
SHOW MODULE command displays the following information about one or
more modules selected for display: Name of the module
Programming language in which the module is coded, unless all modules are coded in the same language
Whether the module has been set with the
SET MODULEcommand. That is, whether the symbol records of the module have been loaded into the debugger's run-time symbol table (RST)Space (in bytes) required in the RST for symbol records in that module
Total number of modules selected in the display
Number of bytes allocated for the RST and other internal structures (the amount of heap space in use in the main debugger's process)
Note
The current image is either the main image (by default) or the image established as the
current image by a previous SET IMAGE command.
For information specific to Ada programs, type Help Language_Support Ada.
- (
SET,SHOW,CANCEL)IMAGE -
SET MODE [NO]DYNAMIC - (
SET)MODULE - (
SET,SHOW,CANCEL)SCOPE -
SHOW SYMBOL
Examples
DBG> SHOW MODULE module name symbols size TEST yes 432 SCREEN_IO no 280 total PASCAL modules: 2. bytes allocated: 2740. DBG>
In this example, the
SHOW MODULEcommand, without a parameter, displays information about all of the modules in the current image, which is the main image by default. This example shows the display format when all modules have the same source language. The symbols column shows that module TEST has been set, but module SCREEN_IO has not.DBG> SHOW MODULE FOO, MAIN, SUB* module name symbols language size FOO yes MACRO 432 MAIN no FORTRAN 280 SUB1 no FORTRAN 164 SUB2 no FORTRAN 204 total modules: 4. bytes allocated: 60720. DBG>
In this example, the
SHOW MODULEcommand displays information about the modules FOO and MAIN, and all modules having the prefix SUB. This example shows the display format when the modules do not have the same source language.DBG> SHOW MODULE/SHARE module name symbols language size FOO yes MACRO 432 MAIN no FORTRAN 280 … SHARE$DEBUG no Image 0 SHARE$LIBRTL no Image 0 SHARE$MTHRTL no Image 0 SHARE$SHARE1 no Image 0 SHARE$SHARE2 no Image 0 total modules: 17. bytes allocated: 162280. DBG> SET MODULE SHARE$SHARE2 DBG> SHOW SYMBOL * IN SHARE$SHARE2In this example, the
SHOW MODULE/SHAREcommand identifies all of the modules in the current image and all of the shareable images (the names of the shareable images are prefixed with SHARE$. TheSET MODULE SHARE$SHARE2command sets the shareable image module SHARE$SHARE2. TheSHOW SYMBOLcommand identifies any universal symbols defined in the shareable image SHARE2.
SHOW OUTPUT
SHOW OUTPUT — Identifies the current output options.
Synopsis
SHOW OUTPUT Description
The current output options are the options last established with the SET
OUTPUT command. By default, if you did not enter a SET OUTPUT
command, the output options are: NOLOG, NOSCREEN_LOG, TERMINAL, NOVERIFY.
-
SET LOG -
SET MODE SCREEN -
SET OUTPUT
Example
DBG> SHOW OUTPUT
noverify, terminal, screen_log,
logging to USER$:[JONES.WORK]DEBUG.LOG;9
DBG>Debugger commands read from debugger command procedures are not echoed on the terminal.
Debugger output is being displayed on the terminal.
The debugging session is being logged to the log file
USER$:[JONES.WORK]DEBUG.LOG;9.The screen contents are logged as they are updated in screen mode.
SHOW PROCESS
SHOW PROCESS — Displays information about processes that are currently under debugger control.
Synopsis
SHOW PROCESS [process-spec[, …]]Parameters
|
[%PROCESS_NAME] |
The process name, if that name does not contain spaces or lowercase characters. The process name can include the asterisk (*) wildcard character. |
|
[%PROCESS_NAME] " |
The process name, if that name contains spaces or lowercase characters. You can also use apostrophes (') instead of quotation marks ("). |
|
%PROCESS_PID |
The process identifier (PID, a hexadecimal number). |
|
[%PROCESS_NUMBER] |
The number assigned to a process when it comes under debugger control. A new number
is assigned sequentially, starting with 1, to each process. If a process is terminated
with the |
|
|
A symbol defined with the |
|
%NEXT_PROCESS |
The next process after the visible process in the debugger's circular process list. |
|
%PREVIOUS_PROCESS |
The process previous to the visible process in the debugger's circular process list. |
|
%VISIBLE_PROCESS |
The process whose stack, register set, and images are the current context for looking up symbols, register values, routine calls, breakpoints, and so on. |
You can also use the asterisk (*) wildcard character or the
/ALL qualifier to specify all processes. Do not specify a process with /ALL
or /DYNAMIC. If you do not specify a process or /ALL with
/BRIEF, /FULL, or /[NO]HOLD, the
visible process is selected.
Qualifiers
- /ALL
- /BRIEF
(Default) Displays only one line of information for each process selected for display.
- /DYNAMIC
Shows whether dynamic process setting is enabled or disabled. Dynamic process setting is enabled by default and is controlled with the
SET PROCESS/[NO]DYNAMICcommand.- /FULL
Displays maximum information for each process selected for display.
- /VISIBLE
Description
The SHOW PROCESS command displays information about specified processes
and any images running in those processes.
The SHOW PROCESS/FULL command also displays information about the
availability and use of the vector processor. This information is useful if you are debugging a
program that uses vector instructions.
A process can first appear in a SHOW PROCESS display as soon as it comes
under debugger control. A process can no longer appear in a SHOW PROCESS
display if it is terminated through an EXIT or QUIT
command.
/BRIEF), one line of information is displayed for each
process, including the following:The process number assigned by the debugger. A process number is assigned sequentially, starting with process 1, to each process that comes under debugger control. If a process is terminated by an
EXITorQUITcommand, its process number is not reused during that debugging session. The visible process is marked with an asterisk (*) in the leftmost column.The process name.
The current debugging state for that process.(See Table 17.1, ''Debugging States''.)
The location (symbolized, if possible) at which execution of the image is suspended in that process.
|
State |
Description |
|---|---|
|
Activated |
The image and its process have just been brought under debugger control. |
|
Break Break on branch Break on call Break on instruction Break on lines Break on modify of Break on return Exception break Exception break preceding |
A breakpoint was triggered. |
|
Interrupted |
Execution was interrupted in that process, either because execution was suspended in another process, or because the user interrupted program execution with the abort-key sequence (by default, Ctrl/C). |
|
Step Step on return |
A |
|
Terminated |
The image indicated has terminated execution but the process is still under debugger
control. Therefore, you can obtain information about the image and its process. You can
use the |
|
Trace Trace on branch Trace on call Trace on instruction Trace on lines Trace on modify of Trace on return Exception trace Exception trace preceding |
A tracepoint was triggered. |
|
Unhandled exception |
An unhandled exception was encountered. |
|
Watch of |
A watchpoint was triggered. |
The SHOW PROCESS/FULL command gives additional information about
processes (see the examples).
-
CONNECT -
Ctrl/C -
DEFINE/PROCESS_SET -
EXIT -
QUIT -
SET PROCESS
Examples
all> SHOW PROCESS Number Name State Current PC * 2 _WTA3: break SCREEN\%LINE 47 all>
By default, the
SHOW PROCESScommand displays one line of information about the visible process (which is identified with an asterisk (*) in the leftmost column). The process has the process name _WTA3:. It is the second process brought under debugger control (process number 2). It is on hold, and the image's execution is suspended at a breakpoint at line 47 of module SCREEN.all> SHOW PROCESS TEST_3 Number Name State Current PC 7 TEST_3 watch of TEST_3\ROUT4\COUNT TEST_3\%LINE 54 all>This
SHOW PROCESScommand displays one line of information about process TEST_3. The image is suspended at a watchpoint of variable COUNT.all> SHOW PROCESS/DYNAMIC Dynamic process setting is enabled all>
This command indicates that dynamic process setting is enabled.
SHOW RADIX
SHOW RADIX — Identifies the current radix for the entry and display of integer data or, if you
specify /OVERRIDE, the current override radix.
Synopsis
SHOW RADIX Description
The debugger can interpret and display integer data in any one of four radixes: binary,
decimal, hexadecimal, and octal. The current radix for the entry and display of integer data is
the radix last established with the SET RADIX command.
If you did not enter a SET RADIX command, the default radix for both
data entry and display is decimal for most languages. The exceptions are BLISS and MACRO, which
have a default radix of hexadecimal.
The current override radix for the display of all data is the override radix last
established with the SET RADIX/OVERRIDE command. If you did not enter a
SET RADIX/OVERRIDE command, the override radix is "none".
-
DEPOSIT -
EVALUATE -
EXAMINE - (
SET,CANCEL)RADIX
Examples
DBG> SHOW RADIX input radix: decimal output radix: decimal DBG>
This command identifies the input radix and output radix as decimal.
DBG> SET RADIX/OVERRIDE HEX DBG> SHOW RADIX/OVERRIDE output override radix: hexadecimal DBG>
In this example, the
SET RADIX/OVERRIDEcommand sets the override radix to hexadecimal and theSHOW RADIX/OVERRIDEcommand indicates the override radix. This means that commands such as EXAMINE display all data as hexadecimal integer data.
SHOW SCOPE
SHOW SCOPE — Identifies the current scope search list for symbol lookup.
Synopsis
SHOW SCOPE Description
The current scope search list designates one or more program locations(specified by path names or other special characters) to be used in the interpretation of symbols that are specified without pathname prefixes in debugger commands.
The current scope search list is the scope search list last established with the
SET SCOPE command. By default, if you did not enter a SET
SCOPE command, the current scope search list is 0, 1, 2, …,
n.
The default scope search list specifies that, for a symbol without a pathname prefix, a
symbol lookup such as EXAMINE X first looks for X in the routine that is
currently executing (scope 0); if no X is visible there, the debugger looks in the caller of
that routine (scope 1), and so on down the call stack; if X is not found in scope
n, the debugger searches the rest of the run-time symbol table (RST) - that
is, all set modules and the global symbol table (GST), if necessary.
If you used a decimal integer in the SET SCOPE command to represent a
routine in the call stack, the SHOW SCOPE command displays the name of the
routine represented by the integer, if possible.
- (
SET,CANCEL)SCOPE
Examples
DBG> CANCEL SCOPE DBG> SHOW SCOPE scope: * 0 [ = EIGHTQUEENS\TRYCOL\REMOVEQUEEN ], 1 [ = EIGHTQUEENS\TRYCOL ], 2 [ = EIGHTQUEENS\TRYCOL 1 ], 3 [ = EIGHTQUEENS\TRYCOL 2 ], 4 [ = EIGHTQUEENS\TRYCOL 3 ], 5 [ = EIGHTQUEENS\TRYCOL 4 ], 6 [ = EIGHTQUEENS ] DBG> SET SCOPE/CURRENT 2 DBG> SHOW SCOPE scope: 0 [ = EIGHTQUEENS\TRYCOL\REMOVEQUEEN ], 1 [ = EIGHTQUEENS\TRYCOL ], * 2 [ = EIGHTQUEENS\TRYCOL 1 ], 3 [ = EIGHTQUEENS\TRYCOL 2 ], 4 [ = EIGHTQUEENS\TRYCOL 3 ], 5 [ = EIGHTQUEENS\TRYCOL 4 ], 6 [ = EIGHTQUEENS ] DBG>The
CANCEL SCOPEcommand restores the default scope search list, which is displayed by the (first)SHOW SCOPEcommand. In this example, execution is suspended at routine REMOVE QUEEN, after several recursive calls to routine TRYCOL. The asterisk (*) indicates that the scope search list starts with scope 0, the scope of the routine in which execution is suspended.The
SET SCOPE/CURRENTcommand resets the start of the scope search list to scope 2. Scope 2 is the scope of the caller of the routine in which execution is suspended. The asterisk in the output of the (second)SHOW SCOPEcommand indicates that the scope search list now starts with scope 2.DBG> SET SCOPE 0, STACKS\R2, SCREEN_IO, \ DBG> SHOW SCOPE scope: 0, [= TEST ], STACKS\R2, SCREEN_IO, \ DBG>In this example, the
SET SCOPEcommand directs the debugger to look for symbols without pathname prefixes according to the following scope search list. First the debugger looks in the PC scope (denoted by 0, which is in module TEST). If the debugger cannot find a specified symbol in the PC scope, it then looks in routine R2 of module STACKS; if necessary, it then looks in module SCREEN_IO, and then finally in the global symbol table (denoted by the global scope (\)). TheSHOW SCOPEcommand identifies the current scope search list for symbol lookup. No asterisk is shown in theSHOW SCOPEdisplay unless the default scope search list is in effect or you have entered aSET SCOPE/CURRENTcommand.
SHOW SEARCH
SHOW SEARCH — Identifies the default qualifiers (/ALL or
/NEXT, /IDENTIFIER or /STRING)
currently in effect for the SEARCH command.
Synopsis
SHOW SEARCH Description
The default qualifiers for the SEARCH command are the default qualifiers
last established with the SET SEARCH command. If you did not enter a
SET SEARCH command, the default qualifiers are /NEXT and
/STRING.
-
SEARCH - (
SET,SHOW)LANGUAGE -
SET SEARCH
Example
DBG> SHOW SEARCH search settings: search for next occurrence, as a string DBG> SET SEARCH IDENT DBG> SHOW SEARCH search settings: search for next occurrence, as an identifier DBG> SET SEARCH ALL DBG> SHOW SEARCH search settings: search for all occurrences, as an identifier DBG>
In this example, the first SHOW SEARCH command displays the default
settings for the SET SEARCH command. By default, the debugger searches for
and displays the next occurrence of the string.
The second SHOW SEARCH command indicates that the debugger searches for
the next occurrence of the string, but displays the string only if it is not bounded on either
side by a character that can be part of an identifier in the current language.
The third SHOW SEARCH command indicates that the debugger searches for
all occurrences of the string, but displays the strings only if they are not bounded on either
side by a character that can be part of an identifier in the current language.
SHOW SELECT
SHOW SELECT — Identifies the displays currently selected for each of the display attributes: error,
input, instruction, output, program, prompt, scroll, and source.
Synopsis
SHOW SELECT Note
This command is not available in the VSI DECwindows Motif for OpenVMS user interface to the debugger.
Description
A display that has the error attribute displays debugger diagnostic messages.
A display that has the input attribute echoes your debugger input.
A display that has the instruction attribute displays the decoded instruction stream of the routine being debugged. The display is updated when you enter an
EXAMINE/INSTRUCTIONcommand.A display that has the output attribute displays any debugger output that is not directed to another display.
A display that has the program attribute displays program input and output. Currently only the PROMPT display can have the program attribute.
A display that has the prompt attribute is where the debugger prompts for input. Currently, only the PROMPT display can have the PROMPT attribute.
A display that has the scroll attribute is the default display for the
SCROLL,MOVE, andEXPANDcommands.A display that has the source attribute displays the source code of the module being debugged, if available. The display is updated when you enter a
TYPEorEXAMINE/SOURCEcommand.
-
SELECT -
SHOW DISPLAY
Example
DBG> SHOW SELECT
display selections:
scroll = SRC
input = none
output = OUT
error = PROMPT
source = SRC
instruction = none
program = PROMPT
prompt = PROMPT
DBG>The SHOW SELECT command identifies the displays currently selected for
each of the display attributes. These selections are the defaults for languages.
SHOW SOURCE
SHOW SOURCE — Identifies the source directory search lists and search methods currently in effect.
Synopsis
SHOW SOURCE Qualifiers
Description
The SET SOURCE/MODULE= command
establishes a source directory search list for a particular module. The module-nameSET
SOURCE command establishes a source directory search list for all modules not
explicitly mentioned in a SET SOURCE/MODULE=
command. When you have used those commands,
module-nameSHOW SOURCE identifies the source directory search list associated with each
search category.
If a source directory search list has not been established by using the SET
SOURCE or SET SOURCE/MODULE=
command, the module-nameSHOW SOURCE
command indicates that no directory search list is currently in effect. In this case, the
debugger expects each source file to be in the same directory that it was in at compile time
(the debugger also checks that the version number and the creation date and time of a source
file match the information in the debugger's symbol table).
The /EDIT qualifier is needed when the files used for the display of
source code are different from the files to be edited by using the EDIT
command. This is the case with Ada programs. For Ada programs, the SHOW
SOURCE command identifies the search list of files used for source display (the
copied source files in Ada program libraries); the SHOW SOURCE/EDIT command
identifies the search list for the source files you edit when using the EDIT
command.
For information specific to Ada programs, type Help Language_Support Ada.
- (
SET,CANCEL)SOURCE
Examples
DBG> SHOW SOURCE no directory search list in effect, match the latest source file version DBG> SET SOURCE [PROJA], [PROJB], DISK:[PETER.PROJC] DBG> SHOW SOURCE source directory search list for all modules, match the latest source file version: [PROJA] [PROJB] DISK:[PETER.PROJC] DBG>In this example, the
SET SOURCEcommand directs the debugger to search the directories[PROJA],[PROJB], andDISK:[PETER.PROJC]. By default, the debugger searches for the latest version of source files.DBG> SET SOURCE/MODULE=CTEST/EXACT [], DISK$2:[PROJD] DBG> SHOW SOURCE source directory search list for CTEST, match the exact source file version: [] DISK$2:[PROJD] source directory search list for all other modules, match the latest source file version: [PROJA] [PROJB] DISK:[PETER.PROJC] DBG>In this example, the
SET SOURCEcommand directs the debugger to search the current default directory ([]) and directoryDISK$2:[PROJD]for source files to use with the module CTEST. The/EXACTqualifier specifies that the search will locate the exact version of the CTEST source files found in the debug symbol table.
SHOW STACK
SHOW STACK — Displays information on the currently active routine calls.
Synopsis
SHOW STACK [integer]Parameters
Specifies the number of frames to display. If you omit the parameter, the debugger displays information about all call frames.
Qualifiers
- /START_LEVEL=
n - Directs
SHOW STACKto begin displaying information at call frame level n. For example, to see stack information for only frame 3, enter the following command:DBG> SHOW STACK/START=3 1
To see details for the 4th and 5th stack frames, enter the following command:DBG> SHOW STACK/START=4 2
Description
For each call frame, the SHOW STACK command displays information such as
stack pointers, condition handler, saved register values (Alpha), and local register allocation
(Integrity servers). Note that an argument passed through a register or an argument list may
contain the addresses of the actual argument. In such cases, use the EXAMINE
command to display the values of these
arguments. address-expression
A stack frame procedure, with a call frame on the memory stack,
A register frame procedure, with a call frame stored in the register set (Alpha) or on the register stack (Integrity servers), or
A null frame procedure, without a call frame
The SHOW STACK command provides information on all three procedures:
stack frame, register frame, and null frame. (See the examples below.)
-
SHOW CALLS
Examples
DBG> SHOW STACK
invocation block 0
FP: 000000007F907AD0
Detected what appears to be a NULL frame
NULL frames operate in the same invocation context as their caller
NULL Procedure Descriptor (0000000000010050):
Flags: 3089
KIND: PDSC$K_KIND_FP_STACK (09)
Signature Offset 0000
Entry Address: MAIN\FFFF
Procedure Descriptor (0000000000010000):
Flags: 3089
KIND: PDSC$K_KIND_FP_STACK (09)
FP is Base Register
Rsa Offset: 0008
Signature Offset 0000
Entry Address: MAIN
Ireg Mask: 20000004 <R2, FP>
RA Saved @ 000000007F907AD8: FFFFFFFF8255A1F8
R2 Saved @ 000000007F907AE0: 000000007FFBF880
FP Saved @ 000000007F907AE8: 000000007F907B30
Freg Mask: 00000000
Size: 00000020
invocation block 1
FP: 000000007F907B30
Procedure Descriptor (FFFFFFFF8255D910):
Flags: 3099
KIND: PDSC$K_KIND_FP_STACK (09)
Handler Valid
FP is Base Register
Rsa Offset: 0048
Signature Offset 0001
Entry Address: -2108317536
Ireg Mask: 20002084 <R2, R7, R13, FP>
RA Saved @ 000000007F907B78: 000000007FA28160
R2 Saved @ 000000007F907B80: 0000000000000000
R7 Saved @ 000000007F907B88: 000000007FF9C9E0
R13 Saved @ 000000007F907B90: 000000007FA00900
FP Saved @ 000000007F907B98: 000000007F907BB0
Freg Mask: 00000000
Size: 00000070
Condition Handler: -2108303104
DBG>In the above example, note that sections of routine prologues and epilogues appear to the debugger to be null frames. The portion of the prologue before the change in the frame pointer (FP) and the portion of the epilogue after restoration of the FP each look like a null frame, and are reported accordingly.
Integrity servers example:
- GP -- Global data segment Pointer (%R1)
- PC -- Program Counter (Instruction Pointer + instruction slot number)
- SP -- Stack Pointer (memory stack)
- BSP -- Backing Store Pointer (register stack)
- CFM -- Current Frame Marker
DBG> SHOW STACK
Invocation block 0 Invocation handle 000007FDC0000270
GP: 0000000000240000
PC: MAIN\FFFF
In prologue region
RETURN PC: MAIN\%LINE 15
SP: 000000007AD13B40
Is memory stack frame:
previous SP: 000000007AD13B40
BSP: 000007FDC0000270
Is register stack frame:
previous BSP: 000007FDC0000248
CFM: 0000000000000005
No locals Outs R32 : R36
Invocation block 1 Invocation handle 000007FDC0000248
GP: 0000000000240000
PC: MAIN\%LINE 15
RETURN PC: 0FFFFFFFF80C2A200
SP: 000000007AD13B40
Is memory stack frame:
previous SP: 000000007AD13B70
BSP: 000007FDC0000248
Is register stack frame:
previous BSP: 000007FDC0000180
CFM: 000000000000028A
Ins/Locals R32 : R36 Outs R37 : R41
Invocation block 2
Invocation handle 000007FDC0000180
GP: 0FFFFFFFF844DEC00
PC: 0FFFFFFFF80C2A200
RETURN PC: SHARE$DCL_CODE0+5AB9F
SP: 000000007AD13B70
Is memory stack frame:
previous SP: 000000007AD13BC0
BSP: 000007FDC0000180
Is register stack frame:
previous BSP: 000007FDC00000B8
Has handler:
function value: 0FFFFFFFF842DFBD0
CFM: 0000000000000C20
Ins/Locals R32 : R55 Outs R56 : R63
DBG>See VSI OpenVMS Calling Standard for more information.
SHOW STEP
SHOW STEP — Identifies the default qualifiers (/INTO,
/INSTRUCTION, /NOSILENT and so on)currently in effect for
the STEP command.
Synopsis
SHOW STEP Description
The default qualifiers for the STEP command are the default qualifiers
last established by the SET STEP command. If you did not enter a SET
STEP command, the default qualifiers are /LINE,
/OVER, /NOSILENT, and /SOURCE.
Enabling screen mode by pressing PF1-PF3 enters the SET STEP NOSOURCE
command as well as the SET MODE SCREEN command (to eliminate redundant source
display in output and DO displays). In that case, the default qualifiers are
/LINE, /OVER, /NOSILENT, and
/NOSOURCE.
-
STEP -
SET STEP
Example
DBG> SET STEP INTO, NOSYSTEM, NOSHARE, INSTRUCTION, NOSOURCE
DBG> SHOW STEP
step type: nosystem, noshare, nosource, nosilent, into routine calls,
by instruction
DBG>SHOW STEP command indicates that the debugger take
the following actions:Steps into called routines, but not those in system space or in shareable images
Steps by instruction
Does not display lines of source code while stepping
SHOW SYMBOL
SHOW SYMBOL — Displays information about the symbols in the debugger's run-time symbol table (RST)
for the current image.
Synopsis
SHOW SYMBOL [symbol-name[, …]]Note
The current image is either the main image (by default) or the image established as the
current image by a previous SET IMAGE command.
Parameters
Specifies a symbol to be identified. A valid symbol name is a single identifier or a label
name of the form %LABEL n, where n is an integer. Compound
names such as RECORD.FIELD or ARRAY[1, 2] are not valid. If you specify the asterisk
(*) wildcard character by itself, all symbols are listed. You can use the
wildcard within a symbol name.
Specifies the name of a module, routine, or lexical block, or a numeric scope. It has the
same syntax as the scope specification in a SET SCOPE command and can include
path-name qualification. All specified scopes must be in set modules in the current image.
The SHOW SYMBOL command displays only those symbols in the RST for the
current image that both match the specified name and are declared within the lexical entity
specified by the scope parameter. If you omit this parameter, all set
modules and the global symbol table (GST) for the current image are searched for symbols that
match the name specified by the symbol-name parameter.
Qualifiers
- /ADDRESS
Displays the address specification for each selected symbol. The address specification is the method of computing the symbol's address. It can merely be the symbol's memory address, but it can also involve indirection or an offset from a register value. Some symbols have address specifications too complicated to present in any understandable way. These address specifications are labeled "complex address specifications."
On Alpha, the command
SHOW SYMBOL/ADDRESSdisplays both the code address and procedure descriptor address of a specified routine, entry point, or Ada package.procedure-name- /DEFINED
Displays symbols you have defined with the
DEFINEcommand (symbol definitions that are in the DEFINE symbol table).- /DIRECT
Displays only those symbols that are declared directly in the
scopeparameter. Symbols declared in lexical entities nested within the scope specified by the scope parameters are not shown.- /FULL
Displays all information associated with the
/ADDRESS,/TYPE, and/USE_CLAUSEqualifiers.For C++ modules, if
symbol-nameis a class,SHOW SYMBOL/FULLalso displays information about the class.- /LOCAL
Displays symbols that are defined with the
DEFINE/LOCALcommand (symbol definitions that are in the DEFINE symbol table).- /TYPE
- /USE_CLAUSE
(Applies to Ada programs.) Identifies any Ada package that a specified block, subprogram, or package names in a use clause. If the symbol specified is a package, also identifies any block, subprogram, package, and so on, that names the specified symbol in a use clause.
Description
The SHOW SYMBOL command displays information that the debugger has about
a given symbol in the current image. This information might not be the same as what the compiler
had or even what you see in your source code. Nonetheless, it is useful for understanding why
the debugger might act as it does when handling symbols.
By default, the SHOW SYMBOL command lists all of the possible
declarations or definitions of a specified symbol that exist in the RST for the current image
(that is, in all set modules and in the GST for that image). Symbols are displayed with their
path names. A path name identifies the search scope (module, nested routines, blocks, and so
on)that the debugger must follow to reach a particular declaration of a symbol. When specifying
symbolic address expressions in debugger commands, use path names only if a symbol is defined
multiple times and the debugger cannot resolve the ambiguity.
The /DEFINED and /LOCAL qualifiers display
information about symbols defined with the DEFINE command (not the symbols
that are derived from your program). The other qualifiers display information about symbols
defined within your program.
For information specific to Ada programs, type Help Language_Support Ada.
-
DEFINE -
DELETE -
SET MODE [NO]LINE -
SET MODE [NO]SYMBOLIC -
SHOW DEFINE -
SYMBOLIZE
Examples
DBG> SHOW SYMBOL I data FORARRAY\I DBG>
This command shows that symbol I is defined in module FORARRAY and is a variable (data) rather than a routine.
DBG> SHOW SYMBOL/ADDRESS INTARRAY1 data FORARRAY\INTARRAY1 descriptor address: 0009DE8B DBG>This command shows that symbol INTARRAY1 is defined in module FORARRAY and has a memory address of 0009DE8B.
DBG> SHOW SYMBOL *PL*
This command lists all the symbols whose names contain the string "PL".
DBG> SHOW SYMBOL/TYPE COLOR data SCALARS\MAIN\COLOR enumeration type (primary, 3 elements), size: 4 bytesThis command shows that the variable COLOR is an enumeration type.
DBG> SHOW SYMBOL/TYPE/ADDRESS *
This command displays all information about all symbols.
DBG> SHOW SYMBOL * IN MOD3\COUNTER routine MOD3\COUNTER data MOD3\COUNTER\X data MOD3\COUNTER\Y DBG>This command lists all the symbols that are defined in the scope denoted by the path name
MOD3 \COUNTER.DBG> DEFINE/COMMAND SB=SET BREAK DBG> SHOW SYMBOL/DEFINED SB defined SB bound to: SET BREAK was defined /command DBG>In this example, the
DEFINE/COMMANDcommand defines SB as a symbol for theSET BREAKcommand. TheSHOW SYMBOL/DEFINEDcommand displays that definition.
SHOW TASK |THREAD
SHOW TASK |THREAD — Displays information about the tasks of a multithread program (also called a tasking
program).
Synopsis
SHOW TASK |THREAD [task-spec[, …]]Note
SHOW TASK and SHOW THREAD are synonymous commands.
They perform identically.
Parameters
- When the event facility is THREADS:
A task (thread) name as declared in the program, or a language expression that yields a task ID number.
A task ID number (for example, 2), as indicated in a
SHOW TASKdisplay.
- When the event facility is ADA:
A task (thread) name as declared in the program, or a language expression that yields a task value. You can use a path name.
A task ID (for example, 2), as indicated in a
SHOW THREADdisplay.
- One of the following task built-in symbols:
%ACTIVE_TASK
The task that runs when a
GO,STEP,CALL, orEXITcommand executes.%CALLER_TASK
(Applies only to Ada programs.) When an accept statement executes, the task that called the entry associated with the accept statement.
%NEXT_TASK
The task after the visible task in the debugger's task list. The ordering of tasks is arbitrary but consistent within a single run of a program.
%PREVIOUS_TASK
The task previous to the visible task in the debugger's task list.
%VISIBLE_TASK
The task whose call stack and register set are the current context for looking up symbols, register values, routine calls, breakpoints, and so on.
Do not use the asterisk (*) wildcard character. Instead, use the
/ALL qualifier. Do not specify a task with /ALL,
/STATISTICS, or /TIME_SLICE.
Qualifiers
- /ALL
Selects all existing tasks for display - namely, tasks that have been created and (in the case of Ada tasks) whose master has not yet terminated.
- /CALLS[=n]
Does a SHOW CALLS command for each task selected for display. This identifies the currently active routine calls (the call stack) for a task.
- /FULL
Displays additional information for each task selected for display. The additional information is provided if you use
/FULLby itself or with/CALLSor/STATISTICS.You can get help on POSIX Threads debugger commands by typing PTHREAD HELP.
See the Guide to POSIX Threads Library for more information about using the POSIX Threads debugger.
- /HOLD
/NOHOLD (default) - SHOW TERMINAL When the event facility is THREADS, use the following command:
PTHREAD tset -n thread-number
Selects either tasks that are on hold, or tasks that are not on hold for display.
If you do not specify a task,
/HOLDselects all tasks that are on hold. If you specify a task list,/HOLDselects the tasks in the task list that are on hold.If you do not specify a task,
/NOHOLDselects all tasks that are not on hold. If you specify a task list,/NOHOLDselects the tasks in the task list that are not on hold. - /IMAGE
Displays the image name for each active call on the call stack. Valid only with the
/CALLSqualifier.- /PRIORITY=(n[, …])
If you do not specify a task, selects all tasks having any of the specified priorities,
n, wherenis a decimal integer from 0 to 15. If you specify a task list, selects the tasks in the task list that have any of the priorities specified.- /STATE=(state[, …])
If you do not specify a task, selects all tasks that are in any of the specified states - RUNNING, READY, SUSPENDED, or TERMINATED. If you specify a task list, selects the tasks in the task list that are in any of the states specified.
Description
A task can first appear in a SHOW TASK display as soon as it is created.
A task can no longer appear in a SHOW TASK display if it is terminated or (in
the case of an Ada tasking program) if its master is terminated. By default, the SHOW
TASK command displays one line of information for each task selected.
When you specify the /IMAGE qualifier, the debugger first does a
SET IMAGE command for each image that has debug information (that is, it was
linked using the /DEBUG or /TRACEBACK qualifier).The
debugger then displays the image name for each active call on the calls stack. The output
display has been expanded and displays the image name in the first column.
The debugger suppresses the share$image_name module name, because that information is
provided by the /IMAGE qualifier.
The SET IMAGE command lasts only for the duration of the SHOW
TASK/CALLS/IMAGE command. The debugger restores the set image state when the
SHOW TASK/CALLS/IMAGE command is complete.
-
DEPOSIT/TASK -
EXAMINE/TASK - (
SET,SHOW)EVENT_FACILITY -
SET TASK |THREAD
Examples
DBG> SHOW EVENT_FACILITY event facility is ADA … DBG> SHOW TASK/ALL task id pri hold state substate task object * %TASK 1 7 RUN 122624 %TASK 2 7 HOLD SUSP Accept H4.MONITOR %TASK 3 6 READY Entry call H4.CHECK_IN DBG>In this example, the
SHOW EVENT_FACILITYcommand identifies ADA as the current event facility. TheSHOW TASK/ALLcommand provides basic information about all the tasks that were created through Ada services and currently exist. One line is devoted to each task. The active task is marked with an asterisk (*). In this example, it is also the active task (the task that is in the RUN state).DBG> SHOW TASK %ACTIVE_TASK, 3, MONITOR
This command selects the active task, 3, and task MONITOR for display.
DBG> SHOW TASK/PRIORITY=6
This command selects all tasks with priority 6 for display.
DBG> SHOW TASK/STATE=(RUN, SUSP)
This command selects all tasks that are either running or suspended for display.
DBG> SHOW TASK/STATE=SUSP/NOHOLD
This command selects all tasks that are both suspended and not on hold for display.
DBG> SHOW TASK/STATE=(RUN, SUSP)/PRIO=7 %VISIBLE_TASK, 3
This command selects for display those tasks among the visible task and %TASK3 that are in either the RUNNING or SUSPENDED state and have priority 7.
SHOW TERMINAL
SHOW TERMINAL — Identifies the current terminal screen height (page) and width being used to format
output.
Synopsis
SHOW TERMINAL Note
This command is not available in the VSI DECwindows Motif for OpenVMS user interface to the debugger.
Description
The current terminal screen height and width are the height and width last established by
the SET TERMINAL command. By default, if you did not enter a SET
TERMINAL command, the current height and width are the height and width known to the
terminal driver, as displayed by the DCL command SHOW TERMINAL (usually 24
lines and 80 columns for VT-series terminals).
-
SET TERMINAL -
SHOW DISPLAY -
SHOW WINDOW
Example
DBG> SHOW TERMINAL
terminal width: 80
page: 24
wrap: 80
DBG>This command displays the current terminal screen width and height (page) as 80 columns and 24 lines, and the message wrap setting at column 80.
SHOW TRACE
SHOW TRACE — Displays information about tracepoints.
Synopsis
SHOW TRACE Qualifiers
Description
The SHOW TRACE command displays information about tracepoints that are
currently set, including any options such as WHEN or DO clauses, /AFTER
counts, and so on, and whether the tracepoints are deactivated.
By default, SHOW TRACE displays information about both user-defined and
predefined tracepoints (if any). This is equivalent to entering the SHOW
TRACE/USER/PREDEFINED command. User-defined tracepoints are set with the SET
TRACE command. Predefined tracepoints are set automatically when you start the
debugger, and they depend on the type of program you are debugging.
If you established a tracepoint using SET TRACE/AFTER:
, the nSHOW TRACE command displays the
current value of the decimal integer n, that is, the originally
specified integer value minus 1 for each time the tracepoint location was reached. (The debugger
decrements n each time the tracepoint location is reached until the
value of n is 0, at which time the debugger takes trace action.)
On Alpha systems, the SHOW TRACE command does not display
individual instructions when the trace is on a particular class of instruction (as with
SET TRACE/CALL or SET TRACE/RETURN).
- (
ACTIVATE,DEACTIVATE,SET,CANCEL)TRACE
Examples
DBG> SHOW TRACE tracepoint at routine CALC \MULTtracepoint on calls: RET RSB BSBB JSB BSBW CALLG CALLS DBG>In this VAX example, the
SHOW TRACEcommand identifies all tracepoints that are currently set. This example indicates user-defined tracepoints that are triggered whenever execution reaches routine MULT in module CALC or one of the instructions RET, RSB, BSBB, JSB, BSBW, CALLG, or CALLS.all> SHOW TRACE/PREDEFINED predefined tracepoint on program activation DO (SET DISP/DYN/REM/SIZE:64/PROC SRC_ AT H1 SOURCE (EXAM/SOURCE .%SOURCE_SCOPE\%PC); SET DISP/DYN/REM/SIZE:64/PROC INST_ AT H1 INST (EXAM/INSTRUCTION .0\%PC)) predefined tracepoint on program termination all>This command identifies the predefined tracepoints that are currently set. The example shows the predefined tracepoints that are set automatically by the debugger for a multiprocess program. The tracepoint on program activation triggers whenever a new process comes under debugger control. The DO clause creates a process-specific source display named SRC_
nand a process-specific instruction display named INST_nwhenever a process activation tracepoint is triggered. The tracepoint on program termination triggers whenever a process does an image exit.
SHOW TYPE
SHOW TYPE — Identifies the current type for program locations that do not have a
compiler-generated type or, if you specify /OVERRIDE, the current override
type.
Synopsis
SHOW TYPE Description
The current type for program locations that do not have a compiler-generated type is the
type last established by the SET TYPE command. If you did not enter a
SET TYPE command, the type for those locations is longword integer.
The current override type for all program locations is the override type last established
by the SET TYPE/OVERRIDE command. If you did not enter a SET
TYPE/OVERRIDE command, the override type is "none".
-
CANCEL TYPE/OVERRIDE -
DEPOSIT -
EXAMINE - (
SET,SHOW,CANCEL)MODE - (
SET,SHOW,CANCEL)RADIX -
SET TYPE
Examples
DBG> SET TYPE QUADWORD DBG> SHOW TYPE type: quadword integer DBG>
In this example, you set the type to quadword for locations that do not have a compiler-generated type. The
SHOW TYPEcommand displays the current default type for those locations as quadword integer. This means that the debugger interprets and displays entities at those locations as quadword integers unless you specify otherwise (for example with a type qualifier on theEXAMINEcommand).DBG> SHOW TYPE/OVERRIDE type/override: none DBG>
This command indicates that no override type has been defined.
SHOW WATCH
SHOW WATCH — Displays information about watchpoints.
Synopsis
SHOW WATCH Description
The SHOW WATCH command displays information about watchpoints that are
currently set, including any options such as WHEN or DO clauses, /AFTER
counts, and so on, and whether the watchpoints are deactivated.
If you established a watchpoint using SET WATCH/AFTER:
, the nSHOW WATCH command displays the
current value of the decimal integer n, that is, the originally specified
integer value minus 1 for each time the watchpoint location was reached. (The debugger
decrements n each time the watchpoint location is reached until the value of
n is 0, at which time the debugger takes watch action.)
- (
ACTIVATE,CANCEL,DEACTIVATE,SET)WATCH
Example
DBG> SHOW WATCH watchpoint of MAIN\X watchpoint of SUB2\TABLE+20 DBG>
This command displays two watchpoints: one at the variable X (defined in module MAIN), and the other at the location SUB2 \TABLE+20 (20 bytes beyond the address denoted by the address expression TABLE).
SHOW WINDOW
SHOW WINDOW — Identifies the name and screen position of predefined and user-defined screen-mode
windows.
Synopsis
SHOW WINDOW [window-name[, …]]Parameters
Specifies the name of a screen window definition. If you do not specify a name, or if you
specify the asterisk (*) wildcard character by itself, all window definitions
are listed. You can use the wildcard within a window name. Do not specify a window definition
name with the /ALL qualifier.
Description
Note
This command is not available in the VSI DECwindows Motif for OpenVMS user interface to the debugger.
- (
SHOW,CANCEL)DISPLAY - (
SET,SHOW)TERMINAL - (
SET,CANCEL)WINDOW -
SHOW SELECT
Example
DBG> SHOW WINDOW LH*, RH* window LH1 at (1, 11, 1, 40) window LH12 at (1, 23, 1, 40) window LH2 at (13, 11, 1, 40) window RH1 at (1, 11, 42, 39) window RH12 at (1, 23, 42, 39) window RH2 at (13, 11, 42, 39) DBG>
This command displays the name and screen position of all screen window definitions whose names start with LH or RH.
SPAWN
SPAWN — Creates a subprocess, enabling you to execute DCL commands without terminating a
debugging session or losing your debugging context.
Synopsis
SPAWN [DCL-command]Note
This command is not available in the VSI DECwindows Motif for OpenVMS user interface to the debugger.
Parameters
Specifies a DCL command which is then executed in a subprocess. Control is returned to the debugging session when the DCL command terminates.
If you do not specify a DCL command, a subprocess is created and you can then enter DCL
commands. Either logging out of the spawned process or attaching to the parent process (with the
DCL command ATTACH) returns you to your debugging session.
If the DCL command contains a semicolon, you must enclose the command in quotation marks ("). Otherwise the semicolon is interpreted as a debugger command separator. To include a quotation mark in the string, enter two consecutive quotation marks ("").
Qualifiers
- /INPUT=file-spec
Specifies an input DCL command procedure containing one or more DCL commands to be executed by the spawned subprocess. The default file type is
.COM. If you specify a DCL command string with the SPAWN command and an input file with/INPUT, the command string is processed before the input file. After processing of the input file is complete, the subprocess is terminated. Do not use the asterisk (*) wildcard character in the file specification.- /OUTPUT=file-spec
Writes the output from the SPAWN operation to the specified file. The default file type is
.LOG. Do not use the asterisk (*) wildcard character in the file specification.- /WAIT (default)
/NOWAIT Controls whether the debugging session (the parent process) is suspended while the subprocess is running. The
/WAITqualifier (default) suspends the debugging session until the subprocess is terminated. You cannot enter debugger commands until control returns to the parent process.The
/NOWAITqualifier executes the subprocess in parallel with the debugging session. You can enter debugger commands while the subprocess is running. If you use/NOWAIT, you should specify a DCL command with theSPAWNcommand; the DCL command is then executed in the subprocess. A message indicates when the spawned subprocess completes.The kept debugger (that is, the debugger invoked with the DCL command
DEBUG/KEEP)shares I/O channels with the parent process when it is run by aSPAWN/NOWAITcommand. Therefore, in the VSI DECwindows Motif for OpenVMS user interface, you must press the Return key twice on the DEC term from which the debugger was run after the debugger version number has appeared in the command view.Optionally, you can execute the kept debugger in the following manner:$ DEFINE DBG$INPUT NL: $ SPAWN/NOWAIT RUN DEBUG/KEEP
Description
The SPAWN command acts exactly like the DCL command
SPAWN. You can edit files, compile programs, read mail, and so on without
ending your debugging session or losing your current debugging context.
In addition, you can spawn a DCL command SPAWN. DCL processes the second
SPAWN command, including any qualifier specified with that command.
-
ATTACH
Examples
DBG> SPAWN $
This example shows that the
SPAWNcommand, without a parameter, creates a subprocess at DCL level. You can now enter DCL commands. Log out to return to the debugger prompt.DBG> SPAWN/NOWAIT/INPUT=READ_NOTES/OUTPUT=0428NOTES
This command creates a subprocess that is executed in parallel with the debugging session. This subprocess executes the DCL command procedure
READ_NOTES.COM. The output from the spawned operation is written to the file0428NOTES.LOG.DBG> SPAWN/NOWAIT SPAWN/OUT=MYCOM.LOG @MYCOM
This command creates a subprocess that is executed in parallel with the debugging session. This subprocess creates another subprocess to execute the DCL command procedure
MYCOM.COM. The output from that operation is written to the fileMYCOM.LOG.
START HEAP_ANALYZER (Integrity servers only )
START HEAP_ANALYZER (Integrity servers only ) — Starts the Heap Analyzer to diagnose heap memory problems.
Synopsis
START HEAP_ANALYZER [integer]Note
The Heap Analyzer requires a DEC windows display.
Description
DBG>). Note
Heap memory operations that occur before you enter the START
HEAP_ANALYZER command are not recorded by the Heap Analyzer. To ensure all heap
memory operations are recorded, HP recommends that you start the Heap Analyzer early in the
life of the image being monitored.
See Chapter 12, "Using the Heap Analyzer " for full information about using the Heap Analyzer.
-
RUN -
RERUN
Example
DBG> START HEAP_ANALYZER
Invokes the Heap Analyzer for a graphical display of the ongoing memory usage by the program being debugged.
STEP
STEP — Executes the program up to the next line, instruction, or other specified location.
Synopsis
STEP [integer]Parameters
A decimal integer that specifies the number of step units (lines, instructions, and so on) to be executed. If you omit the parameter, the debugger executes one step unit.
Qualifiers
- /BRANCH
Executes the program to the next branch instruction.
STEP/BRANCHhas the same effect asSET BREAK/TEMPORARY/BRANCH;GO.- /CALL
Executes the program to the next call or return instruction.
STEP/CALLhas the same effect asSET BREAK/TEMPORARY/CALL;GO.- /EXCEPTION
Executes the program to the next exception, if any.
STEP/EXCEPTIONhas the same effect asSET BREAK/TEMPORARY/EXCEPTION;GO. If no exception occurs,STEP/EXCEPTIONhas the same effect asGO.- /INSTRUCTION
When you do not specify an opcode, executes the program to the next instruction.
STEP/INSTRUCTIONhas the same effect asSET BREAK/TEMPORARY/INSTRUCTION;GO.- /INTO
- If execution is currently suspended at a routine call,
STEP/INTOexecutes the program up to the beginning of that routine (steps into that routine). Otherwise,STEP/INTOhas the same effect asSTEPwithout a qualifier. The/INTOqualifier is the opposite of/OVER(the default behavior).Note
On Alpha, when execution is stopped at an exception break,
STEP/INTOdoes not transfer control to a user exception handler. Stop execution within the handler by setting a breakpoint in the handler.The
STEP/INTObehavior can be changed by also using the/[NO]JSB,/[NO]SHARE, and/[NO]SYSTEMqualifiers. - /LINE
Executes the program to the next line of source code. However, the debugger skips over any source lines that do not result in executable code when compiled (for example, comment lines).
STEP/LINEhas the same effect asSET BREAK/TEMPORARY/LINE;GO. This is the default behavior for all languages.- /OVER
- If execution is currently suspended at a routine call,
STEP/OVERexecutes the routine up to and including the routine's return instruction (steps over that routine). The/OVERqualifier is the default behavior and is the opposite of/INTO.Note
On Alpha, when execution is suspended at a source line that contains a loop with a routine call,
STEP/OVERsteps into the called routine. To step to the next program statement, set a temporary breakpoint at the statement and enter GO. - /RETURN
Executes the routine in which execution is currently suspended up to its return instruction (that is, up to the point just prior to transferring control back to the calling routine). This enables you to inspect the local environment (for example, obtain the values of local variables) before the return instruction deletes the routine's call frame from the call stack.
STEP/RETURNhas the same effect asSET BREAK/TEMPORARY/RETURN;GO.STEP/RETURNexecutes the program upnnlevels of the call stack.- /SEMANTIC_EVENT
(Alpha only) Executes the program to the next semantic event.
STEP/SEMANTIC_EVENTsimplifies debugging optimized code. (Seethe Description section.)- /SHARE (default)
/NOSHARE Qualifies a previous
SET STEP INTOcommand or a currentSTEP/INTOcommand.If execution is currently suspended at a call to a shareable image routine,
STEP/INTO/NOSHAREhas the same effect asSTEP/OVER. Otherwise,STEP/INTO/NOSHAREhas the same effect asSTEP/INTO.Use
STEP/INTO/SHAREto override a previousSET STEP NOSHAREcommand.STEP/INTO/SHAREenablesSTEP/INTOto step into shareable image routines, as well as into other kinds of routines.- /SILENT
/NOSILENT (default) Controls whether the "stepped to …" message and the source line for the current location are displayed after the
STEPhas completed. The/NOSILENTqualifier specifies that the message is displayed. The/SILENTqualifier specifies that the message and source line are not displayed. The/SILENTqualifier overrides/SOURCE.- /SOURCE (default)
/NOSOURCE Controls whether the source line for the current location is displayed after the
STEPhas completed. The/SOURCEqualifier specifies that the source line is displayed. The/NOSOURCEqualifier specifies that the source line is not displayed. The/SILENTqualifier overrides/SOURCE. See also theSET STEP [NO]SOURCEcommand.- /SYSTEM (default)
/NOSYSTEM Qualifies a previous
SET STEP INTOcommand or a currentSTEP/INTOcommand.If execution is currently suspended at a call to a system routine (in P1 space),
STEP/INTO/NOSYSTEMhas the same effect asSTEP/OVER. Otherwise,STEP/INTO/NOSYSTEMhas the same effect asSTEP/INTO.Use
STEP/INTO/SYSTEMto override a previousSET STEP NOSYSTEMcommand.STEP/INTO/SYSTEMenablesSTEP/INTOto step into system routines, as well as into other kinds of routines.
Description
The STEP command is one of the four debugger commands that can be used
to execute your program (the others are CALL, EXIT, and
GO).
STEP command depends on the following factors:The default
STEPmode previously established with aSET STEPcommand, if anyThe qualifier specified with the
STEPcommand, if anyThe number of step units specified as the parameter to the
STEPcommand, if any
SET STEP command was previously entered, the debugger takes the
following default actions when you enter a STEP command without specifying a
qualifier or parameter: Executes a line of source code (the default is
STEP/LINE).Reports that execution has completed by issuing a "stepped to …" message (the default is
STEP/NOSILENT).Displays the line of source code at which execution is suspended (the default is
STEP/SOURCE).Issues the prompt.
-
/BRANCH -
/CALL -
/EXCEPTION -
/INSTRUCTION -
/LINE -
/RETURN -
/SEMANTIC_EVENT(Alpha only)
-
/[NO]SILENT -
/[NO]SOURCE
-
/INTO -
/OVER -
/[NO]SHARE -
/[NO]SYSTEM
If you plan to enter several STEP commands with the same qualifiers, you
can first use the SET STEP command to establish new default qualifiers (for
example, SET STEP INTO, NOSYSTEM makes the
STEP command behave like STEP/INTO/NOSYSTEM). Then you do
not have to use those qualifiers with the STEP command. You can override the
current default qualifiers for the duration of a single STEP command by
specifying other qualifiers. Use the SHOW STEP command to identify the
current STEP defaults.
If an exception breakpoint is triggered (resulting from a SET
BREAK/EXCEPTION or a STEP/EXCEPTION command), execution is
suspended be fore any application-declared condition handler is started. If you then resume
execution with the STEP command, the debugger resignals the exception and the
program executes to the beginning of (steps into) the condition handler, if any.
On Alpha systems, if your program has been compiled with the /OPTIMIZE
qualifier, semantic stepping mode is available, with the STEP/SEMANTIC_EVENT
and SET STEP SEMANTIC_EVENT commands. When you are debugging optimized code,
the apparent source program location tends to bounce back and forth, with the same line
appearing repeatedly. In semantic stepping mode, the program executes to the next point in the
program where a significant effect (semantic event) occurs.
Data event - An assignment to a user variable
Control event - A control flow decision, with a conditional or unconditional transfer of control, other than a call
Call event - A call (to a routine that is not stepped over)or a return from a call
When two instructions are required to assign to a complex or X_floating value, only the first instruction is treated as a semantic event.
When there are multiple branches that are part of a single higher-level construct, such as a decision tree of branches that implement a case or select construct, then only the first is treated as a semantic event.
When a call is made to a routine that is a compiler-specific helper routine, such as a call to OTS$MOVE, which handles certain kinds of string or storage copy operations, the call is not considered a semantic event. Control will not stop at the call.
To step into such a routine, you must do either of the following:Set a breakpoint at the routine entry point.
Use a series of
STEP/INSTRUCTIONcommands to reach the call of interest and then useSTEP/INSTRUCTION/INTOto enter the called routine.
When there is more than one potential semantic event in a row with the same line number, only the first is treated as a semantic event.
The STEP/SEMANTIC_EVENT command causes a breakpoint to be set at
the next semantic event. Execution proceeds to that next event. Parts of any number of different
lines and statements may be executed along the way, without interfering with progress. When the
semantic event is reached (that is, when the instruction associated with that event is reached
but not yet executed), execution is suspended (similar to reaching the next line when
STEP/LINE is used).
For more information on debugging optimized programs, see Chapter 14, "Debugging Special Cases".
If you are debugging a multiprocess program, the STEP command is
executed in the context of the current process set. In addition, when debugging a multiprocess
program, the way in which execution continues in your process depends on whether you entered a
SET MODE [NO]INTERRUPT command or a SET MODE [NO]WAIT
command. By default (SET MODE NOINTERRUPT), when one process stops, the
debugger takes no action with regard to the other processes. Also by default (SET MODE
WAIT), the debugger waits until all process in the current process set have stopped
before prompting for a new command. See Chapter 15, "Debugging Multiprocess Programs" for more information.
-
CALL -
EXIT -
GO -
SET BREAK/EXCEPTION -
SET MODE [NO]INTERRUPT -
SET PROCESS - (
SET,SHOW)STEP
Examples
DBG> SHOW STEP step type: source, nosilent, by line, over routine calls DBG> STEP stepped to SQUARES$MAIN\%LINE 4 4: OPEN(UNIT=8, FILE='DATAFILE.DAT', STATUS='OLD') DBG>In this example, the
SHOW STEPcommand identifies the default qualifiers currently in effect for theSTEPcommand. In this case, theSTEPcommand, without any parameters or qualifiers, executes the next line of source code. After theSTEPcommand has completed, execution is suspended at the beginning of line 4.DBG> STEP 5 stepped to MAIN\%LINE 47 47: SWAP(X, Y); DBG>This command executes the next 5 lines of source code. After the
STEPcommand has completed, execution is suspended at the beginning of line 47.DBG> STEP/INTO stepped to routine SWAP 23: procedure SWAP (A, B: in out integer) is DBG> STEP stepped to MAIN\SWAP\%LINE 24 24: TEMP: integer := 0; DBG> STEP/RETURN stepped on return from MAIN\SWAP\%LINE 24 to MAIN\SWAP\%LINE 29 29: end SWAP; DBG>In this example, execution is paused at a call to routine SWAP, and the
STEP/INTOcommand executes the program up to the beginning of the called routine. TheSTEPcommand executes the next line of source code. TheSTEP/RETURNcommand executes the rest of routine SWAP up to its RET instruction (that is, up to the point just prior to transferring control back to the calling routine).DBG> SET STEP INSTRUCTION DBG> SHOW STEP step type: source, nosilent, by instruction, over routine calls DBG> STEP stepped to SUB1\%LINE 26: MOVL S^#4, B^-20(FP) 26: Z:integer:=4; DBG>In this example, the
SET STEP INSTRUCTIONcommand establishes/INSTRUCTIONas the defaultSTEPcommand qualifier. This is verified by theSHOW STEPcommand. TheSTEPcommand executes the next instruction. After theSTEPcommand has completed, execution is suspended at the first instruction (MOVL) of line 26 in module SUB1.
STOP
STOP — Interrupts all specified processes that are running.
Synopsis
STOP [[process-spec[, …]]Parameters
|
[%PROCESS_NAME] |
The process name, if that name does not contain spaces or lowercase characters. The process name can include the asterisk (*) wildcard character. |
|
[%PROCESS_NAME] " |
The process name, if that name contains spaces or lowercase characters. You can also use apostrophes (') instead of quotation marks ("). |
|
%PROCESS_PID |
The process identifier (PID, a hexadecimal number). |
|
[%PROCESS_NUMBER] |
The number assigned to a process when it comes under debugger control. A new number
is assigned sequentially, starting with 1, to each process. If a process is terminated
with the |
|
|
A symbol defined with the |
|
%NEXT_PROCESS |
The next process after the visible process in the debugger's circular process list. |
|
%PREVIOUS_PROCESS |
The process previous to the visible process in the debugger's circular process list. |
|
%VISIBLE_PROCESS |
The process whose stack, register set, and images are the current context for looking up symbols, register values, routine calls, breakpoints, and so on. |
You can also use the asterisk (*) wildcard character to specify all processes.
Description
The STOP command interrupts the specified processes. You can use the
STOP command in no wait mode to stop processes that are still running.
Examples
all>SHOW PROCESS
Number Name State Current PC
1 DBGK$$2727282C break SERVER\
main\%LINE 18834
2 USER1_2 running not available
* 3 USER1_3 running not available
all> CLIENTS> STOP
all> show process
Number Name State Current PC
1 DBGK$$2727282C break SERVER
main<literal>\main\%LINE 18834
2 USER1_2 interrupted 0FFFFFFFF800F7A20
* 3 USER1_3 interrupted 0FFFFFFFF800F7A20all>)This command sequence first shows all processes, then stops the processes in process set
clients. The last SHOW PROCESS command shows the new process states.
SYMBOLIZE
SYMBOLIZE — Converts a memory address to a symbolic representation, if possible.
Synopsis
SYMBOLIZE [address-expression[, …]]Parameters
Specifies an address expression to be symbolized. Do not use the asterisk (*) wildcard character.
Description
If the address is a static address, it is symbolized as the nearest preceding symbol name, plus an offset. If the address is also a code address and a line number can be found that covers the address, the line number is included in the symbolization.
If the address is a register address, the debugger displays all symbols in all set modules that are bound to that register. The full path name of each such symbol is displayed. The register name itself ("%R5", for example) is also displayed.
If the address is a call stack location in the call frame of a routine in a set module, the debugger searches for all symbols in that routine whose addresses are relative to the frame pointer (FP) or the stack pointer (SP). The closest preceding symbol name plus an offset is displayed as the symbolization of the address. A symbol whose address specification is too complex is ignored.
On Alpha, the commands SYMBOLIZE
and procedure-code-addressSYMBOLIZE
both display the path name
of the routine, entry point, or Ada package specified by these addresses.procedure-descriptor-address
If the debugger cannot symbolize the address, a message is displayed.
-
EVALUATE/ADDRESS -
SET MODE [NO]LINE -
SET MODE [NO]SYMBOLIC - (
SET,SHOW)MODULE -
SHOW SYMBOL
Examples
DBG> SYMBOLIZE %R5 address PROG\%R5: PROG\X DBG>This example shows that the local variable X in routine PROG is located in register R5.
DBG> SYMBOLIZE %HEX 27C9E3 address 0027C9E3: MOD5\X DBG>This command directs the debugger to treat the integer literal 27C9E3 as a hexadecimal value and convert that address to a symbolic representation, if possible. The address converts to the symbol X in module MOD5.
TYPE
TYPE — Displays lines of source code.
Synopsis
TYPE [[[module-name \]line-number[:line-number][, [module-name \]line-number[:line-number][,
…]]]]Parameters
Specifies the module that contains the source lines to be displayed. If you specify a module name along with the line numbers, use standard pathname notation: insert a backslash (\) between the module name and the line numbers.
If you do not specify a module name, the debugger uses the current scope(as established by
a previous SET SCOPE command, or the PC scope if you did not enter a
SET SCOPE command) to find source lines for display. If you specify a scope
search list with the SET SCOPE command, the debugger searches for source
lines only in the module associated with the first named scope.
Specifies a compiler-generated line number (a number used to label a source language statement or statements).
If you specify a single line number, the debugger displays the source code corresponding to that line number.
If you specify a list of line numbers, separating each with a comma, the debugger displays the source code corresponding to each of the line numbers.
If you specify a range of line numbers, separating the beginning and ending line numbers in the range with a colon (:), the debugger displays the source code corresponding to that range of line numbers.
You can display all the source lines of a module by specifying a range of line numbers starting from 1 and ending at a number equal to or greater than the largest line number in the module.
After displaying a single line of source code, you can display the next line of that module
by entering a TYPE command without a line number (that is, by entering
TYPE and then pressing the Return key). You can then display the next line
and successive lines by repeating this sequence, in effect, reading through your source program
one line at a time.
Description
The TYPE command displays the lines of source code that correspond to
the specified line numbers. The line numbers used by the debugger to identify lines of source
code are generated by the compiler. They appear in a compiler-generated listing and in a
screen-mode source display.
If you specify a module name with the TYPE command, the module must be
set. Use the SHOW MODULE command to determine whether a particular module is
set. Then use the SET MODULE command, if necessary.
In screen mode, the output of a TYPE command is directed at the current
source display, not at an output or DO display. The source display shows the lines specified and
any surrounding lines that fit in the display window.
-
EXAMINE/SOURCE -
SET(BREAK,TRACE,WATCH)/[NO]SOURCE -
SET MODE [NO]SCREEN - (
SET,SHOW,CANCEL)SCOPE -
SET STEP [NO]SOURCE -
STEP/[NO]SOURCE
Examples
DBG> TYPE 160 module COBOLTEST 160: START-IT-PARA. DBG> TYPE module COBOLTEST 161: MOVE SC1 TO ES0. DBG>
In this example, the first
TYPEcommand displays line 160, using the current scope to locate the module containing that line number. The secondTYPEcommand, entered without specifying a line number, displays the next line in that module.DBG> TYPE 160:163 module COBOLTEST 160: START-IT-PARA. 161: MOVE SC1 TO ES0. 162: DISPLAY ES0. 163: MOVE SC1 TO ES1. DBG>
This command displays lines 160 to 163, using the current scope to locate the module.
DBG> TYPE SCREEN_IO\7, 22:24
This command displays line 7 and lines 22 to 24 in module SCREEN_IO.
WAIT
WAIT — Causes the debugger to wait until the target processes have stopped before prompting
for the next command.
Synopsis
WAIT Description
When debugging multiprocess programs, the WAIT command causes the
debugger to complete executing all process specified by the previous command before displaying a
prompt to accept and execute another command.
-
STOP -
SET MODE [NO]INTERRUPT -
SET MODE [NO]WAIT
Example
all> 2, 3> GO;WAIT
processes 2, 3
break at CLIENT\main\%LINE 18814
18814: status = sys$qiow (EFN$C_ENF, mbxchan,
IO$_READVBLK|IO$M_WRITERCHECK, &myiosb)
process 1 break at SERVER\main\%LINE 18834
18834: if ((myiosb.iosb$w_status ==
SS$_NOREADER) && (pos_status != -1))
all>This command sequence executes the target processes (in this case, 2 and 3), and the debugger waits until both processes reach breakpoints before prompting for the next command.
WHILE
WHILE — Executes a sequence of commands while the language expression (Boolean expression)
you have specified evaluates as true.
Synopsis
WHILE [Boolean-expression DO (command[; …])]Parameters
Specifies a language expression that evaluates as a Boolean value (true or false) in the currently set language.
Specifies a debugger command. If you specify more than one command, separate the commands with semicolons (;). At each execution, the debugger checks the syntax of any expressions in the commands and then evaluates them.
Description
The WHILE command evaluates a Boolean expression in the current
language. If the value is true, the command list in the DO clause is executed. The command then
repeats the sequence, reevaluating the Boolean expression and executing the command list until
the expression is evaluated as false.
If the Boolean expression is false, the WHILE command terminates.
-
EXIT LOOP -
FOR -
REPEAT
Example
DBG> WHILE (X .EQ. 0) DO (STEP/SILENT)
This command directs the debugger to keep stepping through the program until X no longer equals 0 (Fortran example).
Appendix A. Predefined Key Functions
When you start the debugger, certain predefined functions (commands, sequences of commands,
and command terminators) are assigned to keys on the numeric keypad, to the right of the
main keyboard. By using these keys you can enter certain commands with fewer keystrokes than
if you were to type the mat the keyboard. For example, pressing the COMMA
key (, ) on the keypad is equivalent to typing GO and
then pressing the Return key. Terminals and workstations that have an LK201
keyboard have additional programmable keys compared to those on VT100 keyboards (for
example, "Help" or "Remove"), and some of these keys are also
assigned debugger functions.
To use function keys, keypad mode must be enabled (SET MODE
KEYPAD). Keypad mode is enabled when you start the debugger. If you do not
want keypad mode enabled, perhaps because the program being debugged uses the keypad for
itself, you can disable keypad mode by entering the SET MODE NOKEYPAD
command.
The keypad key functions that are predefined when you start the debugger are identified in
summary form in Figure A.1, ''Keypad Key Functions Predefined by the Debugger-Command Interface''. Table A.1, ''Key Definitions Specific to LK201 Keyboards'', Table A.2, ''Keys That Change the Key State'', Table A.3, ''Keys That Invoke Online Help to Display Keypad Diagrams'', and Table A.4, ''Debugger Key Definitions''
identify all key definitions in detail. Most keys are used for manipulating screen displays
in screen mode. To use screen mode commands, you must first enable screen mode by pressing
the PF3 key (SET MODE SCREEN). In screen mode, tore-create the default
layout of various windows, press the keypad key sequence BLUE-MINUS (PF4 followed by the
MINUS key (--)).
To use the keypad keys to enter numbers rather than debugger commands, enter the command
SET MODE NOKEYPAD.
A.1. DEFAULT, GOLD, BLUE Functions
You enter the Default function by pressing the given key.
You enter the GOLD function by pressing and releasing the PF1 key, which is also called the GOLD key, and then pressing the given key.
You enter the BLUE function by pressing and releasing the PF4 key, which is also called the BLUE key, and then pressing the given key.
In Figure A.1, ''Keypad Key Functions Predefined by the Debugger-Command Interface'', the DEFAULT, GOLD, and BLUE functions are listed within each
key's outline, from top to bottom, respectively. For example, pressing keypad key KP0
enters the command STEP (DEFAULT function); pressing PF1 and then KP0
enters the command STEP/INTO (GOLD function); pressing PF4 and then
KP0 enters the command STEP/OVER (BLUE function).
Press the PF4 key.
Press keypad key KP2.
Type:12 at the keyboard.
Press the Return key.
A.2. Key Definitions Specific to LK201 Keyboards
|
LK201 Key |
Command Sequence Invoked |
Equivalent Keypad Key |
|---|---|---|
|
F17 |
SET KEY/STATE=DEFAULT |
None |
|
F18 |
SET KEY/STATE=MOVE |
None |
|
F19 |
SET KEY/STATE=EXPAND |
None |
|
F20 |
SET KEY/STATE=CONTRACT |
None |
|
Help |
HELP KEYPAD SUMMARY |
None |
|
Next Screen |
SCROLL/DOWN |
KP2 |
|
Prev Screen |
SCROLL/UP |
KP8 |
|
Remove |
DISPLAY/REMOVE %CURSCROLL |
None |
|
Select |
SELECT/SCROLL %NEXTSCROLL |
KP3 |
A.3. Keys That Scroll, Move, Expand, Contract Displays
By default, keypad keys KP2, KP4, KP6, and KP8 scroll the current scrolling display. Each key controls a direction (down, left, right, and up, respectively). By pressing F18, F19, or F20, you can place the key pad in the MOVE, EXPAND, or CONTRACT states. When the keypad is in the MOVE state, you can use KP2, KP4, KP6, and KP8 to move the current scrolling display down, left, and so on. Similarly, in the EXPAND and CONTRACT states, you can use the four keys to expand or contract the current scrolling display. (See Figure A.1, ''Keypad Key Functions Predefined by the Debugger-Command Interface'' and Table A.2, ''Keys That Change the Key State''. Alternative key definitions for VT100 keyboards are described later in this section.)
Press KP3 repeatedly, as needed, to select the current scrolling display from the display list.
Press F17, F18, F19, or F20 to put the keypad in the DEFAULT (scroll), MOVE, EXPAND, or CONTRACT state, respectively.
Press KP2, KP4, KP6, and KP8 to do the desired function. Use the PF1 (GOLD) and PF4 (BLUE) keys to control the amount of scrolling or movement.
|
Key |
Description |
|---|---|
|
PF1 |
Invokes the GOLD function of the next key you press. |
|
PF4 |
Invokes the BLUE function of the next key you press. |
|
F17 |
Puts the keypad in the DEFAULT state, enabling the scroll-display functions of KP2, KP4, KP6, and KP8. The keypad is in the DEFAULT state when you invoke the debugger. |
|
F18 |
Puts the keypad in the MOVE state, enabling the move-display functions of KP2, KP4, KP6, and KP8. |
|
F19 |
Puts the keypad in the EXPAND state, enabling the expand-display functions of KP2, KP4, KP6, and KP8. |
|
F20 |
Puts the keypad in the CONTRACT state, enabling the contract-display functions of KP2, KP4, KP6, and KP8. |
DEFINE/KEY/IF_STATE=(GOLD, MOVE_GOLD, EXPAND_GOLD, CONTRACT_GOLD)- /TERMINATE KP9 "SET KEY/STATE=DEFAULT/NOLOG" DEFINE/KEY/IF_STATE=(BLUE)- /TERMINATE KP9 "SET KEY/STATE=MOVE/NOLOG" DEFINE/KEY/IF_STATE=(MOVE_BLUE)- /TERMINATE KP9 "SET KEY/STATE=EXPAND/NOLOG" DEFINE/KEY/IF_STATE=(EXPAND_BLUE)- /TERMINATE KP9 "SET KEY/STATE=CONTRACT/NOLOG" DEFINE/KEY/IF_STATE=(CONTRACT_BLUE)- /TERMINATE KP9 "SET KEY/STATE=DEFAULT/NOLOG"
A.4. Online Keypad Key Diagrams
SHOW KEY command to identify key definitions.|
Key or Key Sequence |
Command Sequence Invoked |
Description |
|---|---|---|
|
Help |
HELP KEYPAD SUMMARY |
Shows a diagram of the keypad keys and summarizes each key's function |
|
PF2 |
HELP KEYPAD DEFAULT |
Shows a diagram of the keypad keys and their DEFAULT functions |
|
PF1-PF2 |
HELP KEYPAD GOLD |
Shows a diagram of the keypad keys and their GOLD functions |
|
PF4-PF2 |
HELP KEYPAD BLUE |
Shows a diagram of the keypad keys and their BLUE functions |
|
F18-PF2 |
HELP KEYPAD MOVE |
Shows a diagram of the keypad keys and their MOVE DEFAULT functions |
|
F18-PF1-PF2 |
HELP KEYPAD MOVE_GOLD |
Shows a diagram of the keypad keys and their MOVE GOLD functions |
|
F18-PF4-PF2 |
HELP KEYPAD MOVE_BLUE |
Shows a diagram of the keypad keys and their MOVE BLUE functions |
|
F19-PF2 |
HELP KEYPAD EXPAND |
Shows a diagram of the keypad keys and their EXPAND DEFAULT functions |
|
F19-PF1-PF2 |
HELP KEYPAD EXPAND_GOLD |
Shows a diagram of the keypad keys and their EXPAND GOLD functions |
|
F19-PF4-PF2 |
HELP KEYPAD EXPAND_BLUE |
Shows a diagram of the keypad keys and their EXPAND BLUE functions |
|
F20-PF2 |
HELP KEYPAD CONTRACT |
Shows a diagram of the keypad keys and their CONTRACT DEFAULT functions |
|
F20-PF1-PF2 |
HELP KEYPAD CONTRACT_GOLD |
Shows a diagram of the keypad keys and their CONTRACT GOLD functions |
|
F20-PF4-PF2 |
HELP KEYPAD CONTRACT_BLUE |
Shows a diagram of the keypad keys and their CONTRACT BLUE functions |
A.5. Debugger Key Definitions
|
Key |
State |
Command Invoked or Function |
|---|---|---|
|
KP0 |
DEFAULT |
|
|
GOLD |
| |
|
BLUE |
| |
|
KP1 |
DEFAULT |
Examines the logical successor of the current entity, if one is defined (the next location). |
|
GOLD |
Enables you to examine the logical predecessor of the current entity, if one is defined (the previous location). | |
|
BLUE |
Displays three sets of predefined process-specific source and
instruction displays, SRC_ | |
|
KP2 |
DEFAULT |
|
|
GOLD |
| |
|
BLUE |
(not terminated). To terminate the command, supply the number
of lines to be scrolled (: | |
|
MOVE |
| |
|
MOVE_GOLD |
| |
|
MOVE_BLUE |
| |
|
EXPAND |
| |
|
EXPAND_GOLD |
| |
|
EXPAND_BLUE |
| |
|
CONTRACT |
| |
|
CONTRACT_GOLD |
| |
|
CONTRACT_BLUE |
| |
|
KP3 |
DEFAULT |
|
|
GOLD |
| |
|
BLUE |
Displays three predefined process-specific source displays,
SRC_ | |
|
KP4 |
DEFAULT |
|
|
GOLD |
| |
|
BLUE |
| |
|
MOVE |
| |
|
MOVE_GOLD |
| |
|
MOVE_BLUE |
| |
|
EXPAND |
| |
|
EXPAND_GOLD |
| |
|
EXPAND_BLUE |
| |
|
CONTRACT |
| |
|
CONTRACT_GOLD |
| |
|
CONTRACT_BLUE |
| |
|
KP5 |
DEFAULT |
|
|
GOLD |
| |
|
BLUE |
| |
|
KP6 |
DEFAULT |
|
|
GOLD |
| |
|
BLUE |
| |
|
MOVE |
| |
|
MOVE_GOLD |
| |
|
MOVE_BLUE |
| |
|
EXPAND |
| |
|
EXPAND_GOLD |
| |
|
EXPAND_BLUE |
| |
|
CONTRACT |
| |
|
CONTRACT_GOLD |
| |
|
CONTRACT_BLUE |
| |
|
KP7 |
DEFAULT |
|
|
GOLD |
| |
|
BLUE |
Displays two sets of predefined process-specific source and
instruction displays, SRC_ | |
|
KP8 |
DEFAULT |
|
|
GOLD |
| |
|
BLUE |
| |
|
MOVE |
| |
|
MOVE_GOLD |
| |
|
MOVE_BLUE |
| |
|
EXPAND |
| |
|
EXPAND_GOLD |
| |
|
EXPAND_BLUE |
| |
|
CONTRACT |
| |
|
CONTRACT_GOLD |
| |
|
CONTRACT_BLUE |
| |
|
KP9 |
DEFAULT |
|
|
GOLD |
| |
|
BLUE |
Displays two predefined process-specific source displays,
SRC_ | |
|
PF1 |
Invokes the GOLD function of the next key you press. | |
|
PF2 |
Shows a diagram of the keypad keys and their DEFAULT functions | |
|
PF3 |
DEFAULT |
|
|
GOLD |
| |
|
BLUE |
| |
|
PF4 |
Invokes the BLUE function of the next key you press. | |
|
COMMA |
DEFAULT |
|
|
GOLD |
| |
|
BLUE |
| |
|
MINUS |
DEFAULT |
|
|
GOLD |
Undefined. | |
|
BLUE |
| |
|
Enter |
Enables you to enter (terminate) a command. Same effect as Return. | |
|
PERIOD |
All states |
Cancels the effect of pressing state keys that do not lock the state, such as GOLD and BLUE. Does not affect the operation of state keys that lock the state, such as MOVE, EXPAND, and CONTRACT. |
|
Next Screen (E6) |
DEFAULT |
|
|
Prev Screen (E5) |
DEFAULT |
|
|
Remove (E3) |
DEFAULT |
|
|
Select (E4) |
DEFAULT |
SELECT/SCROLL %NEXTSCROLL. Selects as the current scrolling display the next display in the display list after the current scrolling display. |
|
F17 |
Puts the keypad in the DEFAULT state, enabling the scroll-display functions of KP2, KP4, KP6, and KP8. The keypad is in the DEFAULT state when you invoke the debugger. | |
|
F18 |
Puts the keypad in the MOVE state, enabling the move-display functions of KP2, KP4, KP6, and KP8. | |
|
F19 |
Puts the keypad in the EXPAND state, enabling the expand-display functions of KP2, KP4, KP6, and KP8. | |
|
F20 |
Puts the keypad in the CONTRACT state, enabling the contract-display functions of KP2, KP4, KP6, and KP8. | |
|
Ctrl/W |
| |
|
Ctrl/Z |
|
Appendix B. Using the OpenVMS Debugger
A debugger helps you find run-time errors by letting you observe and interactively manipulate program execution step by step, until you discover where the program functions incorrectly. The OpenVMS Debugger is symbolic, meaning that you can refer to symbolic names for the memory addresses allocated to variables, routines, labels, and so on. You need not use virtual addresses.
The language of the source program you are currently debugging determines the format you use to enter and display data. The language also determines the format used for features, such as comment characters, operators, and operator precedence, which have language-specific settings. However, if you have modules written in another language, you can switch from one language to another during your debugging session.
B.1. Debugging C++ Programs
The OpenVMS Debugger supports the language constructs of C++ and other debugger-supported programming languages. This section describes features specific to debugging C++ programs. For more information on the OpenVMS Debugger, see the VSI OpenVMS Debugger Manual.
B.1.1. Compiling and Linking for Debugging
To use the debugger, compile and link your program with the /DEBUG (Alpha and IA-64 only) qualifier on both commands. On the compiler command, the /DEBUG qualifier writes into the object module the debug symbol records declared in the program source file. These records make the names of variables and other declared symbols accessible to debugger commands. If your program has several compilation units, make sure you use the /DEBUG qualifier to compile each unit you want to debug.
On OpenVMS IA-64 systems, specifying /DEBUG gives you /DEBUG=(TRACEBACK,SYMBOLS=BRIEF), which omits debug information for unused labels and unused types, even when /NOOPTIMIZE is specified. This feature results in much smaller object files. To include unused labels and types, specify the SYMBOLS=NOBRIEF keyword explicitly (/DEBUG=(SYMBOLS=NOBRIEF)).
On OpenVMS Alpha systems, specifying /DEBUG gives you /DEBUG=(TRACEBACK,SYMBOLS), which effectively gives you /DEBUG=(TRACEBACK,SYMBOLS=NOBRIEF).
Additionally, use the /NOOPTIMIZE qualifier with the compiler command. Optimized code can reduce program size and increase execution speed, but can also create inconsistencies in memory content that adversely affects debugging. Use the default /OPTIMIZE qualifier only with programs that have been completely debugged.
On the linker command, the /DEBUG qualifier incorporates into the executable image all the symbol information contained in the object modules. Using the /DEBUG qualifier on the linker command also starts the debugger at run time.
B.1.2. Debugger Support
Stepping by line will generally seem to bounce forward and back, due to the effects of code scheduling. The general drift will definitely be forward, but initial experience indicates that the effect will be very close to stepping by instruction.
Variables that are "split" (so that they are allocated in more than one location during different parts of their lifetimes) may not be described correctly.
Although not handled quite like normal split variables, formal parameters that are passed in registers share many of the same problems as split variables. Even with the /NOOPTIMIZE qualifier, such a parameter often will be copied immediately to a "permanent home" (either on the stack or in some other register) during the routine prolog. The debugger symbol table description of such parameters encodes this permanent home location and not the physical register in which the parameter is passed. The end-of-prolog location is recorded in the debugger symbol tables and will be used as the preferred breakpoint location when a breakpoint is set in the context of an appropriately set module (so that symbol table information is available to the debugger).
Debugger Command-Line Options (Alpha and IA-64 only)
The compiler provides a set of debugger options that you can specify to the /DEBUG qualifier on the compiler command line. These options determine the kind of information that the compiler places in the object module for use by the OpenVMS Debugger. These debugger options include using traceback records and using the debugger symbol table.
B.1.3. Starting and Ending a Debugging Session
When you enter the DCL run command and specify your executable image file, the
OpenVMS Debugger takes control. The debugger displays a message indicating its
version, the programming language the source code is written in, and the name of the
image file. When the DBG> prompt appears, you can enter debugger commands.
To execute the program, enter the debugger go command. Execution proceeds until
the debugger pauses or stops the program (for example, to prompt you for user input,
to signal an error, or to inform you that your program completed successfully).
To interrupt the debugging session in progress, press Ctrl/C. The DBG> prompt displays and you can again enter debugger commands.
To end a debugging session, enter the debugger exit command or press
Ctrl/Z.
B.1.4. Features Basic to Debugging C++ Programs
This section describes features essential for debugging C++ programs.
B.1.4.1. Determining Language Mode
The OpenVMS Debugger is in C++ language mode when invoked against a
main program or routine written in C++. If you are debugging an application with
modules written in some language other than C++, you may switch back to C++
language mode by using the command set language c_plus_plus.
B.1.4.2. Built-In Operators
|
Symbol |
Function |
Kind |
|---|---|---|
|
* |
Indirection |
Prefix |
|
& |
Address of |
Prefix |
|
|
size of |
Prefix |
|
– |
Unary minus (negation) |
Prefix |
|
+ |
Addition |
Infix |
|
– |
Subtraction |
Infix |
|
* |
Multiplication |
Infix |
|
/ |
Division |
Infix |
|
% |
Remainder |
Infix |
|
<< |
Left shift |
Infix |
|
>> |
Right shift |
Infix |
|
== |
Equal to |
Infix |
|
!= |
Not equal to |
Infix |
|
> |
Greater than |
Infix |
|
>= |
Greater than or equal to |
Infix |
|
< |
Less than |
Infix |
|
<= |
Less than or equal to |
Infix |
|
~ (tilde) |
Bit-wise NOT |
Prefix |
|
& |
Bit-wise AND |
Infix |
|
| |
Bit-wise OR |
Infix |
|
^ |
Bit-wise exclusive OR |
Infix |
|
! |
Logical NOT |
Prefix |
|
&& |
Logical AND |
Infix |
|
|| |
Logical OR |
Infix |
Because the exclamation point (!) is an operator, it cannot be used in C++ programs as a comment delimiter. However, to permit debugger log files to be used as debugger input, the debugger still recognizes the exclamation point as a comment delimiter if it is the first nonspace character on a line. In C++ language mode, the debugger accepts a forward slash immediately followed by an asterisk (/*) as the comment delimiter. The comment continues to the end of the current line. A matching asterisk immediately followed by a slash (*/) is neither needed nor recognized.
The debugger accepts the asterisk (*) prefix as an indirection operator in both C++ language expressions and debugger address expressions. In address expressions, the asterisk prefix is synonymous to the period (.) prefix or the at sign (@) prefix when the language is set to C++.
To prevent unintended modifications to the program being debugged, the debugger does not
support any of the assignment operators in C++ (or any other language). Thus,
such operators as =, +=, –, ++, and −− are not recognized. To alter the contents of a memory
location, you must do so with an explicit deposit command.
B.1.4.3. Constructs in Language and Address Expressions
B.1.4.4. Data Types
|
C++ Data Type |
OpenVMS Data Type Name |
|---|---|
|
|
Longword Integer |
|
|
Longword Integer (Alpha and IA-64), Quadword Integer (x86-64) |
|
|
Longword Unsigned |
|
|
Longword Unsigned, Quadword Integer (x86-64) |
|
|
Quadword Integer |
|
|
Quadword Unsigned |
|
|
Word Integer |
|
|
Word Unsigned |
|
|
Byte Integer |
|
|
Byte Unsigned |
|
|
F_Floating (Alpha default), S_Floating (IA-64 and x86-64 default) |
|
|
G_Floating (Alpha default), T_Floating (IA-64 default), D_Floating |
|
|
None |
|
|
None |
|
|
None |
|
|
None |
|
Pointer type |
None |
|
Array type |
None |
Uppercase letters in parentheses represent standard data type mnemonics in the OpenVMS common language environment. For more information, see OpenVMS Programming Interfaces: Calling a System Routine.
|
C++ Data Type |
OpenVMS Data Type Name |
|---|---|
|
|
Word Integer |
|
|
Word Unsigned |
|
|
Longword Integer |
|
|
Longword Unsigned |
|
|
Quadword Integer |
|
|
Quadword Unsigned |
B.2. Using the OpenVMS Debugger with C++ Data
This section describes how to use the OpenVMS Debugger with C++ data.
B.2.1. Nonstatic Data Members
This section describes how to refer to data members that are not declared static.
B.2.1.1. Noninherited Data Members
B.2.1.2. Inherited Data Members
The debugger support distinguishes nonstatic data members inherited from various base classes by prefixing their names with a sequence of significant base class names on the inheritance path to the member, and then the class that the member is declared in. A base class on a path from an object to a member is significant if the base class in question is derived from using multiple inheritance. Thus, a base class is significant if it is mentioned in a base list containing more than one base specifier.
CLASS::member
Specify the sequence of significant base classes in the order from the object's most derived significant class, to the significant base class closest to the object.
B.2.2. Reference Objects and Reference Members
Because the debugger understands the concept of reference objects and reference members to objects, you can examine a reference object or reference member directly, without dereferencing it as you would for a pointer. To access the values of objects declared with a reference, use the name of the object.
class C {
public:
int &ref_mem;
C(int &arg) : ref_mem(arg) {}
};
int main()
{
int obj = 5;
int &ref_obj = obj;
C c(obj);
obj = 23;
}
...break at R8_2_3\main\%LINE 13
13: }
DBG> exam obj, ref_obj
R8_2_3\main\obj: 23
R8_2_3\main\ref_obj: 23
DBG> exam c
R8_2_3\main\c: class C
ref_mem: 23
DBG> exam c.ref_mem
R8_2_3\main\c.ref_mem: 23B.2.3. Pointers to Members
For Alpha systems compiled with /MODEL=ANSI and for IA-64 and x86-64 systems, a pointer to member is an offset into a structure.
struct A {
int mem0;
};
struct B {
int mem1;
int mem2;
};
struct C : public A, public B {
int mem3;
int mem4;
};
/* pointer to member initalized with pointer to member
* address of the same class.
*/
int C::*pmc = &C::mem2;
/* pointer to member initialized with pointer to member
* address of one of the * base classses. An implicit
* conversion occurs.
*/
int C::*pmbc = &B::mem2;
extern "C" int printf (const char *,...);
main()
{
C *cinst = new C;
cinst->*pmc = 7;
printf("cinst pointer to member value is %d\n",cinst->mem2);
}DBG> set radix hex
DBG> exam *cinst
*EX8_2_4\main\cinst: struct C
inherit A
mem0: 00000000
inherit B
mem1: 00000000
mem2: 0000000A
mem3: 00000000
mem4: 00000000
DBG> set radix hex
DBG> exa pmc
EX8_2_4\pmc: 00000008
DBG> exam pmbc
EX8_2_4\pmbc: 00000008
DBG> exam cinst
EX8_2_4\main\cinst: 0000000080000090
DBG> exam 080000090+8
0000000080000098: 00000007For the preceding sample program, the above debug sequence examines the pointer to member
(pmc or pmbc) to obtain an offset into the structure,
and adds this value to the address of the object (*cinst). In our
example, this is *cinst + the value of pmc.
For Alpha systems compiled with the default object model (/MODEL=ARM), a pointer to member involves executing a piece of function-like code, called a thunk.
The argument to this function is the address of the base class containing the member. This address is obtained by adding the offset of the start of the base class to the address of the object. This offset adjustment is needed when the pointer to member refers to a multiply inherited base class.
DBG> set radix hex
DBG> sho sym /full C
type C
struct (C, 2 components), size: 20 bytes
inherits: A, size: 4 bytes, offset: 0000000000000000 bytes
B, size: 8 bytes, offset: 0000000000000004 bytes
contains the following members:
mem3 : longword integer, size: 4 bytes, offset: 000000000000000C bytes
mem4 : longword integer, size: 4 bytes, offset: 0000000000000010 bytes
DBG> exam pmc
EX8_2_4\pmc: 000100D8
DBG> exam cinst
EX8_2_4\main\cinst: 006706F0
DBG> call 000100D8(006706F0+4)
value returned is 006706F8
DBG> exam 006706F8
00000000006706F8: 00000007This debug sequence first obtains the offset to the start of the nested class containing the
member pointed to with show sym /full. In this case, the offset is
4.
It then examines the pointer to member (pmc) and determines
the address of the object (cinst). In our case,
pmc = 100D8 (thunk) and cinst = 6706F0.
Then it calls the thunk, passing the address of the object plus the offset: CALL 000100D8(006706F0+4). This call to the thunk returns the address of the member.
Finally, it examines the member (006706F8).
B.3. Using the OpenVMS Debugger with C++ Functions
This section describes how to reference the various kinds of functions and function arguments.
B.3.1. Referring to Overloaded Functions
You can use the debug SHOW SYMBOL command to see all the overloaded names for a given function. You can set breakpoints on an overloaded function by specifying either the object name and function name followed by the argument types, or by specifying the class name and function name followed by the arguments.
extern "C" {int printf(const char *,...);}
class base{
public:
base(){};
base(int){};
~base(){};
void base_f1() {printf("called base_f1()\n");}
void base_f2() {printf("called base_f2()\n");}
void base_f2(int) {printf("called base_f2(int)\n");}
void base_f2(char c) {printf("call base_f2(char)\n");}
};
int main()
{
base b;
base b1(1);
b.base_f1();
b.base_f2(10);
b.base_f2();
b.base_f2('c');
}DBG> s
stepped to EX8_3_1\main\%LINE 20
20: base b1(1);
DBG> set break base::base_f1
DBG> set break base::base_f2
%DEBUG-I-NOTUNQOVR, symbol 'base::base_f2' is overloaded
overloaded name base::base_f2
instance base::base_f2(char)
instance base::base_f2(int)
instance base::base_f2()
%DEBUG-E-REENTER, reenter the command using a more precise pathname
DBG> set break base::base_f2(char)B.3.2. Referring to Destructors
The debugger supports the following formats for setting a break on a destructor:
DBG> set break stack::~stack()
DBG> set break stack::~stack(int)
B.3.3. Referring to Conversions
void char signed_char unsigned_char signed_short unsigned_short int signed_int unsigned_int signed_long unsigned_long float double long_double
Pointer types are named (type)*. Reference types are named
(type)&. The types struct, union,
class, and enum are named by their tags, and the
qualifiers const and volatile precede their types with a
space in between.
B.3.4. Referring to User-Defined Operators
+ - * / % ^ & | ~ ! = < > += -= *= /= %= ^= &= |= << >> >>= <<= == != <= >= && | ++ – ->* , -> [] () delete new
B.3.5. Referring to Function Arguments
this, *this, and
this->m as follows: - All nonstatic member functions have a pointer parameter available named
this. For example:DBG> examine this
- Use
*thisto examine the prefix object that a member function is invoked against. For example:DBG> examine *this
- Use the
thisparameter to refer to a data membermof the prefix argument to a member function. For example:DBG> examine this->m
B.3.6. Calling C++ Member Functions from the Debugger
When calling C++ member functions from the debugger, you cannot make the call using the same syntax that you would use in a C++ source file. You must call the class-qualified member function name with the object as the first argument.
extern "C" void printf(const char *,...);
class C12 {
int i;
int j;
public:
static int sum;
public:
C12() : i(1), j(2) {}
void method();
static int get_sum() {
printf("called static function get_sum()\n");
return sum;
}
};
void C12::method()
{
i = i + j;
printf("C12::method called: i=%d, j=%d\n",i,j);
}
int C12::sum = 0;
int main()
{
C12 cinst;
cinst.method();
C12::get_sum();
printf("End of example.\n");
}//Call the nonstatic member function: DBG> call cinst.method(cinst) C12::method called: i=3 j=2 value returned is 28 // notice that the following call confuses debug: DBG> call cinst.method() %DEBUG-E-MISOPEMIS, misplaced operator or missing operand at 'end of expression'
// Call the static function: DBG> call C12::get_sum called static function get_sum() value returned is 0 DBG> call cinst.get_sum called static function get_sum() value returned is 0
Appendix C. Built-In Symbols and Logical Names
This appendix identifies all the debugger built-in symbols and logical names.
C.1. SS$_DEBUG Condition
SS$_DEBUG (defined in SYS$LIBRARY:STARLET.OLB) is a
condition you can signal from your program to start the debugger. Signaling
SS$_DEBUG from your program is equivalent to pressing
Ctrl/Y followed by the DCL command
DEBUG at that point.
You can pass commands to the debugger at the time you signal it with
SS$_DEBUG. The commands you want the debugger to execute should
be specified as you would enter them at the DBG> prompt. Multiple
commands should be separated by semicolons. The commands should be passed by reference
as an ASCIC string. See your language documentation for details on constructing an ASCIC
string.
SHOW CALLS command at a
given point in your program, you can insert the following code in your program (BLISS
example):LIB$SIGNAL(SS$_DEBUG, 1, UPLIT BYTE(%ASCIC 'SHOW CALLS'));
You can obtain the definition of SS$_DEBUG at compile time from the
appropriate STARLET or SYSDEF file for your language (for example,
STARLET.L32 for BLISS or FORSYSDEF.TLB for
Fortran). You can also obtain the definition of SS$_DEBUG at link
time in SYS$LIBRARY:STARLET.OLB (this method is less
desirable).
C.2. Logical Names
|
Logical Name |
Description |
|---|---|
|
|
Applies only to workstations running VSI DECwindows Motif for OpenVMS.
Specifies the debugger interface (VSI DECwindows Motif for OpenVMS or command)
or the display device. Default:
|
|
|
(Alpha and Integrity servers only) Specifies the directory
that contains the |
|
|
Specifies your debugger initialization file. Default: no
debugger initialization file. |
|
|
Specifies the debugger input device. Default:
|
|
|
Specifies the debugger output device. Default:
|
|
|
(Alpha only) Specifies whether system service interception
(SSI) is enabled. If you are having trouble with your
watchpoints, disable SSI with the DCL command
$DEFINE SSI$AUTO_ACTIVATE OFF See SET WATCH for more information about the interaction between static watchpoints, ASTs, and system service interception. |
DEFINE or ASSIGN to assign values to
these logical names. For example, the following command specifies the location of the
debugger initialization
file:$ DEFINE DBG$INIT DISK$:[JONES.COMFILES]DEBUGINIT.COMDBG$INPUT. If you plan to
debug a program that takes its input from a file (for example,
PROG_IN.DAT) and your debugger input from the terminal,
establish the following definitions before starting the
debugger:$DEFINE SYS$INPUT PROG_IN.DAT$DEFINE/PROCESS DBG$INPUT 'F$LOGICAL("SYS$COMMAND")
That is, define DBG$INPUT to point to the translation of
SYS$COMMAND. If you define DBG$INPUT to point
to SYS$COMMAND, the debugger tries to get its input from the file
PROG_IN.DAT.
C.3. Built-In Symbols
The debugger's built-in symbols provide options for specifying program entities and values.
Most of the debugger built-in symbols have a percent sign (%) prefix.
%NAME - Used to construct identifiers.
%PARCNT - Used in command procedures to count parameters passed.
%DECWINDOWS - Used in debugger command procedures or initialization files to determine whether the debugger's command interface or VSI DECwindows Motif for OpenVMS user interface was displayed.
%BIN, %DEC, %HEX, %OCT - Used to control the input radix.
Period (.), Return key, circumflex (^), backslash (\), %CURLOC, %NEXTLOC, %PREVLOC, %CURVAL - Used to specify consecutive program locations and the current value of an entity.
Plus sign (+), minus sign (--), multiplication sign (*), division sign (/), at sign (@), period (.), bit field operator (
<p, s, e>), %LABEL, %LINE, backslash (\) - Used as operators in address expressions.%ADAEXC_NAME, %EXC_FACILITY, %EXC_NAME, %EXC_NUMBER, %EXC_SEVERITY - Used to obtain information about exceptions.
%CURRENT_SCOPE_ENTRY, %NEXT_SCOPE_ENTRY, %PREVIOUS_SCOPE_ENTRY - Used to specify the current, next, and previous scope relative to the call stack.
- On Alpha systems,
%R0 to %R28, %FP, %SP, %R31, %PC, %PS - Used to specify the Alpha general registers.
%F0 to %F30, %F31 - Used to specify the Alpha floating-point registers.
- On Integrity server processors,
%R0 to %R127, %GP, %SP, %TP, %AP, %OUT0 to %OUT7 - Used to specify the Integrity server general registers.
%F0 to %F127 - Used to specify the Integrity server floating-point registers.
P0 to %P63, %PR - Used to specify the Integrity server predicate registers.
%B0 to %B7, %RP - Used to specify the Integrity server branch registers.
%AR0 to %AR7. %AR17 to %AR19, %AR32, %AR36, %AR40, %AR64 to %AR66, %KR0 to %KR7, %RSC, %BSP, %RNAT, %CCV, %UNAT, %FPSR, %PFS, %LC, %EC, %CSD, and %SSD - Used to specify the Integrity server application registers.
%CR0 to %CR2, %CR8, %CR16, %CR17, %CR19 to %CR25, %CR64, %CR66, %CR68 to %CR74, %CR80, %CR81, %DCR, %ITM, %IVA, %PTA, %PSR, %IPSR, %ISR, %IIP, %IFA, %ITIR, %IIPA, %IFS, %IIM, %IHA, %LID, %TPR, %IRR0 to %IRR3, %ITV, %PMV, %CMCV, and %IRR0 to %IRR3 - Used to specify the Integrity server control registers.
%SR0, %IH, %PREV_BSP, %PC, %IP, %RETURN_PC, %CFM, %NEXT_PFS, %PSP, %CHTCTX_ADDR, %OSSD, %HANDLER_FV, %LSDA, and %UM - Used to specify the Integrity server special registers.
%ADDR, %DESCR, %REF, %VAL - Used to specify the argument-passing mechanism for the
CALLcommand. See theCALLcommand description in the command dictionary.%PROCESS_NAME, %PROCESS_PID, %PROCESS_NUMBER, %NEXT_PROCESS, %PREVIOUS_PROCESS, %VISIBLE_PROCESS - Used to specify processes in multiprocess programs. See Section 15.16.2, ''Specifying Processes in Debugger Commands''.
%ACTIVE_TASK, %CALLER_TASK, %NEXT_TASK, %PREVIOUS_TASK, %TASK, %VISIBLE_TASK - Used to specify tasks or threads in tasking or multithread programs. See Section 16.3.4, ''Task Built-In Symbols''.
%PAGE, %WIDTH - Used to specify the current screen height and width. See Section 7.11.1, ''Screen Height and Width''.
%SOURCE_SCOPE, %INST_SCOPE - Used to specify the scope for source and instruction display in screen mode. See Section 7.4.1, ''Predefined Source Display (SRC)'' and Section 7.4.4, ''Predefined Instruction Display (INST)'', respectively.
%CURDISP, %CURSCROLL, %NEXTDISP, %NEXTINST, %NEXTOUTPUT, %NEXTSCROLL, %NEXTSOURCE - Used in screen mode to specify displays in the display list. See Section 7.11.2, ''Display Built-In Symbols''.
C.3.1. Specifying Registers
The debugger built-in symbol for a Alpha or Integrity server register is the register name preceded by the percent sign (%). When specifying a register symbol, you can omit the percent sign (%) prefix if your program has not declared a symbol with the same name.
You can examine the contents of all the registers. You can deposit values into all the registers except for SP. Use caution when depositing values into FP.
|
Symbol |
Description |
|---|---|
|
Alpha Integer Registers | |
|
%R0…%R28 |
Registers R0…R28 |
|
%FP (%R29) |
Stack frame base register (FP) |
|
%SP (%R30) |
Stack pointer (SP) |
|
%R31 |
ReadAsZero/Sink (RZ) |
|
%PC |
Program counter (PC) |
|
%PS |
Processor status register (PS). The built-in symbols %PSL and %PSW are disabled for Alpha systems. |
|
Alpha Floating-Point Registers | |
|
%F0 …%F30 |
Registers F0 …F30 |
|
%F31 |
ReadAsZero/Sink |
The debugger does not provide a screen-mode register display.
You cannot deposit a value into registers R31 or F31. They are permanently assigned the value 0.
There are no vector registers.
See Section 4.4, ''Examining and Depositing into Registers'' and Section 4.4.1, ''Examining and Depositing into Alpha Registers'' for more information about the Alpha general registers.
|
Symbol |
Description |
|---|---|
|
IA-64 Application Registers | |
|
%KR0 …%KR7 |
Kernel registers 0 …7 |
|
%RSC (%AR16) |
Register Stack Configuration |
|
%BSP (%AR17) |
Backing Store Pointer |
|
%BSPSTORE (%AR18) |
Backing Store Pointer for Memory Stores |
|
%RNAT (%AR19) |
RSE NaT Collection |
|
%CCV ($AR32) |
Compare and Exchange Compare Value |
|
%UNAT (%AR36) |
User NaT Collection |
|
%FPSR (%AR40) |
Floating-point Status |
|
%PFS (%AR64) |
Previous Function State |
|
%LC (%AR65) |
Loop Count |
|
%EC (%AR66) |
Epilog Count |
|
%CSD |
Code Segment |
|
%SSD |
Stack Segment |
|
Control Registers | |
|
%DCR (%CR0) |
Default Control |
|
%ITM (%CR1) |
Interval Timer Match (only visible for SCD) |
|
%IVA (%CR2) |
Interruption Vector Address (only visible for SCD) |
|
%PTA (%CR8) |
Page Table Address (only visible for SCD) |
|
%PSR (%CR9, %ISPR) |
Interruption Processor Status |
|
%ISR (%CR17) |
Interruption Status |
|
%IIP (%CR19) |
Interruption Instruction Pointer |
|
%IFA (%CR20) |
Interruption Faulting Address |
|
%ITIR (%CR21) |
Interruption TLB Insertion |
|
%IIPA (%CR22) |
Interruption Instruction Previous |
|
%IFS (%CR23) |
Interruption Function State |
|
%IIM (%CR24) |
Interruption Immediate |
|
%IHA (%CR25) |
Interruption Hash Address |
|
%LID (%CR64) |
Local Interrupt ID (only visible for SCD) |
|
%TPR (%CR66) |
Task Priority (only visible for SCD) |
|
%IRR0 …%IRR3 (%CR68 …%CR71 ) |
External Interrupt Request 0 …3 (only visible for SCD) |
|
%ITV (%CR72) |
Interval Timer (only visible for SCD) |
|
%PMV (%CR73) |
Performance Monitoring (only visible for SCD) |
|
%CMCV (%CR74) |
Corrected Machine Check Vector (only visible for SCD) |
|
%IRR0 and %IRR1 (%CR80 and %CR81) |
Local Redirection 0:1 (only visible for SCD) |
|
Special Registers | |
|
%IH (%SR0) |
Invocation Handle |
|
%PREV_BSP |
Previous Backing Store Pointer |
|
%PC (%IP ) |
Program Counter (Instruction Pointer | slot number) |
|
%RETURN_PC |
Return Program Counter |
|
%CFM |
Current Frame Marker |
|
%NEXT_PFS |
Next Previous Frame State |
|
%PSP |
Previous Stack Pointer |
|
%CHFCTX_ADDR |
Condition Handling Facility Context Address |
|
%OSSD |
Operating System Specific Data |
|
%HANDLER_FV |
Handler Function Value |
|
%LSDA |
Language Specific Data Area |
|
%UM |
User Mask |
|
Predicate Registers | |
|
%PR (%PRED) |
Predicate Collection Register -- Collection of %P0 …%P63 |
|
%P0 …%P63 |
Predicate (single-bit )Registers 0 …63 |
|
Branch Registers | |
|
%RP (%B0) |
Return Pointer |
|
%B1 …%B7 |
Branch Registers 1 …7 |
|
General Integer Registers | |
|
%R0 |
General Integer Register 0 |
|
%GP (%R1 ) |
Global Data Pointer |
|
%R2 …%R11 |
General Integer Registers 2 …11 |
|
%SP (%R12 ) |
Stack Pointer |
|
%TP (%R13 ) |
Thread Pointer |
|
%R14 …%R24 |
General Integer Registers 14 …24 |
|
%AP (%R25 ) |
Argument Information |
|
%R26 …%R127 |
General Integer Registers 26 …127 |
|
Output Registers | |
|
%OUT0 …%OUT7 |
Output Registers, runtime aliases (i.e., If the frame has allocated output registers, then %OUT0 maps to the first allocated output registers, for example, %R38, etc. ) |
|
General Registers | |
|
%GRNAT0 and %GRNAT1 |
General Register Not A Thing (NAT) collection registers 64
bits each, for example, %GRNAT0 |
|
Floating Point Registers | |
|
%F0 …%F127 |
Floating Poing Registers 0 …127 |
See Section 4.4, ''Examining and Depositing into Registers'' and reference (I64_reg_status_sec) for more information about the Integrity server registers.
C.3.2. Constructing Identifiers
%NAME 'character-string'DBG> EXAMINE %NAME '12'DBG> EXAMINE %NAME 'P.AAA'C.3.3. Counting Parameters Passed to Command Procedures
You can use the %PARCNT built-in symbol within a command procedure that accepts a variable number of actual parameters (%PARCNT is defined only within a debugger command procedure).
ABC.COM is invoked and
three parameters are passed:
DBG> @ABC 111, 222, 333ABC.COM, %PARCNT now has the value 3. %PARCNT is then used as a
loop counter to obtain the value of each parameter passed to
ABC.COM:DBG> FOR I = 1 TO %PARCNT DO (DECLARE X:VALUE; EVALUATE X)C.3.4. Determining the Debugger Interface (Command or VSI DECwindows Motif for OpenVMS)
DBG> EVALUATE %DECWINDOWS
0IF %DECWINDOWS THEN
! DECwindows Motif (workstation) syntax:
(DISPLAY SRC AT (100, 300, 100, 700))
ELSE
! Screen-mode (terminal) syntax:
(DISPLAY SRC AT (AT H1))C.3.5. Controlling the Input Radix
DBG>EVALUATE/DEC %HEX 1016 DBG>EVALUATE/DEC %HEX (10 + 10)32 DBG>EVALUATE/DEC %BIN 102 DBG>EVALUATE/DEC %OCT (10 + 10)16 DBG>EVALUATE/HEX %DEC 100A DBG>SET RADIX DECIMALDBG>EVALUATE %HEX 20 + 33! Treat 20 as hexadecimal, 33 as decimal 65 ! Resulting value is decimal DBG>EVALUATE %HEX (20+33)! Treat both 20 and 33 as hexadecimal 83 DBG>EVALUATE %HEX (20+ %OCT 10 +33)! Treat 20 and 33 as 91 ! hexadecimal and 10 as octal DBG>SYMBOLIZE %HEX 27C9E3! Symbolize a hexadecimal address DBG>DEPOSIT/INST %HEX 5432 = 'MOVL ^O%DEC 222, R1'DBG> ! Treat address 5432 as hexadecimal, and operand 222 as decimal
C.3.6. Specifying Program Locations and the Current Value of an Entity
|
Symbol |
Description |
|---|---|
|
%CURLOC. (period) |
Current logical entity - the program location last
referenced by an |
|
%NEXTLOC Return key |
Logical successor of the current entity - the program
location that logically follows the location last referenced
by an |
|
%PREVLOC ^ (circumflex) |
Logical predecessor of current entity - the program
location that logically precedes the location last
referenced by an |
|
%CURVAL \ (backslash) |
Value last displayed by an |
DBG>EXAMINE WIDTHMOD\WIDTH: 7 DBG>DEPOSIT . = 12DBG>EXAMINE .MOD\WIDTH: 12 DBG>EXAMINE %CURLOCMOD\WIDTH: 12 DBG>
DBG>EXAMINE PRIMES(4)MOD\PRIMES(4): 7 DBG>EXAMINE %NEXTLOCMOD\PRIMES(5): 11 DBG>EXAMINE Return! Examine next location MOD\PRIMES(6): 13 DBG>EXAMINE %PREVLOCMOD\PRIMES(5): 11 DBG>EXAMINE ^MOD\PRIMES(4): 7 DBG>
Note that using the Return key to signify the logical successor
does not apply to all contexts. For example, you cannot press the Return key after
typing the command DEPOSIT to indicate the next location, but you
can always use the symbol %NEXTLOC for that purpose.
C.3.7. Using Symbols and Operators in Address Expressions
The following examples show the use of built-in symbols and operators in address expressions.
%LINE and %LABEL Operators
DBG> SET TRACE %LINE 26DBG> EXAMINE/SOURCE %LINE 47
module MAIN
47: procedure SWAP(X, Y: in out INTEGER) is
DBG>DBG> SET BREAK MOD4\%LABEL 10Path-Name Operators
DBG> EXAMINE MOD4\ROUT2\COUNT
MOD4\ROUT2\COUNT: 12
DBG>DBG> SET BREAK QUEUMAN\%LINE 26DBG> EXAMINE \XArithmetic Operators
The use of delimiters (usually parentheses or brackets) to group operands with particular operators
The assignment of relative priority to each operator
Left-to-right priority of operators
Unary operators (., @, +, -)
Multiplication and division operators (*, /)
Addition and subtraction operators (+, -)
5-(T+5)/4
DBG> EXAMINE X + 4Contents-of Operator
DBG> EXAMINE .%PC
MOD\%LINE 5: PUSHL S^#8
DBG>DBG> EXAMINE/SOURCE .1\%PC
module MAINMAIN\%LINE 134: SWAP(X, Y);
DBG>DBG> EXAMINE/LONG .PTR
7FF00000: 3FF00000
DBG>In the next example, the contents-of operator (at sign or period) is used with the current location operator (period) to examine a linked list of three quadword-integer pointer variables (identified as L1, L2, and L3 in the following figure). P is a pointer to the start of the list. The low longword of each pointer variable contains the address of the next variable;the high longword of each variable contains its integer value (8, 6, and 12, respectively).
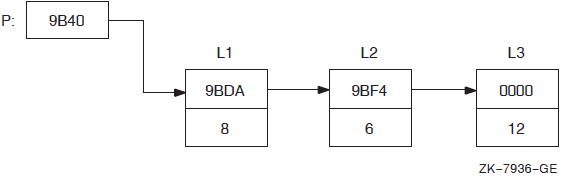
DBG>SET TYPE QUADWORD; SET RADIX HEXDBG>EXAMINE .P! Examine the entity whose address ! is contained in P.zz 00009BC2: 00000008 00009BDA ! High word has value 8, low word ! has address of next entity (9BDA). DBG>EXAMINE @.! Examine the entity whose address ! is contained in the current entity. 00009BDA: 00000006 00009BF4 ! High word has value 6, low word ! has address of next entity (9BF4). DBG>EXAMINE ..! Examine the entity whose address ! is contained in the current entity. 00009BF4: 0000000C 00000000 ! High word has value 12 (dec.), low word ! has address 0 (end of list).
Bit-Field Operator
DBG> EXAMINE X_NAME <3, 4, 0>C.3.8. Obtaining Information About Exceptions
|
Symbol |
Description |
|---|---|
|
%EXC_FACILITY |
Name of facility that issued the current exception |
|
%EXC_NAME |
Name of current exception |
|
%ADAEXC_NAME |
Ada exception name of current exception (for Ada programs only) |
|
%EXC_NUMBER |
Number of current exception |
|
%EXC_SEVERITY |
Severity code of current exception |
DBG>EVALUATE %EXC_NAME"FLTDIV_F" DBG>SET BREAK/EXCEPTION WHEN (%EXC_NAME = "FLTDIV_F")⋮ DBG>EVALUATE %EXC_NUMBER12 DBG>EVALUATE/CONDITION_VALUE %EXC_NUMBER%SYSTEM-F-ACCVIO, access violation at PC !XL, virtual address !XL DBG>SET BREAK/EXCEPTION WHEN (%EXC_NUMBER = 12)
The conditional expressions in the WHEN clauses are language-specific.
C.3.9. Specifying the Current, Next, and Previous Scope on the Call Stack
|
Built-in Symbol |
Description |
|---|---|
|
%CURRENT_SCOPE_ENTRY |
The call frame that the debugger is currently using as reference when displaying source code or decoded instructions, or when searching for symbols. By default, this is call frame 0. |
|
%NEXT_SCOPE_ENTRY |
The next call frame down the call stack from the call frame denoted by %CURRENT_SCOPE_ENTRY. |
|
%PREVIOUS_SCOPE_ENTRY |
The next call frame up the call stack from the call frame denoted by %CURRENT_SCOPE_ENTRY. |
These symbols return integer values that denote a call frame on the call stack. Call frame 0 denotes the routine at the top of the stack, where execution is suspended. Call frame 1 denotes the calling routine, and so on.
DBG> SET SCOPE/CURRENT %NEXT_SCOPE_ENTRYAppendix D. Summary of Debugger Support for Languages
The OpenVMS Debugger supports languages on Integrity servers and Alpha systems.
D.1. Overview
The debugger recognizes the syntax, data typing, and scoping rules of each language. It also recognizes each language's operators and expression syntax. Therefore, when using debugger commands you can specify variables and other program entities as you might in the source code of the program. You can also compute the value of a source-language expression using the syntax of that language.
Supported operators in language expressions
Supported constructs in language expressions and address expressions
Supported data types
Any other language-specific information, including restrictions in debugger support, if any
For more information about language-specific debugger support, refer to the documentation furnished with a particular language.
If your program is written in more than one language, you can change the debugging context
from one language to another during a debugging session. Use the SET LANGUAGE
command with the keyword corresponding to your language choice.
|
AMACRO |
BASIC |
BLISS |
C |
|
C++ |
COBOL |
Fortran |
PASCAL |
|
UNKNOWN |
|
ADA |
AMACRO |
BASIC |
BLISS |
|
C |
C++ |
COBOL |
FORTRAN |
|
MACRO |
MACRO64 |
PASCAL |
UNKNOWN |
When you are debugging a program written in an unsupported language, enter the SET
LANGUAGE UNKNOWN command. To maximize the usability of the debugger with unsupported
languages, this setting causes the debugger to accept a large set of data formats and operators,
including some that might be specific to only a few supported languages. For information about
the operators and constructs that are recognized when the language is set to UNKNOWN, type
Help Language_UNKNOWN.
D.2. GNAT Ada (Integrity servers only)
Note
HP is not porting the HP Ada (Ada 83) compiler from OpenVMS Alpha to OpenVMS for Integrity servers.
GNAT Pro Users Guide -- This guide describes the use of GNAT Pro, a compiler and software development tool set for the full Ada 95 programming language. It can be found at the following URL:
http://www.gnat.com/wp-content/files/auto_update/gnat-unw-docs/html/gnat_ugn.htmlGNAT Pro Reference Manual -- This manual contains information for writing programs using the GNAT Pro compiler. It includes information on implementation-dependent characteristics of GNAT Pro, including all the information required by Annex M of the standard. It can be found at the following URL:
http://www.gnat.com/wp-content/files/auto_update/gnat-unw-docs/html/gnat_rm.html
For information about HP Ada on OpenVMS Alpha, see Section D.3, ''HP Ada''.
D.3. HP Ada
The following subtopics describe debugger support for HP Ada on Alpha systems. For information specific to Ada tasking programs, see also Chapter 16, "Debugging Tasking Programs".
D.3.1. Ada Names and Symbols
The following subtopics describe debugger support for Ada names and symbols, including predefined attributes.
Note that parts of names may be language expressions - for example, attributes such as
'FIRST or 'POS. This affects how you use the EXAMINE,
EVALUATE, and DEPOSIT commands with such names. For
examples of enumeration types, type Help
Specifying_Attributes_with_Enumeration_Types.
D.3.1.1. Ada Names
|
Kind of Name |
Debugger Support |
|---|---|
|
Lexical elements |
Full support for Ada rules for the syntax of identifiers. Function designators that are operator symbols (for example, + and *) rather than identifiers must be prefixed with %NAME. Also, the operator symbol must be enclosed in quotation marks. Full support for Ada rules for numeric literals, character literals, string literals, and reserved words. The debugger accepts signed integer literals in the range --2147483648 to 2147483647. Depending on context and architecture, the debugger interprets floating-point types as F_floating, D_floating, G_floating, H_floating, S_floating, or T_floating. |
|
Indexed components |
Full support. |
|
Slices |
You can examine and evaluate an entire slice or an indexed component of a slice. You can deposit only to an indexed component of a slice. You cannot deposit an entire slice. |
|
Selected components |
Full support, including use of the keyword all in .all. |
|
Literals |
Full support, including the keyword null. |
|
Boolean symbols |
Full support (TRUE, FALSE). |
|
Aggregates |
You can examine the entire record and array objects with the
|
D.3.1.2. Predefined Attributes
SHOW
SYMBOL/TYPE command provides the same information that is provided by the P'FIRST,
P'LAST, P'LENGTH, P'SIZE, and P'CONSTRAINED attributes.|
Attribute |
Debugger Support |
|---|---|
|
P'CONSTRAINED |
For a prefix P that denotes a record object with discriminants. The value of P'CONSTRAINED reflects the current state of P (constrained or unconstrained). |
|
P'FIRST |
For a prefix P that denotes an enumeration type or a subtype of an enumeration type. Yields the lower bound of P. |
|
P'FIRST |
For a prefix P that is appropriate for an array type, or that denotes a constrained array subtype. Yields the lower bound of the first index range. |
|
P'FIRST(N) |
For a prefix P that is appropriate for an array type, or that denotes a constrained array subtype. Yields the lower bound of the Nth index range. |
|
P'LAST |
For a prefix P that denotes an enumeration type, or a subtype of an enumeration type. Yields the upper bound of P. |
|
P'LAST |
For a prefix P that is appropriate for an array type, or that denotes a constrained array subtype. Yields the upper bound of the first index range. |
|
P'LAST(N) |
For a prefix P that is appropriate for an array type, or that denotes a constrained array subtype. Yields the upper bound of the Nth index range. |
|
P'LENGTH |
For a prefix P that is appropriate for an array type, or that denotes a constrained array subtype. Yields the number of values of the first index range (zero for a null range). |
|
P'LENGTH(N) |
For a prefix P that is appropriate for an array type, or that denotes a constrained array subtype. Yields the number of values of the Nth index range (zero for a null range). |
|
P'POS(X) |
For a prefix P that denotes an enumeration type or a subtype of an enumeration type. Yields the position number of the value X. The first position is 0. |
|
P'PRED(X) |
For a prefix P that denotes an enumeration type or a subtype of an enumeration type. Yields the value of type P which has a position number one less than that of X. |
|
P'SIZE |
For a prefix P that denotes an object. Yields the number of bits allocated to hold the object. |
|
P'SUCC(X) |
For a prefix P that denotes an enumeration type or a subtype of an enumeration type. Yields the value of type P which has a position number one more than that of X. |
|
P'VAL(N) |
For a prefix P that denotes an enumeration type or a subtype of an enumeration type. Yields the value of type P which has the position number N. The first position is 0. |
D.3.1.2.1. Specifying Attributes with Enumeration Types
type DAY is (MONDAY, TUESDAY, WEDNESDAY, THURSDAY, FRIDAY, SATURDAY, SUNDAY); MY_DAY : DAY;
EXAMINE command to determine the value of attributes,
because attributes are not variable names. You must use the EVALUATE
command instead. For the same reason, attributes can appear only on the right of the:=
operator in a DEPOSIT
command.DBG>EVALUATE DAY'FIRSTMON DBG>EVALUATE DAY'POS(WEDNESDAY)2 DBG>EVALUATE DAY'VAL(4)FRI DBG>DEPOSIT MY_DAY := TUESDAYDBG>EVALUATE DAY'SUCC(MY_DAY)WED DBG>DEPOSIT . := DAY'PRED(MY_DAY)DBG>EXAMINE .EXAMPLE.MY_DAY: MONDAY DBG>EVALUATE DAY'PRED(MY_DAY)%DEBUG-W-ILLENUMVAL, enumeration value out of legal range
D.3.1.2.2. Resolving Overloaded Enumeration Literals
type MASK is (DEC, FIX, EXP); type CODE is (FIX, CLA, DEC); MY_MASK : MASK; MY_CODE : CODE;
DBG>DEPOSIT MY_CODE := FIX%DEBUG-W-NOUNIQUE, symbol 'FIX' is not unique DBG>SHOW SYMBOL/TYPE FIXdata EXAMPLE.FIX enumeration type (CODE, 3 elements), size: 1 byte data EXAMPLE.FIX enumeration type (MASK, 3 elements), size: 1 byte DBG>DEPOSIT MY_CODE := CODE'(FIX)DBG>EXAMINE MY_CODEEXAMPLE.MY_CODE: FIX
D.3.2. Operators and Expressions
The following sections describe debugger support for Ada operators and language expressions.
D.3.2.1. Operators and Expressions
|
Kind |
Symbol |
Function |
|---|---|---|
|
Prefix |
+ |
Unary plus (identity) |
|
Infix |
+ |
Addition |
|
Infix |
* |
Multiplication |
|
Infix |
/ |
Division |
|
Infix |
MOD |
Modulus |
|
Infix |
REM |
Remainder |
|
Prefix |
ABS |
Absolute value |
|
Infix |
& |
Concatenation (only string types) |
|
Infix |
= |
Equality (only scalar and string types) |
|
Infix |
/= |
Inequality (only scalar and string types) |
|
Infix |
> |
Greater than (only scalar and string types) |
|
Infix |
>= |
Greater than or equal (only scalar and string types) |
|
Infix |
< |
Less than (only scalar and string types) |
|
Infix |
<= |
Less than or equal (only scalar and string types) |
|
Prefix |
NOT |
Logical NOT |
|
Infix |
AND |
Logical AND (not for bit arrays) |
|
Infix |
OR |
Logical OR (not for bit arrays) |
|
Infix |
XOR |
Logical exclusive OR (not for bit arrays) |
Operations on entire arrays or records
The short-circuit control forms: and then, or else
The membership tests: in, not in
User-defined operators
D.3.2.2. Language Expressions
|
Kind of Expression |
Debugger Support |
|---|---|
|
Type conversions |
No support for any of the explicit type conversions specified in Ada. However, the debugger performs certain implicit type conversions between numeric types during the evaluation of expressions. The debugger converts lower-precision types to higher-precision types before
evaluating expressions involving types of different precision:
|
|
Subtypes |
Full support. Note that the debugger denotes subtypes and types that have range constraints as "subrange" types. |
|
Qualified expressions |
Supported as required to resolve overloaded enumeration literals (literals that have the same identifier but belong to different enumeration types). The debugger does not support qualified expressions for any other purpose. |
|
Allocators |
No support for any operations with allocators. |
|
Universal expressions |
No support. |
D.3.3. Data Types
|
Ada Data Type |
Operating System Data Type Name |
|---|---|
|
INTEGER |
Longword Integer (L) |
|
SHORT_INTEGER |
Word Integer (W) |
|
SHORT_SHORT_INTEGER |
Byte Integer (B) |
|
SYSTEM.UNSIGNED_QUADWORD |
Quadword Unsigned (QU) |
|
SYSTEM.UNSIGNED_LONGWORD |
Longword Unsigned (LU) |
|
SYSTEM.UNSIGNED_WORD |
Word Unsigned (WU) |
|
SYSTEM.UNSIGNED_BYTE |
Byte Unsigned (BU) |
|
FLOAT |
F_Floating (F) |
|
SYSTEM.F_FLOAT |
F_Floating (F) |
|
SYSTEM.D_FLOAT |
D_Floating (D) |
|
LONG_FLOAT |
D_Floating (D), if pragma LONG_FLOAT (D_FLOAT) is in effect. G_Floating (G), if pragma LONG_FLOAT (G_FLOAT) is in effect. |
|
SYSTEM.G_FLOAT |
G_Floating (G) |
|
IEEE_SINGLE_FLOAT (Alpha specific) |
S_Floating (FS) |
|
IEEE_DOUBLE_FLOAT (Alpha specific) |
T_Floating (FT) |
|
Fixed |
(None) |
|
STRING |
ASCII Text (T) |
|
BOOLEAN |
Aligned Bit String (V) |
|
BOOLEAN |
Unaligned Bit String (VU) |
|
Enumeration |
For any enumeration type whose value fits into an unsigned byte or word: Byte Unsigned (BU) or Word Unsigned (WU), respectively. Otherwise: No corresponding operating system data type. |
|
Arrays |
(None) |
|
Records |
(None) |
|
Access (pointers) |
(None) |
|
Tasks |
(None) |
D.3.4. Compiling and Linking
The Ada predefined units in the ADA$PREDEFINED program library on your
system have been compiled with the /NODEBUG qualifier. Before using the
debugger to refer to names declared in the predefined units, you must first copy the predefined
unit source files using the ACS EXTRACT SOURCE command. Then, you must
compile the copies into the appropriate library with the /DEBUG qualifier,
and relink the program with the /DEBUG qualifier.
/NODEBUG qualifier with one of the Ada compilation
commands, only global symbol records are included in the modules for debugging. Global symbols
in this case are names that the program exports to modules in other languages by means of the
Ada export pragm as: - EXPORT_PROCEDURE
- EXPORT_VALUED_PROCEDURE
- EXPORT_FUNCTION
- EXPORT_OBJECT
- EXPORT_EXCEPTION
- PSECT_OBJECT
The /DEBUG qualifier on the ACS LINK command causes
the linker to include all debugging information in the closure of the specified unit in the
executable
image.
D.3.5. Source Display
Execution is paused within Ada initialization or elaboration code, for which no source code is available.
The copied source file is not in the program library where the unit was originally compiled.
The external source file is not where it was when the unit was originally compiled.
The source file has been modified since the executable image was generated, and the original copied source file or external source file no longer exists.
The following paragraphs explain how to control the display of source code with Ada programs.
If the compiler command's /COPY_SOURCE qualifier (the default) was in
effect when you compiled your program, the debugger obtains the displayed Ada source code from
the copied source files located in the program library where the program was originally
compiled. If you compiled your program with the /NOCOPY_SOURCE qualifier, the
debugger obtains the displayed Ada source code from the external source files associated with
your program's compilation units.
The file specifications of the copied or external source files are embedded in the
associated object files. For example, if you have used the ACS COPYUNIT
command to copy units, or the DCL command COPY or BACKUP
to copy an entire library, the debugger still searches the original program library for copied
source files. If, after copying, the original units have been modified or the original library
has been deleted, the debugger may not find the original copied source files. Similarly, if you
have moved the external source files to another disk or directory, the debugger may not find
them.
SET SOURCE command to locate the correct files
for source display. You can specify a search list of one or more program library or source code
directories. For example (ADA$LIB is the logical name that the program library manager equates
to the current program
library):DBG> SET SOURCE ADA$LIB, DISK:[SMITH.SHARE.ADALIB]The SET SOURCE command does not affect the search list for the external
source files that the debugger fetches when you use the debugger EDIT
command. To tell the EDIT command where to look for your source files, use
the SET SOURCE/EDIT command.
D.3.6. EDIT Command
With Ada programs, by default the debugger EDIT command fetches the
external source file that was compiled to produce the compilation unit in which execution is
currently paused. You do not edit the copied source file, in the program library, that the
debugger uses for source display.
The file specifications of the source files you edit are embedded in the associated object
files during compilation (unless you specify /NODEBUG). If some source files
have been relocated after compilation, the debugger may not find them.
SET SOURCE/EDIT command to
specify a search list of one or more directories where the debugger should look for source
files. For example:
DBG> SET SOURCE/EDIT [], USER:[JONES.PROJ.SOURCES]The SET SOURCE/EDIT command does not affect the search list for copied
source files that the debugger uses for source display.
The SHOW SOURCE/EDIT command displays the source-file search list
currently being used for the EDIT command. The CANCEL
SOURCE/EDIT command cancels the source-file search list currently being used for the
EDIT command and restores the default search mode.
D.3.7. GO and STEP Commands
GO and STEP
commands with Ada programs:- When starting a debugging session, use the
GOcommand rather than theSTEPcommand to avoid stepping through compiler-generated initialization code.Use the
GOcommand to go directly to the preset breakpoint at the start of the main program, past the initialization and package elaboration code.Use the
GOcommand and breakpoints to suspend execution at the start of the elaboration of library packages, before execution reaches the main program.
For information on how to monitor the package elaboration phase, type
Help Debugging_Ada_Library_Packages. If a line contains more than one statement, a
STEPcommand executes all the statements on that line as part of a single step.Ada task entry calls are not the same as subprogram calls because task entry calls are queued and may not execute right away. If you use the
STEPcommand to move execution into a task entry call, the results might not be what you expect.
D.3.8. Debugging Ada Library Packages
When an Ada main program (or a non-Ada main program that calls Ada code) is executed, initialization code is executed for the Ada run-time library and elaboration code for all library units that the program depends on. The elaboration code causes the library units to be elaborated in appropriate order before the main program is executed. Library specifications, bodies, and some of their subunits are also elaborated by this process.
Causes package declarations to take effect
Initializes any variables whose declaration includes initialization code
Executes any sequence of statements that appear between the begin and end statements of package bodies
DBG> RUN FORMS
Language: ADA, Module: FORMS
Type GO to reach main program
DBG>At that point, before typing GO to get to the start of the main program,
you can step through and examine parts of the library packages by setting breakpoints at the
package specifications or bodies you are interested in. You then use the GO
command to get to the start of each package. To set a breakpoint on a package body, specify the
package unit name with the SET BREAK command. To set a breakpoint on a
package specification, specify the package unit name followed by a trailing underscore character
(_).
Even if you have set a breakpoint on a package body, the break will not occur if the debugger module for that body is not set. If the module is not set, the break will occur at the package specification. This effect occurs because the debugger automatically sets modules for the specifications of packages named in with clauses; it does not automatically set modules for the associated package bodies.
Also, to set a breakpoint on a subprogram declared in a package specification, you must set the module for the package body.
Note that the compiler generates unique names for subprograms declared in library packages that are or could be overloaded names. The debugger uses these unique names in its output, and requires them in commands where the names would otherwise be ambiguous. For more information on resolving overloaded names and symbols, Section D.3.15, ''Resolving Overloaded Names and Symbols''.
D.3.9. Predefined Breakpoints
When you start the debugger with an Ada program (or a non-Ada program that calls Ada code), two breakpoints that are associated with Ada tasking exception events are automatically established. These breakpoints are established automatically during debugger initialization when the Ada run-time library is present.
SHOW BREAK command under these conditions, the
following breakpoints are displayed:
DBG> SHOW BREAK
Predefined breakpoint on ADA event "EXCEPTION_TERMINATED"
for any value
Predefined breakpoint on ADA event "DEPENDENTS_EXCEPTION"
for any value
DBG>D.3.10. Monitoring Exceptions
A user-defined exception - an exception declared with the Ada reserved word exception in an Ada compilation unit
An Ada predefined exception, such as PROGRAM_ERROR or CONSTRAINT_ERROR
Any other (non-Ada) exception or condition
The following subtopics explain how to monitor such exceptions.
D.3.10.1. Monitoring Any Exception
The SET BREAK/EXCEPTION command enables you to set a breakpoint on any exception or condition. This includes certain conditions that are signaled internally within the Ada run-time library. These conditions are an implementation mechanism; they do not represent program failures, and they cannot be handled by Ada exception handlers. If these conditions appear while you are debugging your program, you may want to consider specifying the kind of exceptions when setting breakpoints.
SET TRACE/EXCEPTION
command:DBG>SET TRACE/EXCEPTIONDBG>GO… %ADA-F-CONSTRAINT_ERRO, CONSTRAINT_ERROR -ADA-I-EXCRAIPRI, Exception raised prior to PC = 00000A7C trace on exception preceding ADA$RAISE\ADA$RAISE_CONDITION.%LINE 333+12 …
SHOW CALLS command displays a traceback of the
calls leading to the subprogram where the exception occurred or to which the exception was
raised:DBG>SET BREAK/EXCEPTION DO (SHOW CALLS)DBG>GO… %SYSTEM-F-INTDIV, arithmetic trap, integer divide by zero at PC=000008AF, PSL=03C000A2 break on exception preceding SYSTEM_OPS.DIVIDE.%LINE 17+6 17: return X/Y; module name routine name line rel PC abs PC *SYSTEM_OPS DIVIDE 17 00000015 000008AF *PROCESSOR PROCESSOR 19 000000AE 00000BAD *ADA$ELAB_PROCESSOR ADA$ELAB_PROCESSOR 00000009 00000809 LIB$INITIALIZE 00000054 00000C36 SHARE$ADARTL 00000000 000398BE *ADA$ELAB_PROCESSOR ADA$ELAB_PROCESSOR 0000001B 0000081B LIB$INITIALIZE 0000002F 00000C21
In this example, the condition SS$_INTDIV is raised at line 17 of the subprogram DIVIDE in the package SYSTEM_OPS. The example shows an important effect: some conditions (such as SS$_INTDIV) are treated as being equivalent to some Ada predefined exceptions.
The matching of a condition and an Ada predefined exception is performed by the condition handler provided by Ada for any frame that includes an exception part. Therefore, when an exception breakpoint or tracepoint is triggered by a condition that has an equivalent Ada exception name, the message displays only the system condition code name, and not the name of the corresponding Ada exception.
D.3.10.2. Monitoring Specific Exceptions
|
%EXC_FACILITY |
A string that names the facility that issued the exception. The facility name for Ada predefined exceptions and user-defined exceptions is ADA. |
|
%EXC_NAME |
An uppercase string that names the exception. If the exception raised is an Ada predefined exception, its name is truncated if it exceeds 15 characters. For example, CONSTRAINT_ERROR is truncated to CONSTRAINT_ERRO. If the exception is a user-defined exception, %EXC_NAME contains the string "EXCEPTION", and the name of the user-defined exception is contained in %ADAEXC_NAME. |
|
%ADAEXC_NAME |
If the exception raised is user-defined, %ADAEXC_NAME contains a string that names the exception, and %EXC_NAME contains the string "EXCEPTION". If the exception is not user-defined, %ADAEXC_NAME contains a null string, and the name of the exception is contained in %EXC_NAME. |
|
%EXC_NUM |
The number of the exception. |
|
%EXC_SEVERITY |
A string that gives the exception severity level (F, E, W, I, S, or ?). |
D.3.10.3. Monitoring Handled Exceptions and Exception Handlers
The SET BREAK/EVENT and SET TRACE/EVENT commands let
you set breakpoints and tracepoints on exceptions that are about to be handled by Ada exception
handlers. These commands let you observe the execution of each Ada exception handler that gains
control.
|
HANDLED |
Triggers when an exception is about to be handled in an Ada exception handler
(includes |
|
HANDLED_OTHERS |
Triggers only when an exception is about to be handled in an Ada exception handler
choice |
DBG> SET BREAK/EVENT=HANDLEDGO command, and see which Ada handler next attempts to handle the
exception. For
example:DBG>GO… break on Ada event HANDLED task %TASK 1 is about to handle an exception The Ada exception handler is at: PROCESSOR.%LINE 21 %ADA-F-CONSTRAINT_ERRO, CONSTRAINT_ERROR -ADA-I-EXCRAIPRI, Exception raised prior to PC = 00000A7C DBG>SET BREAK PROCESSOR.%LINE 21; GO
D.3.11. Examining and Manipulating Data
Before you can examine or deposit into a nonstatic variable (any variable not declared in a library package), its defining subprogram, task, and so on, must be active on the call stack.
Before you can examine, deposit, or evaluate an Ada subprogram formal parameter or an Ada variable, the parameter or variable must be elaborated. In other words, you should step or otherwise move execution past the parameter or variable's declaration. The value contained in any variable or formal parameter whose declaration has not been elaborated might be invalid.
In most cases, the debugger enables you to specify variables and expressions in debugger commands exactly as you would specify them in the source code of the program, including use of qualified expressions. The following subtopics discuss some additional points about debugger support for records and access types.
D.3.11.1. Records
With certain Ada record variables, the debugger fails to show the record components correctly (possibly with a NO ACCESSR error message) when the type declaration is in a different scope than the record (symbol) declaration.
- With variant records, the debugger lets you examine or assign a value to a component of a variant part that is not active. But because this is an illegal action in Ada, the debugger also issues an informational message. For example, assume that record REC1 has a variant field named STATUS and that the value of STATUS is such that REC1.COMP3 is inactive:
DBG>
EXAMINE REC1.COMP3%DEBUG-I-BADDISCVAL, incorrect value of 1 in discriminant field STATUS MAIN.REC1.COMP3: 438
D.3.11.2. Access Types
The debugger does not support allocators, so you cannot create new access objects with the debugger.
When you specify the name of an access object with the
EXAMINEcommand, the debugger displays the memory location of the object it designates.- To examine the value of a designated object, you must use selected component notation, specifying
.ALL. For example, to examine the value of a record access object designated by A:DBG>
EXAMINE A.ALLEXAMPLE.A.ALL NAME(1..10): "John Doe " AGE : 6 NEXT: 1462808 - To examine one component of a designated object, you can omit
.ALLfrom the selected component syntax. For example:DBG>
EXAMINE A.NAMEEXAMPLE.A.ALL.NAME(1..10): "John Doe"
package P is type T is private; private type T_TYPE; type T is access T_TYPE; end P; package body P is type T_TYPE is record A: NATURAL := 5; B: NATURAL := 4; end record; T_REC: T_TYPE; T_PTR: T := new T_TYPE'(T_REC); end P; with P; use P; procedure INCOMPLETE is VAR: T; begin … end INCOMPLETE;
The debugger does not have complete information about the type T, so you cannot manipulate the variable VAR. However, the debugger does have information about objects declared in the package body P. Thus, you can manipulate the variables T_PTR and T_REC.
D.3.12. Module Names and Path Names
The names of Ada debugger modules are the same as the names of the corresponding
compilation units, with the following provision. To eliminate ambiguity, an underscore character
(_) is appended to a specification name to distinguish it from its body name.
For example, TEST (body), TEST_ (specification). To determine the exact names of the modules in
your program, use the SHOW MODULE command.
In most cases when you specify a path name, the debugger can distinguish body names and specification names from the context. Therefore, use this naming convention only if needed to resolve an ambiguity.
TEST_.A1 ! A1 is declared in the package
! specification of unit TEST
TEST.B1 ! B1 is declared in the package
! body of unit TESTThe maximum length that you can specify for a subunit path name (expanded name) is 247 characters.
When a use clause makes a symbol declared in a package directly visible outside the
package, you do not need to specify an expanded name (package-name.symbol) to
refer to the symbol, either in the program itself or in debugger commands.
SHOW SYMBOL/USE_CLAUSE command identifies any package (library or
otherwise) that a specified block, subprogram, or package mentions in a use clause. If the
entity specified is a package (library or otherwise), the command also identifies any block,
subprogram, package, and so on, that names the specified module in a use clause. For
example:DBG> SHOW SYMBOL/USE_CLAUSE B_
package spec B_
used by: F
uses: A_If a label has been assigned to a loop statement or
declare block in the source code, the debugger displays the
label; otherwise, the debugger displays LOOP$
for a loop statement or nBLOCK$ for a declare
block, where nn is the line number at which the statement or block
begins.
D.3.13. Symbol Lookup Conventions
The debugger looks for the symbol within the block or routine surrounding the current PC value (where execution is currently paused).
- If the symbol is not found, the debugger then searches any package that is mentioned in a use clause. The debugger does not distinguish between a library package and a package whose declaration is in the same module as the current scope region. If the same symbol is declared in two or more packages that are visible, the symbol is not unique (according to Ada rules), and the debugger issues a message similar to the following:
%DEBUG-E-NOUNIQUE, symbol 'X' is not unique
If the symbol is still not found, the debugger searches the call stack and other scopes, as for other languages.
D.3.14. Setting Modules
When you or the debugger sets an Ada module, by default the debugger also sets any "related" module (that is, any module whose symbols should be visible within the module being set). Such modules are related to the one being set through either a with-clause or a subunit relationship.
If M1 is a library body, the debugger also sets the associated library specification, if any.
If M1 is a subunit, the debugger also sets its parent unit and, therefore, any parent of the parent.
If M1 mentions a library package P1 in a with clause, the debugger also sets P1's specification. Neither the body of P1 nor any possible subunits of P1 are set, because symbols declared within them should not be visible outside.
If P1's specification mentions a package P2 in a with clause, the debugger also sets P2's specification. Likewise, if P2's specification mentions a package P3 in a with clause, the debugger also sets P3's specification, and so on. The specifications of all such library packages are set so that you can access data components (for example, record components) that may have been declared in other packages.
If M1 mentions a library subprogram in a with clause, the debugger does not set the subprogram. Only the subprogram name needs to be visible in M1 (no declaration within a library subprogram should be visible outside the subprogram). Therefore, the debugger inserts the name of the library subprogram into the RST when M1 is set.
If debugger performance becomes a problem as more modules are set, use the SET
MODE NODYNAMIC command, which disables related module setting as well as dynamic
module setting. You must then set individual modules explicitly with the SET
MODULE command.
By default, the SET MODULE command sets related modules simultaneously
with the module specified in the command.
The SET MODULE/NORELATED command sets only the modules you specify
explicitly. However, if you use SET MODULE/NORELATED, you may find that a
symbol that is declared in another unit and that should be visible at the point of execution is
no longer visible or that a symbol which should be hidden by a redeclaration of that same symbol
is now visible.
The CANCEL MODULE/NORELATED command deletes from the RST only the
modules you specify explicitly. This command, which is the default, deletes related modules in a
manner consistent with the intent of Ada's scope and visibility rules. The exact effect depends
on module relationships.
The distinction between related and directly related for subunits is analogous to that for library packages.
D.3.14.1. Setting Modules for Package Bodies
Modules for package bodies are not automatically set by the debugger.
You may need to set the modules for library package bodies yourself so that you can debug the package body or debug subprograms declared in the corresponding package specification.
D.3.15. Resolving Overloaded Names and Symbols
%DEBUG-E-NOTUNQOVR, symbol 'ADD' is overloaded
use SHOW SYMBOL to find the unique symbol namesIf the overloaded symbol is an enumeration literal, you can use qualified expressions to resolve the overloadings.
If the overloaded symbol represents a subprogram or task accept statement, you can use the unique name generated by the compiler for the debugger. The compiler always generates unique names for subprograms declared in library package specifications, because the names might later be overloaded in the package body. Unique names are generated for task accept statements and subprograms declared in other places only if the task accept statements or subprograms are actually overloaded.
Overloaded task accept statement names and subprogram names are distinguished by a suffix consisting of two underscores followed by an integer that uniquely identifies the given symbol. You must use the unique naming notation in debugger commands to uniquely specify a subprogram whose name is overloaded. However, if there is no ambiguity, you do not need to use the unique name, even though one was generated.
D.3.16. CALL Command
With Ada programs, you can use the CALL command reliably only with a
subprogram that has been exported. An exported subprogram must be a library subprogram or must
be declared in the outermost declarative part of a library package.
The CALL command does not check whether or not the subprogram can be
exported, nor does it check the parameter-passing mechanisms that you specify. Note that you
cannot use the CALL command to modify the value of a parameter.
A CALL command may result in a deadlock if it is entered when the Ada
run-time library is executing. The run-time library routines acquire and release internal locks
that allow the routines to operate in a tasking environment. Deadlock can result if a subprogram
called from the CALL command requires a resource that has been locked by an
executing run-time library routine. To avoid this situation in a nontasking program, enter the
CALL command immediately before or after an Ada statement has been executed.
However, this approach is not sufficient to assure that deadlock will not occur in a tasking
program, as some other task may be executing a run-time library routine at the time of the call.
If you must use the CALL command in a tasking program, you can avoid deadlock
if the called subprogram does not do any tasking or input-output operations.
D.4. BASIC
The following subtopics describe debugger support for BASIC.
D.4.1. Operators in Language Expressions
|
Kind |
Symbol |
Function |
|---|---|---|
|
Prefix |
+ |
Unary plus |
|
Infix |
+ |
Addition, String concatenation |
|
Infix |
* |
Multiplication |
|
Infix |
/ |
Division |
|
Infix |
** |
Exponentiation |
|
Infix |
^ |
Exponentiation |
|
Infix |
= |
Equal to |
|
Infix |
<> |
Not equal to |
|
Infix |
> < |
Not equal to |
|
Infix |
> |
Greater than |
|
Infix |
>= |
Greater than or equal to |
|
Infix |
=> |
Greater than or equal to |
|
Infix |
< |
Less than |
|
Infix |
<= |
Less than or equal to |
|
Infix |
= < |
Less than or equal to |
|
Prefix |
NOT |
Bit-wise NOT |
|
Infix |
AND |
Bit-wise AND |
|
Infix |
OR |
Bit-wise OR |
|
Infix |
XOR |
Bit-wise exclusive OR |
|
Infix |
IMP |
Bit-wise implication |
|
Infix |
EQV |
Bit-wise equivalence |
D.4.2. Constructs in Language and Address Expressions
|
Symbol |
Construct |
|---|---|
|
( ) |
Subscripting |
|
:: |
Record component selection |
D.4.3. Data Types
|
BASIC Data Type |
Operating System Data Type Name |
|---|---|
|
BYTE |
Byte Integer (B) |
|
WORD |
Word Integer (W) |
|
LONG |
Longword Integer (L) |
|
SINGLE |
F_Floating (F) |
|
DOUBLE |
D_Floating (D) |
|
GFLOAT |
G_Floating (G) |
|
DECIMAL |
Packed Decimal (P) |
|
STRING |
ASCII Text (T) |
|
RFA |
(None) |
|
RECORD |
(None) |
|
Arrays |
(None) |
D.4.4. Compiling for Debugging
If you make changes to a program in the BASIC environment and attempt to compile the program
with the /DEBUG qualifier without first saving or replacing the program,
BASIC signals the error "Unsaved changes, no source line debugging available." To
avoid this problem, save or replace the program, and then recompile the program with the
/DEBUG qualifier.
D.4.5. Constants
BASIC constants of the form[ radix] "
numeric-string"[ type] (such as
"12.34"GFLOAT) or the form n% (such as 25% for integer 25) are
not supported in debugger expressions.
D.4.6. Evaluating Expressions
Expressions that overflow in the BASIC language do not necessarily overflow when evaluated by the debugger. The debugger tries to compute a numerically correct result, even when the BASIC rules call for overflows. This difference is particularly likely to affect DECIMAL computations.
D.4.7. Line Numbers
The sequential line numbers that you refer to in a debugging session and that are displayed in a source code display are those generated by the compiler. When a BASIC program includes or appends code from another file, the included lines of code are also numbered in sequence by the compiler.
D.4.8. Stepping into Routines
STEP/INTO command is useful for examining external functions. However,
if you use this command to stop execution at an internal subroutine or a DEF, the debugger
initially steps into run-time library (RTL) routines, providing you with no useful information.
In the following example, execution is paused at line 8, at a call to Print_routine:
…
-> 8 GOSUB Print_routine
9 STOP
…
20 Print_routine:
21 IF Competition = Done
22 THEN PRINT "The winning ticket is #";Winning_ticket
23 ELSE PRINT "The game goes on."
24 END IF
25 RETURNA STEP/INTO command would cause the debugger to step into the relevant RTL
code and would inform you that no source lines are available for display. On the other hand, a
STEP command alone would cause the debugger to proceed directly to source
line 9, past the call to Print_routine. To examine the source code of subroutines or DEF
functions, set a breakpoint on the routine label (for example, enter the SET BREAK
PRINT_ROUTINE command). You can then suspend execution exactly at the start of the
routine (line 20, in this example) and then step directly into the code.
D.4.9. Symbolic References
All variable and label names within a single BASIC program must be unique. Otherwise the debugger cannot resolve the symbol ambiguity.
D.5. BLISS
The following subtopics describe debugger support for BLISS.
D.5.1. Operators in Language Expressions
|
Kind |
Symbol |
Function |
|---|---|---|
|
Prefix |
. |
Indirection |
|
Prefix |
+ |
Unary plus |
|
Infix |
+ |
Addition |
|
Infix |
* |
Multiplication |
|
Infix |
/ |
Division |
|
Infix |
MOD |
Remainder |
|
Infix |
^ |
Left shift |
|
Infix |
EQL |
Equal to |
|
Infix |
EQLU |
Equal to |
|
Infix |
EQLA |
Equal to |
|
Infix |
NEQ |
Not equal to |
|
Infix |
NEQU |
Not equal to |
|
Infix |
NEQA |
Not equal to |
|
Infix |
GTR |
Greater than |
|
Infix |
GTRU |
Greater than unsigned |
|
Infix |
GTRA |
Greater than unsigned |
|
Infix |
GEQ |
Greater than or equal to |
|
Infix |
GEQU |
Greater than or equal to unsigned |
|
Infix |
GEQA |
Greater than or equal to unsigned |
|
Infix |
LSS |
Less than |
|
Infix |
LSSU |
Less than unsigned |
|
Infix |
LSSA |
Less than unsigned |
|
Infix |
LEQ |
Less than or equal to |
|
Infix |
LEQU |
Less than or equal to unsigned |
|
Infix |
LEQA |
Less than or equal to unsigned |
|
Prefix |
NOT |
Bit-wise NOT |
|
Infix |
AND |
Bit-wise AND |
|
Infix |
OR |
Bit-wise OR |
|
Infix |
XOR |
Bit-wise exclusive OR |
|
Infix |
EQV |
Bit-wise equivalence |
D.5.2. Constructs in Language and Address Expressions
|
Symbol |
Construct |
|---|---|
|
[ ] |
Subscripting |
|
[fldname] |
Field selection |
|
|
Bit field selection |
D.5.3. Data Types
|
BLISS Data Type |
Operating System Data Type Name |
|---|---|
|
BYTE |
Byte Integer (B) |
|
WORD |
Word Integer (W) |
|
LONG |
Longword Integer (L) |
|
QUAD (Alpha and Integrity servers-specific) |
Quadword (Q) |
|
BYTE UNSIGNED |
Byte Unsigned (BU) |
|
WORD UNSIGNED |
Word Unsigned (WU) |
|
LONG UNSIGNED |
Longword Unsigned (LU) |
|
QUAD UNSIGNED (Alpha and Integrity servers-specific) |
Quadword Unsigned (QU) |
|
VECTOR |
(None) |
|
BITVECTOR |
(None) |
|
BLOCK |
(None) |
|
BLOCKVECTOR |
(None) |
|
REF VECTOR |
(None) |
|
REF BITVECTOR |
(None) |
|
REF BLOCK |
(None) |
|
REF BLOCKVECTOR |
(None) |
D.6. C
The following subtopics describe debugger support for C.
D.6.1. Operators in Language Expressions
|
Kind |
Symbol |
Function |
|---|---|---|
|
Prefix |
* |
Indirection |
|
Prefix |
& |
Address of |
|
Prefix |
sizeof |
size of |
|
Infix |
+ |
Addition |
|
Infix |
* |
Multiplication |
|
Infix |
/ |
Division |
|
Infix |
% |
Remainder |
|
Infix |
< < |
Left shift |
|
Infix |
>> |
Right shift |
|
Infix |
== |
Equal to |
|
Infix |
!= |
Not equal to |
|
Infix |
> |
Greater than |
|
Infix |
>= |
Greater than or equal to |
|
Infix |
< |
Less than |
|
Infix |
<= |
Less than or equal to |
|
Prefix |
~ (tilde) |
Bit-wise NOT |
|
Infix |
& |
Bit-wise AND |
|
Infix |
| |
Bit-wise OR |
|
Infix |
^ |
Bit-wise exclusive OR |
|
Prefix |
! |
Logical NOT |
|
Infix |
& & |
Logical AND |
|
Infix |
| | |
Logical OR |
Because the exclamation point (!) is an operator in C, it cannot be used as the comment delimiter. When the language is set to C, the debugger instead accepts /* as the comment delimiter. The comment continues to the end of the current line. (A matching */ is neither needed nor recognized.) To permit debugger log files to be used as debugger input, the debugger still recognizes an exclamation point (!) as a comment delimiter if it is the first nonspace character on a line.
The debugger accepts the prefix asterisk (*) as an indirection operator in both C language expressions and debugger address expressions. In address expressions, prefix "*" is synonymous to prefix "." or "@" when the language is set to C.
The debugger does not support any of the assignment operators in C (or any other language) in
order to prevent unintended modifications to the program being debugged. Hence such operators as
=, +=, ++, and −− are not recognized. To alter the contents of a memory location, you must use
an explicit DEPOSIT
command.
D.6.2. Constructs in Language and Address Expressions
|
Symbol |
Construct |
|---|---|
|
[ ] |
Subscripting |
|
. (period) |
Structure component selection |
|
-> |
Pointer dereferencing |
D.6.3. Data Types
|
C Data Type |
Operating System Data Type Name |
|---|---|
|
__int64 (Alpha and Integrity servers specific) |
Quadword Integer (Q) |
|
unsigned __int64 (Alpha specific) |
Quadword Unsigned (QU) |
|
__int32 (Alpha and Integrity servers specific) |
Longword Integer (L) |
|
unsigned __int32 (Alpha and Integrity servers specific) |
Longword Unsigned (LU) |
|
int |
Longword Integer (L) |
|
unsigned int |
Longword Unsigned (LU) |
|
__int16 (Alpha and Integrity servers specific) |
Word Integer (W) |
|
unsigned __int16 (Alpha and Integrity servers specific) |
Word Unsigned (WU) |
|
short int |
Word Integer (W) |
|
unsigned short int |
Word Unsigned (WU) |
|
char |
Byte Integer (B) |
|
unsigned char |
Byte Unsigned (BU) |
|
float |
F_Floating (F) |
|
__f_float (Alpha and Integrity servers specific) |
F_Floating (F) |
|
double |
D_Floating (D) |
|
double |
G_Floating (G) |
|
__g_float (Alpha and Integrity servers specific) |
G_Floating (G) |
|
float (Alpha and Integrity servers specific) |
IEEE S_Floating (FS) |
|
__s_float (Alpha and Integrity servers specific) |
IEEE S_Floating (FS) |
|
double (Alpha and Integrity servers specific) |
IEEE T_Floating (FT) |
|
__t_float (Alpha and Integrity servers specific) |
IEEE T_Floating (FT) |
|
enum |
(None) |
|
struct |
(None) |
|
union |
(None) |
|
Pointer Type |
(None) |
|
Array Type |
(None) |
Floating-point numbers of type float may be represented by F_Floating or IEEE S_Floating, depending on compiler switches.
Floating-point numbers of type double may be represented by IEEE T_Floating, D_Floating, or G_Floating, depending on compiler switches.
D.6.4. Case Sensitivity
Symbol names are case sensitive for language C, meaning that uppercase and lowercase letters are treated as different characters.
D.6.5. Static and Nonstatic Variables
Variables of the following storage classes are allocated statically:static, globaldef, globalref, and extern.
Variables of the following storage classes are allocated nonstatically (on the stack or in registers): auto and register. Such variables can be accessed only when their defining routine is active (on the call stack).
D.6.6. Scalar Variables
You can specify scalar variables of any C type in debugger commands exactly as you would specify them in the source code of the program.
The following paragraphs provide additional information about char variables and pointers.
/ASCII qualifier:
DBG> EXAMINE/ASCII ch
SCALARS\main\ch: "A"/ASCII qualifier when depositing into a char
variable, to translate the byte integer into its ASCII equivalent. For
example:DBG>DEPOSIT/ASCII ch = 'z'DBG>EXAMINE/ASCII chSCALARS\main\ch: "z"
EXAMINE command.
Assume the following declarations and assignments:
static long li = 790374270; static int *ptr = &li;
DBG> EXAMINE *ptr
*SCALARS\main\ptr: 790374270D.6.7. Arrays
The debugger handles C arrays as for most other languages. That is, you can examine an entire array aggregate, a slice of an array, or an individual array element, using array syntax (for example EXAMINE arr[3]). And you can deposit into only one array element at a time.
D.6.8. Character Strings
Character strings are implemented in C as null-terminated ASCII strings (ASCIZ strings). To
examine and deposit data in an entire string, use the /ASCIZ (or
/AZ) qualifier so that the debugger can interpret the end of the string
properly. You can examine and deposit individual characters in the string using the C array
subscripting operators ([ ]). When you examine and deposit individual
characters, use the /ASCII qualifier.
static char *s = "vaxie";static char **t = &s;
EXAMINE/AZ command displays the contents of the character string
pointed to by *s and * *t:
DBG>EXAMINE/AZ *s*STRING\main\s: "vaxie" DBG>EXAMINE/AZ **t**STRING\main\t: "vaxie"
DEPOSIT/AZ command deposits a new ASCIZ string in the variable pointed
to by *s. The EXAMINE/AZ command displays the new contents
of the
string:DBG>DEPOSIT/AZ *s = "DEC C"DBG>EXAMINE/AZ *s, **t*STRING\main\s: "DEC C"**STRING\main\t: "DEC C"
/ASCII qualifier. A subsequent EXAMINE/AZ
command shows the entire string containing the deposited
value:DBG>EXAMINE/ASCII s[3][3]: " " DBG>DEPOSIT/ASCII s[3] = "-"DBG>EXAMINE/AZ *s, **t*STRING\main\s: "VAX-C" **STRING\main\t: "VAX-C"
D.6.9. Structures and Unions
You can examine structures in their entirety or on a member-by-member basis, and deposit data into structures one member at a time.
To reference members of a structure or union, use the usual C syntax for such references. That
is, if variable p is a pointer to a structure, you can reference member
y of that structure with the expression p ->y. If
variable x refers to the base of the storage allocated for a structure, you
can refer to a member of that structure with the x.y expression.
x.y, y need not be a member of
x; it is treated as an offset with a type. When such a reference is
ambiguous - when there is more than one structure with a member y - the
debugger attempts to resolve the reference according to the following rules. The same rules for
resolving the ambiguity of a reference to a member of a structure or union apply to both
x.y and p ->y.If only one of the members,
y, belongs in the structure or union,x, that is the one that is referenced.If only one of the members,
y, is in the same scope asx, then that is the one that is referenced.
You can always give a path name with the reference tox to narrow the scope
that is used and to resolve the ambiguity. The same pathname is used to look up both
x and y.
D.7. C++ Version 5.5 and Later (Alpha and Integrity servers Only)
On Alpha and Integrity server systems, the OpenVMS debugger provides enhanced support for debugging C++ modules compiled with the Version 5.5 compiler or later (Alpha and Integrity servers only).
- C++ names and expressions, including:
Explicit and implicit
thispointer to refer to class membersScope resolution operator (::)
Member access operators: period (.) and right arrow (->)
Template instantiations
Template names
- Setting breakpoints in:
Member functions, including static and virtual functions
Overloaded functions
Constructors and destructors
Template instantiations
Operators
Calling functions, including overloaded functions
Debugging programs containing a mixture of C++ code and code in other languages
The following subtopics describe debugger support for C++.
D.7.1. Operators in Language Expressions
|
Kind |
Symbol |
Function |
|---|---|---|
|
Prefix |
* |
Indirection |
|
Prefix |
& |
Address of |
|
Prefix |
sizeof |
size of |
|
Prefix |
-- |
Unary minus (negation) |
|
Infix |
+ |
Addition |
|
Infix |
-- |
Subtraction |
|
Infix |
* |
Multiplication |
|
Infix |
/ |
Division |
|
Infix |
% |
Remainder |
|
Infix |
< < |
Left shift |
|
Infix |
>> |
Right shift |
|
Infix |
== |
Equal to |
|
Infix |
!= |
Not equal to |
|
Infix |
> |
Greater than |
|
Infix |
>= |
Greater than or equal to |
|
Infix |
< |
Less than |
|
Infix |
<= |
Less than or equal to |
|
Prefix |
~ (tilde) |
Bit-wise NOT |
|
Infix |
& |
Bit-wise AND |
|
Infix |
| |
Bit-wise OR |
|
Infix |
^ |
Bit-wise exclusive OR |
|
Prefix |
! |
Logical NOT |
|
Infix |
& & |
Logical AND |
|
Infix |
| | |
Logical OR |
Because the exclamation point (!) is an operator, it cannot be used in C++ programs as a comment delimiter. However, to permit debugger log files to be used as debugger input, the debugger interprets ! as a comment delimiter when it is the first nonspace character on a line. In C++ language mode, the debugger also interprets /* or // as preceding a comment that continues to the end of the current line.
The debugger accepts the asterisk (*) prefix as an indirection operator in
both C++ language expressions and debugger address expressions. In address expressions, the
* prefix is synonymous with either the period (.) prefix or
at sign (@) prefix when the debugger is in C++ language mode.
To prevent unintended modifications to the program being debugged, the debugger does not
support any of the assignment operators in C++ (or any other language). Thus, such operators as
=, +=, --=, ++, and −− are not recognized in debugger commands. To alter the contents of a memory
location, you must use the debugger DEPOSIT command.
D.7.2. Constructs in Language and Address Expressions
|
Symbol |
Construct |
|---|---|
|
[ ] |
Subscripting |
|
. (period) |
Structure component selection |
|
-> |
Pointer dereferencing |
|
:: |
Scope resolution |
D.7.3. Data Types
|
C++ Data Type |
Operating System Data Type Name |
|---|---|
|
__int64 (Alpha and Integrity servers) |
Quadword Integer (Q) |
|
unsigned __int64 (Alpha and Integrity servers) |
Quadword Unsigned (QU) |
|
__int32 (Alpha and Integrity servers) |
Longword Integer (L) |
|
unsigned __int32 (Alpha and Integrity servers) |
Longword Unsigned (LU) |
|
int |
Longword Integer (L) |
|
unsigned int |
Longword Unsigned (LU) |
|
__int16 (Alpha and Integrity servers) |
Word Integer (W) |
|
unsigned __int16 (Alpha and Integrity servers) |
Word Unsigned (WU) |
|
short int |
Word Integer (W) |
|
unsigned short int |
Word Unsigned (WU) |
|
char |
Byte Integer (B) |
|
unsigned char |
Byte Unsigned (BU) |
|
float |
F_Floating (F) |
|
__f_float (Alpha and Integrity servers) |
F_Floating (F) |
|
double |
D_Floating (D) |
|
double |
G_Floating (G) |
|
__g_float (Alpha and Integrity servers) |
G_Floating (G) |
|
float (Alpha and Integrity servers) |
IEEE S_Floating (FS) |
|
__s_float (Alpha and Integrity servers) |
IEEE S_Floating (FS) |
|
double (Alpha and Integrity servers) |
IEEE T_Floating (FT) |
|
__t_float (Alpha and Integrity servers) |
IEEE T_Floating (FT) |
|
enum |
(None) |
|
struct |
(None) |
|
class |
(None) |
|
union |
(None) |
|
Pointer Type |
(None) |
|
Array Type |
(None) |
Floating-point numbers of type float may be represented by F_Floating or IEEE S_Floating, depending on compiler switches.
Floating-point numbers of type double may be represented by IEEE T_Floating, D_Floating, or G_Floating, depending on compiler switches.
D.7.4. Case Sensitivity
Symbol names are case sensitive in C++. This means that uppercase and lowercase letters are treated as different characters.
D.7.5. Displaying Information About a Class
Use the command SHOW SYMBOL to display static information about a
class declaration. Use the command EXAMINE to view dynamic information about
class objects (see Section D.7.6, ''Displaying Information About an Object'').
SHOW SYMBOL/FULL displays the class type declaration,
including: - Data members (including static data members)
- Member functions (including static member functions)
- Constructors and destructors
- Base classes and derived classes
dbg> SHOW SYMBOL /TYPE C
type C
struct (C, 13 components), size: 40 bytes
overloaded name C
instance C::C(void)
instance C::C(const C &)
dbg> SHOW SYMBOL /FULL C
type C
struct (C, 13 components), size: 40 bytes
inherits: B1, size: 24 bytes, offset: 0 bytes
B2, size: 24 bytes, offset: 12 bytes
contains the following members:
overloaded name C::g
instance C::g(int)
instance C::g(long)
instance C::g(char)
j : longword integer, size: 4 bytes, offset: 24 bytes
s : longword integer, size: 4 bytes, address: # [static]
overloaded name C
int ==(C &)
C & =(const C &)
void h(void) [virtual]
~C(void)
__vptr : typed pointer type, size: 4 bytes, offset: 4 bytes
__bptr : typed pointer type, size: 4 bytes, offset: 8 bytes
structure has been padded, size: 4 bytes, offset: 36 bytes
overloaded name C
instance C::C(void)
instance C::C(const C &)
DBG> SHOW SYMBOL/FULL does not display members of base classes or
derived classes. Use the commands SHOW SYMBOL/FULL base_class_name and
SHOW SYMBOL/FULL derived_class_name to display information about members of
those classes. For
example:DBG> SHOW SYMBOL /FULL B1
type B1
struct (B1, 8 components), size: 24 bytes
inherits: virtual A
is inherited by: C
contains the following members:
i : longword integer, size: 4 bytes, offset: 0 bytes
overloaded name B1
void f(void)
B1 & =(const B1 &)
void h(void) [virtual]
__vptr : typed pointer type, size: 4 bytes, offset: 4 bytes
__bptr : typed pointer type, size: 4 bytes, offset: 8 bytes
structure has been padded, size: 12 bytes, offset: 12 bytes
overloaded name B1
instance B1::B1(void)
instance B1::B1(const B1 &)
DBG>SHOW SYMBOL/FULL class_member_name to display information
about class members. For
example:DBG> SHOW SYMBOL /FULL j
record component C::j
address: offset 24 bytes from beginning of record
atomic type, longword integer, size: 4 bytes
record component A::j
address: offset 4 bytes from beginning of record
atomic type, longword integer, size: 4 bytes
DBG> Use the SHOW SYMBOL/FULL command to display detailed information about an
object.
SHOW SYMBOL does not currently support qualified names. For
example, the following commands are not currently supported:
SHOW SYMBOL object_name.function_name SHOW SYMBOL class_name::member_name
D.7.6. Displaying Information About an Object
EXAMINE to display the current value of an
object.
For
example:
DBG> EXAMINE a
CXXDOCEXAMPLE\main\a: struct A
i: 0
j: 1
__vptr: 131168
DBG> EXAMINE
command. For example:
DBG> EXAMINE ptr
CXXDOCEXAMPLE\main\ptr: 40
DBG> EXAMINE *ptr
*CXXDOCEXAMPLE\main\ptr: struct A
i: 0
j: 1
__vptr: 131168
DBG> EXAMINE a.i
CXXDOCEXAMPLE\main\a.i: 0
DBG> EXAMINE ptr->i
CXXDOCEXAMPLE\main\ptr->i: 0
DBG> DBG> EXAMINE c
CXXDOCEXAMPLE\main\c: struct C
inherit B1
inherit virtual A
i: 8
j: 9
__vptr: 131200
i: 10
__vptr: 131232
__bptr: 131104
inherit B2
inherit virtual A (already printed, see above)
i: 11
__vptr: 131280
__bptr: 131152
j: 12
__vptr: 131232
__bptr: 131104
DBG> DBG> EXAMINE c.j CXXDOCEXAMPLE\main\c.j: 12 DBG> EXAMINE c.A::j CXXDOCEXAMPLE\main\c.A::j: 9 DBG> EXAMINE x CXXDOCEXAMPLE\main\x: 101 DBG> EXAMINE ::x CXXDOCEXAMPLE\x: 13 DBG>
DBG> EXAMINE c.i
%DEBUG-I-AMBIGUOUS, 'i' is ambiguous, matching the following
CXXDOCEXAMPLE\main\c.B1::i
CXXDOCEXAMPLE\main\c.B2::i
%DEBUG-E-REENTER, reenter the command using a more precise pathname
DBG> EXAMINE c.B1::i
CXXDOCEXAMPLE\main\c.B1::i: 10
DBG> DBG> EXAMINE c.s CXXDOCEXAMPLE\main\c.s: 42 DBG> EXAMINE C::s C::s: 42 DBG>
Use the SHOW SYMBOL/FULL to display the class type of an object (see Section D.7.5, ''Displaying Information About a Class'').
D.7.7. Setting Watchpoints
DBG> SET WATCH c
%DEBUG-I-WPTTRACE, non-static watchpoint, tracing every instruction
DBG> GO
watch of CXXDOCEXAMPLE\main\c.i at CXXDOCEXAMPLE\main\%LINE 50+8
50: c.B2::i++;
old value: 11
new value: 12
break at CXXDOCEXAMPLE\main\%LINE 51
51: c.s++;
DBG> SET WATCH c.s
DBG> GO
watch of CXXDOCEXAMPLE\main\c.s at CXXDOCEXAMPLE\main\%LINE 51+16
51: c.s++;
old value: 43
new value: 44
break at CXXDOCEXAMPLE\main\%LINE 53
53: b1.f();
DBG> D.7.8. Debugging Functions
DBG> EXAMINE /SOURCE b1.f
module CXXDOCEXAMPLE
14: void f() {}
DBG> SET BREAK B1::f
DBG> GO
break at routine B1::f
14: void f() {}
DBG> this pointer. For
example:
DBG> EXAMINE this
B1::f::this: 16
DBG> EXAMINE *this*
B1::f::this: struct B1
inherit virtual A
i: 2
j: 3
__vptr: 131184
i: 4
__vptr: 131248
__bptr: 131120
DBG> EXAMINE this->i
B1::f::this->i: 4
DBG> EXAMINE this->j
B1::f::this->A::j: 3
DBG>EXAMINE i
B1::f::this->i: 4
DBG> EXAMINE j
B1::f::this->A::j: 3
DBG> DBG> EXAMINE /SOURCE %LINE 53
module CXXDOCEXAMPLE
53: b1.f();
DBG> SET BREAK this->h
DBG> SHOW BREAK
breakpoint at routine B1::f
breakpoint at routine B1::h
!!!! We are at the call to B1::f made at 'c.B1::f()'.
!! Here this->h matches C::h.
!!
DBG> GO
break at routine B1::f
14: void f() {}
DBG> EXAMINE /SOURCE %LINE 54
module CXXDOCEXAMPLE
54: c.B1::f();
DBG> SET BREAK this->h
DBG> SHOW BREAK
breakpoint at routine B1::f
breakpoint at routine B1::h
breakpoint at routine C::h
!!
!! Handling overloaded functions
!!
DBG> show symbol/full g
overloaded name C::g
routine C::g(char)
type signature: void g(char)
address: 132224, size: 128 bytes
routine C::g(long)
type signature: void g(long)
address: 132480, size: 96 bytes
DBG> SET BREAK g
%DEBUG-I-NOTUNQOVR, symbol 'g' is overloaded
overloaded name C::g
instance C::g(int)
instance C::g(long)
instance C::g(char)
%DEBUG-E-REENTER, reenter the command using a more precise pathname
DBG> SET BREAK g(int)
DBG> CANCEL BREAK/ALL
DBG> DBG> SET BREAK g
%DEBUG-I-NOTUNQOVR, symbol 'g' is overloaded
overloaded name C::g
instance void g(int)
instance void g(long)
instance void g(char *)
%DEBUG-E-REENTER, reenter the command using a more precise pathname
DBG> SET BREAK g(int)
DBG> Note
The means of displaying and specifying overloaded functions is different than in the OpenVMS Debugger Version 7.1C.
DBG> SET BREAK C
%DEBUG-I-NOTUNQOVR, symbol 'C' is overloaded
overloaded name C
instance C::C(void)
instance C::C(const C &)
%DEBUG-E-REENTER, reenter the command using a more precise pathname
DBG> SHOW SYMBOL /FULL ~C
routine C::~C
type signature: ~C(void)
code address: #, size: 152 bytes
procedure descriptor address: #
DBG> SET BREAK ~C
DBG> SET BREAK %NAME'=='
%DEBUG-W-UNALLOCATED, '==' is not allocated in memory (optimized away)
%DEBUG-E-CMDFAILED, the SET BREAK command has failed
DBG> SHOW SYMBOL /FULL ==,
routine c::operator==, type
signature: bool operator==�
code address: 198716, size:40 bytes,
procedure descriptor address: 65752
DBG> SET BREAK operator==
DBG> SHOW SYMBOL /FULL ==
routine C::==
type signature: int ==(C &)
address: unallocated
DBG> SHOW BREAK
breakpoint at routine C::~C
DBG>
DBG> examine C::~C
C::~C: alloc r35 = ar.pfs, 3F, 01, 00
DBG>
DBG> ex/source ~C
module CXXDOCEXAMPLE
37: ~C() {}D.7.9. Limitations on Debugger Support for C++
You cannot specify a template by name in a debugger command. You must use the name of the instantiation of the template.
In C++, expressions in the instantiated template name can be full constant expressions, such as stack <double, f*10>. This form is not yet supported in the debugger; you must enter the value of the expression (for example, if f is 10 in the stack example, you must enter 100).
int x = 0;
struct A
{
int i,j;
void f() {}
virtual void h() {};
A() { i=x++; j=x++; }
};
struct B1 : virtual A
{
int i;
void f() {}
virtual void h() {} B1() { i=x++; } };
struct B2 : virtual A
{
int i;
void f() {}
virtual void h() {}
B2() { i=x++; }
};
struct C : B1, B2
{
int j;
static int s;
void g( int ) {}
void g( long ) {}
void g( char ) {}
void h() {}
operator ==( C& ) { return 0; }
C() { j=x++; }
~C() {}
};
int C::s = 42;
main()
{
A a; B1 b1; B2 b2; C c;
A *ptr = &a;
int x = 101;
x++;
c.s++;
c.B2::i++;
c.s++;
b1.f();
c.B1::f();
c.g(1);
c.g( (long) 1 );
c.g( 'a' );
}DBG> GO
break at routine CXXDOCEXAMPLE\main
44: A a; B1 b1; B2 b2; C c;
DBG> STEP
stepped to CXXDOCEXAMPLE\main\%LINE 45
45: A *ptr = &a;
DBG> STEP
stepped to CXXDOCEXAMPLE\main\%LINE 46
46: int x = 101;
DBG> STEP
stepped to CXXDOCEXAMPLE\main\%LINE 47
47: x++;
!!
!! Displaying class information
!!
DBG> SHOW SYMBOL /TYPE C
type C
struct (C, 13 components), size: 40 bytes
overloaded name C
instance C::C(void)
instance C::C(const C &)
DBG> SHOW SYMBOL /FULL C
type C
struct (C, 13 components), size: 40 bytes
inherits: B1, size: 24 bytes, offset: 0 bytes
B2, size: 24 bytes, offset: 12 bytes
contains the following members:
overloaded name C::g
instance C::g(int)
instance C::g(long)
instance C::g(char)
j : longword integer, size: 4 bytes, offset: 24 bytes
s : longword integer, size: 4 bytes, address: # [static]
overloaded name C
int ==(C &)
C & =(const C &)
void h(void) [virtual]
~C(void)
__vptr : typed pointer type, size: 4 bytes, offset: 4 bytes
__bptr : typed pointer type, size: 4 bytes, offset: 8 bytes
structure has been padded, size: 4 bytes, offset: 36 bytes
overloaded name C
instance C::C(void)
instance C::C(const C &)
!!
!! Displaying information about base classes!!
DBG> SHOW SYMBOL /FULL B1
type B1
struct (B1, 8 components), size: 24 bytes
inherits: virtual A
is inherited by: C
contains the following members:
i : longword integer, size: 4 bytes, offset: 0 bytes
overloaded name B1
void f(void)
B1 & =(const B1 &)
void h(void) [virtual]
__vptr : typed pointer type, size: 4 bytes, offset: 4 bytes
__bptr : typed pointer type, size: 4 bytes, offset: 8 bytes
structure has been padded, size: 12 bytes, offset: 12 bytes
overloaded name B1
instance B1::B1(void)
instance B1::B1(const B1 &)
!!
!! Displaying class member information
!!
DBG> SHOW SYMBOL /FULL j
record component C::j
address: offset 24 bytes from beginning of record
atomic type, longword integer, size: 4 bytes
record component A::j
address: offset 4 bytes from beginning of record
atomic type, longword integer, size: 4 bytes
!!
!! Simple object display
!!
DBG> EXAMINE a
CXXDOCEXAMPLE\main\a: struct A
i: 0
j: 1
__vptr: 131168
!!
!! Using *, -> and . to access objects and members
!!
DBG> EXAMINE ptr
CXXDOCEXAMPLE\main\ptr: 40
DBG> EXAMINE *ptr
*CXXDOCEXAMPLE\main\ptr: struct A
i: 0
j: 1
__vptr: 131168
DBG> EXAMINE a.i
CXXDOCEXAMPLE\main\a.i: 0
DBG> EXAMINE ptr->i
CXXDOCEXAMPLE\main\ptr->i: 0
!!
!! Complicated object example
!!
DBG> EXAMINE c
CXXDOCEXAMPLE\main\c: struct C
inherit B1
inherit virtual A
i: 8
j: 9
__vptr: 131200
i: 10
__vptr: 131232
__bptr: 131104
inherit B2
inherit virtual A (already printed, see above)
i: 11
__vptr: 131280
__bptr: 131152
j: 12
__vptr: 131232
__bptr: 131104
!!
!! The debugger using C++ symbol lookup rules (to match c.j)
!! and then the use of :: to specify a particular member named j.
!!
DBG> EXAMINE c.j
CXXDOCEXAMPLE\main\c.j: 12
DBG> EXAMINE c.A::j
CXXDOCEXAMPLE\main\c.A::j: 9
!!
!! Using the global scope resolution operator.
!!
DBG> EXAMINE x
CXXDOCEXAMPLE\main\x: 101
DBG> EXAMINE ::x
CXXDOCEXAMPLE\x: 13
!!
!! Handling ambiguous member references.
!!
DBG> EXAMINE c.i
%DEBUG-I-AMBIGUOUS, 'i' is ambiguous, matching the following
CXXDOCEXAMPLE\main\c.B1::i
CXXDOCEXAMPLE\main\c.B2::i
%DEBUG-E-REENTER, reenter the command using a more precise pathname
DBG> EXAMINE c.B1::i
CXXDOCEXAMPLE\main\c.B1::i: 10
!!
!! Refering to static data members: with . and with ::
!!
DBG> EXAMINE c.s
CXXDOCEXAMPLE\main\c.s: 42
DBG> EXAMINE C::sC::s: 42
!!
!! Setting watchpoints on objects. All non-static data members
!! are watched (including those in base classes). Static data
!! members are not watched. Of course watchpoints on static data
!! members can be set explicitly.
!!
DBG> SET WATCH c
%DEBUG-I-WPTTRACE, non-static watchpoint, tracing every instruction
DBG> GO
watch of CXXDOCEXAMPLE\main\c.i at CXXDOCEXAMPLE\main\%LINE 50+8
50: c.B2::i++;
old value: 11
new value: 12
break at CXXDOCEXAMPLE\main\%LINE 51
51: c.s++;
DBG> SET WATCH c.s
DBG> GO
watch of CXXDOCEXAMPLE\main\c.s at CXXDOCEXAMPLE\main\%LINE 51+16
51: c.s++;
old value: 43
new value: 44
break at CXXDOCEXAMPLE\main\%LINE 53
53: b1.f();
!!
!! Basic member lookup applies to functions.
!!
DBG> EXAMINE /SOURCE b1.f
module CXXDOCEXAMPLE
14: void f() {}
DBG> SET BREAK B1::f
DBG> GO
break at routine B1::f
14: void f() {}
!!
!! Support for 'this'.
!!
DBG> EXAMINE this
B1::f::this: 16
DBG> EXAMINE *this
*B1::f::this: struct B1
inherit virtual A
i: 2
j: 3
__vptr: 131184
i: 4
__vptr: 131248
__bptr: 131120
DBG> EXAMINE this->i
B1::f::this->i: 4
DBG> EXAMINE this->j
B1::f::this->A::j: 3
DBG>EXAMINE i
B1::f::this->i: 4
DBG> EXAMINE j
B1::f::this->A::j: 3
!!
!! Support for virtual functions.
!!
!! We are at the call to B1::f made at 'b1.f()'.
!! Here this->h matches B1::h.
!!
DBG> EXAMINE /SOURCE %LINE 53
module CXXDOCEXAMPLE
53: b1.f();
DBG> SET BREAK this->h
DBG> SHOW BREAK
breakpoint at routine B1::f
breakpoint at routine B1::h
!!
!! We are at the call to B1::f made at 'c.B1::f()'.
!! Here this->h matches C::h.
!!
DBG> GO
break at routine B1::f
14: void f() {}
DBG> EXAMINE /SOURCE %LINE 54
module CXXDOCEXAMPLE
54: c.B1::f();
DBG> SET BREAK this->h
DBG> SHOW BREAK
breakpoint at routine B1::f
breakpoint at routine B1::h
breakpoint at routine C::h
!!
!! Handling overloaded functions
!!
DBG> SET BREAK g
%DEBUG-I-NOTUNQOVR, symbol 'g' is overloaded
overloaded name C::g
instance C::g(int)
instance C::g(long)
instance C::g(char)
%DEBUG-E-REENTER, reenter the command using a more precise pathname
DBG> SET BREAK g(int)
DBG> CANCEL BREAK/ALL
!!
!! Working with constructors, destructors, and operators.
!!
DBG> SET BREAK C
%DEBUG-I-NOTUNQOVR, symbol 'C' is overloaded
overloaded name C
instance C::C(void)
instance C::C(const C &)
%DEBUG-E-REENTER, reenter the command using a more precise pathname
DBG> SHOW SYMBOL /FULL ~C
routine C::~C
type signature: ~C(void)
code address: #, size: 152 bytes
procedure descriptor address: #
DBG> SET BREAK %NAME'~C'
DBG> SET BREAK %NAME'=='
%DEBUG-W-UNALLOCATED, '==' is not allocated in memory (optimized away)
%DEBUG-E-CMDFAILED, the SET BREAK command has failed
DBG> SHOW SYMBOL /FULL ==
routine C::==
type signature: int ==(C &)
address: unallocated
DBG> SHOW BREAK
breakpoint at routine C::~C
DBG> EXITD.8. COBOL
The following subtopics describe debugger support for COBOL.
D.8.1. Operators in Language Expressions
|
Kind |
Symbol |
Function |
|---|---|---|
|
Prefix |
+ |
Unary plus |
|
Infix |
+ |
Addition |
|
Infix |
* |
Multiplication |
|
Infix |
/ |
Division |
|
Infix |
= |
Equal to |
|
Infix |
NOT = |
Not equal to |
|
Infix |
> |
Greater than |
|
Infix |
NOT < |
Greater than or equal to |
|
Infix |
< |
Less than |
|
Infix |
NOT > |
Less than or equal to |
|
Infix |
NOT |
Logical NOT |
|
Infix |
AND |
Logical AND |
|
Infix |
OR |
Logical OR |
D.8.2. Constructs in Language and Address Expressions
|
Symbol |
Construct |
|---|---|
|
( ) |
Subscripting |
|
OF |
Record component selection |
|
IN |
Record component selection |
D.8.3. Data Types
|
COBOL Data Type |
Operating System Data Type Name |
|---|---|
|
COMP |
Longword Integer (L, LU) |
|
COMP |
Word Integer (W, WU) |
|
COMP |
Quadword Integer (Q, QU) |
|
COMP-1 |
F_Floating (F) |
|
COMP-1 (Alpha and Integrity servers specific) |
S_Floating (FS) |
|
COMP-2 |
D_Floating (D) |
|
COMP-2 (Alpha and Integrity servers specific) |
T_Floating (FT) |
|
COMP-3 |
Packed Decimal (P) |
|
INDEX |
Longword Integer (L) |
|
Alphanumeric |
ASCII Text (T) |
|
Records |
(None) |
|
Numeric Unsigned |
Numeric string, unsigned (NU) |
|
Leading Separate Sign |
Numeric string, left separate sign (NL) |
|
Leading Overpunched Sign |
Numeric string, left overpunched sign (NLO) |
|
Trailing Separate Sign |
Numeric string, right separate sign (NR) |
|
Trailing Overpunched Sign |
Numeric string, right overpunched sign (NRO) |
Floating-point numbers of type COMP-1 may be represented by F_Floating or IEEE S_Floating, depending on compiler switches.
Floating-point numbers of type COMP-2 may be represented by D_Floating or IEEE T_Floating, depending on compiler switches.
D.8.4. Source Display
The debugger can show source text included in a program with the COPY, COPY REPLACING, or REPLACE statement. However, when COPY REPLACING or REPLACE is used, the debugger shows the original source text instead of the modified source text generated by the COPY REPLACING or REPLACE statement.
The debugger cannot show the original source lines associated with the code for a REPORT section. You can see the DATA SECTION source lines associated with a REPORT, but no source lines are associated with the compiled code that generates the report.
D.8.5. COBOL INITIALIZE Statement and Arrays (Alpha Only)
On OpenVMS Alpha systems, the debugger can take an unusually great amount of time and
resources if you use the STEP command to execute an INITIALIZE statement in a
COBOL program when a large table (array) is being initialized.
To work around this problem, set a breakpoint on the first executable line past the INITIALIZE statement, rather than stepping across the INITIALIZE statement.
D.9. Fortran
The following subtopics describe debugger support for Fortran.
D.9.1. Operators in Language Expressions
|
Kind |
Symbol |
Function |
|---|---|---|
|
Prefix |
+ |
Unary plus |
|
Infix |
+ |
Addition |
|
Infix |
* |
Multiplication |
|
Infix |
/ |
Division |
|
Infix |
// |
Concatenation |
|
Infix |
.EQ. |
Equal to |
|
Infix |
== |
Equal to |
|
Infix |
.NE. |
Not equal to |
|
Infix |
/= |
Not equal to |
|
Infix |
.GT. |
Greater than |
|
Infix |
> |
Greater than |
|
Infix |
.GE. |
Greater than or equal to |
|
Infix |
>= |
Greater than or equal to |
|
Infix |
.LT. |
Less than |
|
Infix |
< |
Less than |
|
Infix |
.LE. |
Less than or equal to |
|
Infix |
<= |
Less than or equal to |
|
Prefix |
.NOT. |
Logical NOT |
|
Infix |
.AND. |
Logical AND |
|
Infix |
.OR. |
Logical OR |
|
Infix |
.XOR. |
Exclusive OR |
|
Infix |
.EQV. |
Equivalence |
|
Infix |
.NEQV. |
Exclusive OR |
D.9.2. Constructs in Language and Address Expressions
|
Symbol |
Construct |
|---|---|
|
( ) |
Subscripting |
|
. (period) |
Record component selection |
|
% (percent sign) |
Record component selection |
D.9.3. Predefined Symbols
|
Symbol |
Description |
|---|---|
|
.TRUE. |
Logical True |
|
.FALSE. |
Logical False |
D.9.4. Data Types
|
Fortran Data Type |
Operating System Data Type Name |
|---|---|
|
LOGICAL*1 |
Byte Unsigned (BU) |
|
LOGICAL*2 |
Word Unsigned (WU) |
|
LOGICAL*4 |
Longword Unsigned (LU) |
|
LOGICAL*8 (Alpha and Integrity servers specific) |
Quadword Unsigned (QU) |
|
BYTE |
Byte (B) |
|
INTEGER*1 |
Byte Integer (B) |
|
INTEGER*2 |
Word Integer (W) |
|
INTEGER*4 |
Longword Integer (L) |
|
INTEGER*8 (Alpha and Integrity servers specific) |
Quadword Integer (Q) |
|
REAL*4 |
F_Floating (F) |
|
REAL*4 (Alpha and Integrity servers specific) |
IEEE S_Floating (FS) |
|
REAL*8 |
D_Floating (D) |
|
REAL*8 |
G_Floating (G) |
|
REAL*8 (Alpha and Integrity servers specific) |
IEEE T_Floating (FT) |
|
REAL*16 (Alpha and Integrity servers specific) |
H_Floating (H) |
|
COMPLEX*8 |
F_Complex (FC) |
|
COMPLEX*8 (Alpha and Integrity servers specific) |
IEEE S_Floating (SC) |
|
COMPLEX*16 |
D_Complex (DC) |
|
COMPLEX*16 |
G_Complex (GC) |
|
COMPLEX*16 (Alpha and Integrity servers specific) |
IEEE T_Floating (TC) |
|
CHARACTER |
ASCII Text (T) |
|
Arrays |
(None) |
|
Records |
(None) |
Even though the data type codes for unsigned integers (BU, WU, LU, QU) are used internally to describe the LOGICAL data types, the debugger (like the compiler) treats LOGICAL variables and values as being signed when they are used in language expressions.
The debugger prints the numeric values of LOGICAL variables or expressions instead of .TRUE. or .FALSE. Normally, only the low-order bit of a LOGICAL variable or value is significant (0 is .FALSE. and 1 is .TRUE.). However, Fortran does allow all bits in a LOGICAL value to be manipulated and LOGICAL values can be used in integer expressions. For this reason, it is at times necessary to see the entire integer value of a LOGICAL variable or expression, and that is what the debugger shows.
COMPLEX constants such as (1.0, 2.0) are not supported in debugger expressions.
Floating-point numbers of type REAL*4 and COMPLEX*8 may be represented by F_Floating or IEEE S_Floating, depending on compiler switches.
Floating-point numbers of type REAL*8 and COMPLEX*16 may be represented by D_Floating, G_Floating, or IEEE T_Floating, depending on compiler switches.
On OpenVMS Alpha systems, the debugger cannot evaluate expressions that contain
complex variables. To work around this problem, examine the complex variable and then evaluate
the expression using the real and imaginary parts of the complex variable as shown by the
EXAMINE command.
D.9.5. Initialization Code
/CHECK=UNDERFLOW or
/PARALLEL qualifier, a message appears, as in the following example:
DBG> RUN FORMS
Language: FORTRAN, Module: FORMS
Type GO to reach main program
DBG>The "Type GO to reach MAIN program" message indicates that execution is suspended
before the start of the main program, so that you can execute initialization code under debugger
control. Entering the GO command places you at the start of the main program.
At that point, enter the GO command again to start program execution, as with
other types of Fortran programs.
The following subtopics describe debugger support for MACRO-32.
D.10. MACRO-32
The following subtopics describe debugger support for MACRO--32.
D.10.1. Operators in Language Expressions
|
Kind |
Symbol |
Function |
|---|---|---|
|
Prefix |
@ |
Indirection |
|
Prefix |
. |
Indirection |
|
Prefix |
+ |
Unary plus |
|
Prefix |
-- |
Unary minus (negation) |
|
Infix |
+ |
Addition |
|
Infix |
-- |
Subtraction |
|
Infix |
* |
Multiplication |
|
Infix |
/ |
Division |
|
Infix |
MOD |
Remainder |
|
Infix |
@ |
Left shift |
|
Infix |
EQL |
Equal to |
|
Infix |
EQLU |
Equal to |
|
Infix |
NEQ |
Not equal to |
|
Infix |
NEQU |
Not equal to |
|
Infix |
GTR |
Greater than |
|
Infix |
GTRU |
Greater than unsigned |
|
Infix |
GEQ |
Greater than or equal to |
|
Infix |
GEQU |
Greater than or equal to unsigned |
|
Infix |
LSS |
Less than |
|
Infix |
LSSU |
Less than unsigned |
|
Infix |
LEQ |
Less than or equal to |
|
Infix |
LEQU |
Less than or equal to unsigned |
|
Prefix |
NOT |
Bit-wise NOT |
|
Infix |
AND |
Bit-wise AND |
|
Infix |
OR |
Bit-wise OR |
|
Infix |
XOR |
Bit-wise exclusive OR |
|
Infix |
EQV |
Bit-wise equivalence |
D.10.2. Constructs in Language and Address Expressions
|
Symbol |
Construct |
|---|---|
|
[ ] |
Subscripting |
|
|
Bit field selection as in BLISS |
The DST information generated by the MACRO--32 assembler treats a label that is followed by an assembler directive for storage allocation as an array variable whose name is the label. This enables you to use the array syntax of a high-level language when examining or manipulating such data.
LAB4: .WORD ^X3F, 5[2], ^X3C
DBG> EXAMINE LAB4
.MAIN.\MAIN\LAB4
[0]: 003F
[1]: 0005
[2]: 0005
[3]: 003CDBG> EXAMINE LAB4[3]
.MAIN.\MAIN\LAB4[3]: 03CD.10.3. Data Types
|
MACRO--32 Directives |
Operating System Data Type Name |
|---|---|
|
.BYTE |
Byte Unsigned (BU) |
|
.WORD |
Word Unsigned (WU) |
|
.LONG |
Longword Unsigned (LU) |
|
.SIGNED_BYTE |
Byte Integer (B) |
|
.SIGNED_WORD |
Word Integer (W) |
|
.LONG |
Longword Integer (L) |
|
.QUAD |
Quadword Integer (Q) |
|
.F_FLOATING |
F_Floating (F) |
|
.D_FLOATING |
D_Floating (D) |
|
.G_FLOATING |
G_Floating (G) |
|
(Not applicable) |
Packed decimal (P) |
D.10.4. MACRO--32 Compiler (AMACRO - Alpha Only; IMACRO - Integrity servers Only)
Programmers who are porting applications written in MACRO--32 to Alpha systems use the MACRO--32 compiler (AMACRO). A debugging session for compiled MACRO--32 code is similar to that for assembled code. However, there are some important differences that are described in this section. For complete information on porting these applications, see the Porting VAX MACRO Code from OpenVMS VAX to OpenVMS Alpha manual.
D.10.4.1. Code Relocation
One major difference is the fact that the code is compiled. On a VAX system, each MACRO--32
instruction is a single machine instruction. On an Alpha system, each MACRO--32 instruction may
be compiled into many Alpha machine instructions. A major side effect of this difference is the
relocation and rescheduling of code if you do not specify /NOOPTIMIZE in
your compile command. After you have debugged your code, you can recompile without
/NOOPTIMIZE to improve performance.
D.10.4.2. Symbolic Variables
Another major difference between debugging compiled code and debugging assembled code is a new concept to MACRO--32, the definition of symbolic variables for examining routine arguments. The arguments do not reside in a vector in memory on Alpha and Integrity servers.
Registers
On the stack above the routine's stack frame
In the stack frame, if the argument list was "homed"or if there are calls out of the routine that require the register arguments to be saved.
The compiler does not require that you read the generated code to locate the arguments. Instead, it provides $ARG n symbols that point to the correct argument locations. $ARG1 is the first argument, $ARG2 is the second argument, and so forth. These symbols are defined in CALL_ENTRY and JSB_ENTRY directives, but not in EXCEPTION_ENTRY directives.
D.10.4.3. Locating Arguments Without $ARG n Symbols
There may be additional arguments in your code for which the compiler did not generate a $ARG
n symbol. The number of $ARG n symbols
defined for a .CALL_ENTRY routine is the maximum number detected by the compiler (either by
automatic detection or as specified by MAX_ARGS) or16, whichever is less. For a .JSB_ENTRY
routine, since the arguments are homed in the caller's stack frame and the compiler cannot
detect the actual number, it always creates eight $ARG n
symbols.
In most cases, you can easily find any additional arguments, but in some cases you cannot.
D.10.4.4. Arguments That Are Easy to Locate
The argument list is not homed, and $ARG
nsymbols are defined to $ARG7 or higher. If the argument list is not homed, the $ARGnsymbols $ARG7 and above always point into the list of parameters passed as quadwords on the stack. Subsequent arguments will be in quadwords following the last defined $ARGnsymbol.The argument list has been homed, and you want to examine an argument that is less than or equal to the maximum number detected by the compiler (either by automatic detection or as specified by MAX_ARGS). If the argument list is homed, $ARG
nsymbols always point into the homed argument list. Subsequent arguments will be in longwords following the last defined $ARGnsymbol.
DBG> EX $ARG8 ; highest defined $ARGn
.
.
.
DBG> EX .+4 ; next arg is in next longword
.
.
.
DBG> EX .+4 ; and so onThis example assumes that the caller detected at least ten arguments when homing the argument list.
To find arguments beyond the last $ARG n symbol in a routine that
did not home the arguments, proceed exactly as in the previous example except substitute EX .+8
for EX .+4.
D.10.4.5. Arguments That Are Not Easy to Locate
The argument list is homed, and you want to examine arguments beyond the number detected by the compiler. The $ARG
nsymbols point to the longwords that are stored in the homed argument list. The compiler only moves as many arguments as it can detect into this list. Examining longwords beyond the last argument that was homed will result in examining various other stack context.The argument list is not homed, and $ARG
nsymbols are defined only as high as $ARG6. In this case, the existing $ARGnsymbols will either point to registers or to quadword locations in the stack frame. In both cases, subsequent arguments cannot be examined by looking at quadword locations beyond the defined $ARGnsymbols.
The only way to find the additional arguments in these cases is to examine the compiled machine code to determine where the arguments reside. Both of these problems are eliminated if MAX_ARGS is specified correctly for the maximum argument that you want to examine.
D.10.4.6. Debugging Code with Floating-Point Data
You can use the
EXAMINE/FLOATcommand to examine an Alpha integer register for a floating-point value.Even though there is a set of registers for floating-point operations on Alpha systems, those registers are not used by compiled MACRO--32 code that contains floating-point operations. Only the Alpha integer registers are used.
Floating-point operations in compiled MACRO--32 code are performed by emulation routines that operate outside the compiler. Therefore, performing MACRO--32 floating-point operations on, say, R7, has no effect on Alpha floating-point register 7.
When using the
EXAMINEcommand to examine a location that was declared with a .FLOAT directive or other floating-point storage directives, the debugger automatically displays the value as floating-point data.When using the
EXAMINEcommand to examine the G_FLOAT data type the debugger automatically displays the value as floating-point data.You can deposit floating-point data in an Alpha integer register with the DEPOSIT command.
H_FLOAT is unsupported.
D.10.4.7. Debugging Code with Packed Decimal Data
When using the EXAMINE command to examine a location that was declared with a .PACKED directive, the debugger automatically displays the value as a packed decimal data type.
You can deposit packed decimal data. The syntax is the same as it is on VAX.
D.11. MACRO--64 (Alpha Only)
The following subtopics describe debugger support for MACRO--64.
D.11.1. Operators in Language Expressions
|
Kind |
Symbol |
Function |
|---|---|---|
|
Prefix |
@ |
Indirection |
|
Prefix |
. |
Indirection |
|
Prefix |
+ |
Unary plus |
|
Prefix |
-- |
Unary minus (negation) |
|
Infix |
+ |
Addition |
|
Infix |
-- |
Subtraction |
|
Infix |
* |
Multiplication |
|
Infix |
/ |
Division |
|
Infix |
MOD |
Remainder |
|
Infix |
@ |
Left shift |
|
Infix |
EQL |
Equal to |
|
Infix |
EQLU |
Equal to |
|
Infix |
NEQ |
Not equal to |
|
Infix |
NEQU |
Not equal to |
|
Infix |
GTR |
Greater than |
|
Infix |
GTRU |
Greater than unsigned |
|
Infix |
GEQ |
Greater than or equal to |
|
Infix |
GEQU |
Greater than or equal to unsigned |
|
Infix |
LSS |
Less than |
|
Infix |
LSSU |
Less than unsigned |
|
Infix |
LEQ |
Less than or equal to |
|
Infix |
LEQU |
Less than or equal to unsigned |
|
Prefix |
NOT |
Bit-wise NOT |
|
Infix |
AND |
Bit-wise AND |
|
Infix |
OR |
Bit-wise OR |
|
Infix |
XOR |
Bit-wise exclusive OR |
|
Infix |
EQV |
Bit-wise equivalence |
D.11.2. Constructs in Language and Address Expressions
|
Symbol |
Construct |
|---|---|
|
|
Bit field selection as in BLISS |
D.11.3. Data Types
.PSECT A, NOEXE.BYTE 5V1:V2:V3: .LONG 7
SHOW SYMBOL/TYPE
command with a V* parameter. The following display
results:data .MAIN.\V1 atomic type, longword integer, size: 4 bytes data .MAIN.\V2 atomic type, longword integer, size: 4 bytes data .MAIN.\V3 atomic type, longword integer, size: 4 bytes)
|
MACRO--64 Directives |
Operating System Data Type Name |
|---|---|
|
.BYTE |
Byte Unsigned (BU) |
|
.WORD |
Word Unsigned (WU) |
|
.LONG |
Longword Unsigned (LU) |
|
.SIGNED_BYTE |
Byte Integer (B) |
|
.SIGNED_WORD |
Word Integer (W) |
|
.LONG |
Longword Integer (L) |
|
.QUAD |
Quadword Integer (Q) |
|
.F_FLOATING |
F_Floating (F) |
|
.D_FLOATING |
D_Floating (D) |
|
.G_FLOATING |
G_Floating (G) |
|
.S_FLOATING (Alpha specific) |
S_Floating (S) |
|
.T_FLOATING (Alpha specific) |
T_Floating (T) |
|
(Not applicable) |
Packed decimal (P) |
D.12. Pascal
The following subtopics describe debugger support for Pascal.
D.12.1. Operators in Language Expressions
|
Kind |
Symbol |
Function |
|---|---|---|
|
Prefix |
+ |
Unary plus |
|
Prefix |
-- |
Unary minus (negation) |
|
Infix |
+ |
Addition, concatenation |
|
Infix |
-- |
Subtraction |
|
Infix |
* |
Multiplication |
|
Infix |
/ |
Real division |
|
Infix |
DIV |
Integer division |
|
Infix |
MOD |
Modulus |
|
Infix |
REM |
Remainder |
|
Infix |
IN |
Set membership |
|
Infix |
= |
Equal to |
|
Infix |
<> |
Not equal to |
|
Infix |
> |
Greater than |
|
Infix |
>= |
Greater than or equal to |
|
Infix |
< |
Less than |
|
Infix |
<= |
Less than or equal to |
|
Prefix |
NOT |
Logical NOT |
|
Infix |
AND |
Logical AND |
|
Infix |
OR |
Logical OR |
The typecast operator (::) is not supported in language expressions.
D.12.2. Constructs in Language and Address Expressions
|
Symbol |
Construct |
|---|---|
|
[ ] |
Subscripting |
|
. (period) |
Record component selection |
|
^ (circumflex) |
Pointer dereferencing |
D.12.3. Predefined Symbols
|
Symbol |
Meaning |
|---|---|
|
TRUE |
Boolean True |
|
FALSE |
Boolean False |
|
NIL |
Nil pointer |
D.12.4. Built-In Functions
|
Symbol |
Meaning |
|---|---|
|
SUCC |
Logical successor |
|
PRED |
Logical predecessor |
D.12.5. Data Types
|
Pascal Data Type |
Operating System Data Type Name |
|---|---|
|
INTEGER |
Longword Integer (L) |
|
INTEGER |
Word Integer (W, WU) |
|
INTEGER |
Byte Integer (B, BU) |
|
UNSIGNED |
Longword Unsigned (LU) |
|
UNSIGNED |
Word Unsigned (WU) |
|
UNSIGNED |
Byte Unsigned (BU) |
|
SINGLE, REAL |
F_Floating (F) |
|
REAL (Alpha and Integrity servers specific) |
IEEE S_Floating (FS) |
|
DOUBLE |
D_Floating (D) |
|
DOUBLE |
G_Floating (G) |
|
DOUBLE (Alpha and Integrity servers specific) |
IEEE T_Floating (FT) |
|
QUADRUPLE (Integrity servers specific) |
H_Floating (H) |
|
BOOLEAN |
(None) |
|
CHAR |
ASCII Text (T) |
|
VARYING OF CHAR |
Varying Text (VT) |
|
SET |
(None) |
|
FILE |
(None) |
|
Enumerations |
(None) |
|
Subranges |
(None) |
|
Typed Pointers |
(None) |
|
Arrays |
(None) |
|
Records |
(None) |
|
Variant records |
(None) |
The debugger accepts Pascal set constants such as [1, 2, 5, 8..10] or [RED, BLUE] in Pascal language expressions.
Floating-point numbers of type REAL may be represented by F_Floating or IEEE S_Floating, depending on compiler switches or source code attributes.
Floating-point numbers of type DOUBLE may be represented by D_Floating, G_Floating, or IEEE T_Floating, depending on compiler switches or source code attributes.
D.12.6. Additional Information
In general, you can examine, evaluate, and deposit into variables, record fields, and array components. An exception to this occurs under the following circumstances: if a variable is not referenced in a program, the Pascal compiler might not allocate the variable. If the variable is not allocated and you try to examine it or deposit into it, you will receive an error message.
When you deposit data into a variable, the debugger truncates the high-order bits if the value being deposited is larger than the variable;the debugger fills the high-order bits with zeros if the value being deposited is smaller than the variable. If the deposit violates the rules of assignment compatibility, the debugger displays an informational message.
You can examine and deposit into automatic variables (within any active block); however, because automatic variables are allocated in stack storage and are contained in registers, their values are considered undefined until the variables are initialized or assigned a value.
D.12.7. Restrictions
Restrictions in debugger support for Pascal are as follows.
DBG>EXAMINE VARS.LENGTHDBG>EXAMINE VARS.BODY
|
Use |
Instead of |
|---|---|
|
EXAMINE/WORD VARS |
EXAMINE VARS.LENGTH |
|
EXAMINE/ASCII VARS+2 |
EXAMINE VARS.BODY |
D.13. PL/I (Alpha Only)
The following subtopics describe debugger support for PL/I.
D.13.1. Operators in Language Expressions
|
Kind |
Symbol |
Function |
|---|---|---|
|
Prefix |
+ |
Unary plus |
|
Prefix |
-- |
Unary minus (negation) |
|
Infix |
+ |
Addition |
|
Infix |
-- |
Subtraction |
|
Infix |
* |
Multiplication |
|
Infix |
/ |
Division |
|
Infix |
** |
Exponentiation |
|
Infix |
| | |
Concatenation |
|
Infix |
= |
Equal to |
|
Infix |
^= |
Not equal to |
|
Infix |
> |
Greater than |
|
Infix |
>= |
Greater than or equal to |
|
Infix |
^ < |
Greater than or equal to |
|
Infix |
< |
Less than |
|
Infix |
<= |
Less than or equal to |
|
Infix |
^> |
Less than or equal to |
|
Prefix |
^ |
Bit-wise NOT |
|
Infix |
& |
Bit-wise AND |
|
Infix |
| |
Bit-wise OR |
D.13.2. Constructs in Language and Address Expressions
|
Symbol |
Construct |
|---|---|
|
( ) |
Subscripting |
|
. (period) |
Structure component selection |
|
-> |
Pointer dereferencing |
D.13.3. Data Types
|
PL/I Data Type |
Operating System Data Type Name |
|---|---|
|
FIXED BINARY |
Byte- (B), Word- (W), or Longword- (L) Integer |
|
FIXED DECIMAL |
Packed Decimal (P) |
|
FLOAT BIN/DEC |
F_Floating (F) |
|
FLOAT BIN/ DEC |
D_Floating (D) |
|
FLOAT BIN/DEC |
G_Floating (G) |
|
BIT |
Bit (V) |
|
BIT |
Bit Unaligned (VU) |
|
CHARACTER |
ASCII Text (T) |
|
CHARACTER VARYING |
Varying Text (VT) |
|
FILE |
(None) |
|
Labels |
(None) |
|
Pointers |
(None) |
|
Arrays |
(None) |
|
Structures |
(None) |
D.13.4. Static and Nonstatic Variables
- STATIC
- EXTERNAL
- GLOBALDEF
- GLOBALREF
- AUTOMATIC
- BASED
- CONTROLLED
- DEFINED
- PARAMETER
D.13.5. Examining and Manipulating Data
The following subtopics give examples of the EXAMINE command with PL/I data
types. They also highlight aspects of debugger support that are specific to PL/I.
D.13.5.1. EXAMINE Command Examples
EXAMINE command with a few selected
PL/I data types. - Examine the value of a variable declared as FIXED DECIMAL (10, 5):
DBG>
EXAMINE XPROG4\X: 540.02700 - Examine the value of a structure variable:
DBG>
EXAMINE PARTMAIN_PROG\INVENTORY_PROG\PART ITEM: "WF-1247" PRICE: 49.95 IN_STOCK: 24 - Examine the value of a pictured variable (note that the debugger displays the value in quotation marks):
DBG>
EXAMINE QMAIN\Q: "666.3330" - Examine the value of a pointer (which is the virtual address of the variable it accesses) and display the value in hexadecimal radix instead of decimal (the default):
DBG>
EXAMINE/HEXADECIMAL PPROG4\SAMPLE.P: 0000B2A4 - Examine the value of a variable with the BASED attribute; in this case, the variable X has been declared as BASED (PTR), with PTR its pointer:
DBG>
EXAMINE XPROG\X: "A" - Examine the value of a variable X declared as BASED with a variable PTR declared as POINTER; here, PTR is associated with X by the following line of PL/I code (instead of X having been declared as BASED (PTR) as in the preceding example):
ALLOCATE X SET (PTR);
In this case, you examine the value of X as follows:DBG>
EXAMINE PTR->XPROG6\PTR->X: "A"
D.13.5.2. Notes on Debugger Support
Note the following points about debugger support for PL/I.
You cannot use the DEPOSIT command with entry or label variables or
formats, or with entire arrays or structures. You cannot use the EXAMINE
command with entry or label variables or formats; instead, use the
EVALUATE/ADDRESS command.
You cannot use the EXAMINE command to determine the values or attributes of
global literals (such as GLOBALDEF VALUE literals) because they are static expressions.
Instead, use the EVALUATE command.
You cannot use the EXAMINE, EVALUATE, and
DEPOSIT commands with compile-time variables and procedures. However, you
can use EVALUATE and DEPOSIT (but not EXAMINE) with a compile-time constant, as long as the
constant is the source and not the destination.
Note that an uninitialized automatic variable does not have valid contents until after a value has been assigned to it. If you examine it before that point, the value displayed is unpredictable.
You can deposit a value into a pointer variable either by depositing another pointer's value
into it, thus making symbolic reference to both pointers, or by depositing a virtual address
into it. (You can find out the virtual address of a variable by using the
EVALUATE/ADDRESS command, and then deposit that address into the pointer.)
When you examine a pointer, the debugger displays its value in the form of the virtual address
of the variable that the pointer points to.
The debugger treats all numeric constants of the form n or
n.n in PL/I language expressions as packed decimal constants, not
integer or floating-point constants, in order to conform to PL/I language rules. The internal
representation of 10 is therefore 0C01hexadecimal, not 0A hexadecimal.
You can enter floating-point constants using the syntax nEn or n.nEn.
There is no PL/I syntax for entering constants whose internal representation is Longword
Integer. This limitation is not normally significant when debugging, since the debugger
supports the PL/I type conversion rules. However, it is possible to enter integer constants by
using the debugger's %HEX, %OCT, and %BIN operators, because nondecimal radix constants are
assumed to be FIXED BINARY. For example, the EVALUATE/HEXADECIMAL 53 + %HEX
0 command displays
00000035.
D.14. Language UNKNOWN
The following subtopics describe debugger support for language UNKNOWN.
D.14.1. Operators in Language Expressions
|
Kind |
Symbol |
Function |
|---|---|---|
|
Prefix |
+ |
Unary plus |
|
Prefix |
-- |
Unary minus (negation) |
|
Infix |
+ |
Addition |
|
Infix |
-- |
Subtraction |
|
Infix |
* |
Multiplication |
|
Infix |
/ |
Division |
|
Infix |
& |
Concatenation |
|
Infix |
// |
Concatenation |
|
Infix |
= |
Equal to |
|
Infix |
<> |
Not equal to |
|
Infix |
/= |
Not equal to |
|
Infix |
> |
Greater than |
|
Infix |
>= |
Greater than or equal to |
|
Infix |
< |
Less than |
|
Infix |
<= |
Less than or equal to |
|
Infix |
EQL |
Equal to |
|
Infix |
NEQ |
Not equal to |
|
Infix |
GTR |
Greater than |
|
Infix |
GEQ |
Greater than or equal to |
|
Infix |
LSS |
Less than |
|
Infix |
LEQ |
Less than or equal to |
|
Prefix |
NOT |
Logical NOT |
|
Infix |
AND |
Logical AND |
|
Infix |
OR |
Logical OR |
|
Infix |
XOR |
Exclusive OR |
|
Infix |
EQV |
Equivalence |
D.14.2. Constructs in Language and Address Expressions
|
Symbol |
Construct |
|---|---|
|
[ ] |
Subscripting |
|
( ) |
Subscripting |
|
. (period) |
Record component selection |
|
^ (circumflex) |
Pointer dereferencing |
D.14.3. Predefined Symbols
|
Symbol |
Meaning |
|---|---|
|
TRUE |
Boolean True |
|
FALSE |
Boolean False |
|
NIL |
Nil pointer |
D.14.4. Data Types
For language UNKNOWN, the debugger accepts the dot-notation for record component selection. For example, if C is a component of a record B which in turn is a component of a record A, then C can be referenced as A.B.C. Subscripts can be attached to any array components; for example, if B is an array, then C can be referenced as A.B [2, 3].C.
For language UNKNOWN, the debugger accepts brackets and parentheses for subscripts. For example, A [2, 3] and A(2, 3) are equivalent.
Appendix E. EIGHTQUEENS.C
This appendix contains the source code for the programs used in many figures of Chapter 8, "Introduction ", Chapter 9, "Starting and Ending a Debugging Session", and Chapter 10, "Using the Debugger", EIGHTQUEENS.C and 8QUEENS.C. These programs are presented here only to assist in understanding the procedures described in those chapters.
E.1. EIGHTQUEENS.C
extern void setqueen()
;extern void removequeen();
extern void trycol();
extern void print(); int a[8]; /* a : array[1..8] of boolean */
int b[16]; /* b : array[2..16] of boolean */
int c[15]; /* c : array[-7..7] of boolean */
int x[8];
/* Solve eight-queens problem */
main()
{
int i;
for (i=0; i <=7; i++)
a[i] = 1;
for (i=0; i <=15; i++)
b[i] = 1;
for (i=0; i <=14; i++)
c[i] = 1;
trycol( 0 );
} /* End main */
void trycol( j )
int j;
{
int m;
int safe;
m = -1;
while (m++ < 7)
{
safe = (a[m] ==1) && (b[m + j] == 1) && (c[m - j + 7] ==1);
if (safe)
{
setqueen(m, j);
x[j] = m + 1;
if (j < 7)
trycol(j + 1);
else
print();
removequeen(m, j);
}
}
} /* End trycol */
void setqueen(m, j)
int m;
int j;
{
a[m] = 0;
b[m + j] = 0;
c[m - j + 7] = 0;
} /* End setqueen */
void removequeen(m, j)
int m;
int j;
{
a[m] = 1;
b[m + j] = 1;
c[m - j + 7] = 1;
} /* End removequeen */
void print()
{
int k;
for (k=0; k<=7; k++)
{
printf(" %d", x[k]);
}
printf("\n");
}/* End print */E.2. 8QUEENS.C
extern void trycol();
int a[8]; /* a : array[1..8] of boolean */
int b[16]; /* b : array[2..16] of boolean */
int c[15]; /* c : array[-7..7] of boolean */
int x[8];
main() /* Solve eight-queens problem */
{
int i;
for (i=0; i <=7; i++)
a[i] = 1;
for (i=0; i <=15; i++)
b[i] = 1;
for (i=0; i <=14; i++)
c[i] = 1;
trycol(0);
printf(" Solved eight-queens problem!\n");
} /* End main */extern int a[8];
extern int b[16];
extern int c[15];
extern void setqueen();
extern void removequeen();
extern void print();
int x[8];
void trycol( j )
int j;
{
int m;
int safe;
m = -1;
while (m++ < 7)
{
safe = (a[m] ==1) && (b[m + j] == 1) && (c[m - j + 7] ==1);
if (safe)
{
setqueen(m, j);
x[j] = m + 1;
if (j < 7)
trycol(j + 1);
else
print();
removequeen(m, j);
}
}
} /* End trycol */
void setqueen(m, j)
int m;
int j;
{
a[m] = 0;
b[m + j] = 0;
c[m - j + 7] = 0;
} /* End setqueen */
void removequeen(m, j)
int m;
int j;
{
a[m] = 1;
b[m + j] = 1;
c[m - j + 7] = 1;
} /* End removequeen */
void print()
{
int k;
for (k=0; k<=7; k++)
{
printf(" %d", x[k]);
}
printf("\n");
} /* End print */On OpenVMS Alpha systems, anything that uses system service interception (SSI), such as the debugger or the Heap Analyzer, is unable to intercept system service call images activated by shared linkage. The image activator, therefore, avoids shared linkage for images linked or run with /DEBUG, and instead activates private image copies. This affects performance of user applications under debugger or Heap Analyzer control, as images activated by shared linkage run faster.
LINK /TRACEBACK (or LINK /NODEBUG) is a LINK command default.
Traceback information includes compiler-generated line numbers and the names of routines and modules (compilation units). This symbol information is used by the traceback condition handler to identify the PC value (where execution is paused) and the active calls when a run-time error has occurred. The information is also used by the debugger SHOW CALLS command (see Section 2.3.3, ''Determining Where Execution Is Paused'').
The RUN /DEBUG command allows you to run the debugger, but if you entered the LINK /NOTRACEBACK command, you will be unable to do symbolic debugging.
Alpha and Integrity server only.
Logical name DBG$DSF_IMAGE_NAME must point to the directory that contains the .DSF file (see Section 1.2.2, ''Linking a Program for Debugging'').
Integrity server and Alpha specific
/DEBUG, /DEBUG=ALL, and /DEBUG=(SYMBOLS, TRACEBACK) are equivalent.
/DEBUG=TRACEBACK and DEBUG=(NOSYMBOLS, TRACEBACK) are equivalent.
/NODEBUG, /DEBUG=NONE, and /DEBUG=(NOSYMBOLS, NOTRACEBACK) are equivalent.
See Table 5.1, ''Compiler Options for DST Symbol Information''for additional information.
You must also specify the /SHAREABLE qualifier when creating a shareable image (see Section 5.4, ''Debugging Shareable Images'').
GST data includes global symbol information that is resolved at link time. GST data for an executable image includes the names and values of global routines and global constants. GST data for a shareable image includes universal symbols (see Section 5.1.2, ''Local and Global Symbols'' and Section 5.4, ''Debugging Shareable Images'').
Alpha only.
DBG$IMAGE_DSF_PATH must point to the directory in which the .DSF file resides.
LINK /TRACEBACK and LINK /NODEBUG are equivalent. This is the default for the LINK command.
The RUN /DEBUG command allows you to run the debugger, but if you entered the LINK /NOTRACEBACK command you will be unable to do symbolic debugging.
The predefined PROMPT display cannot be scrolled.
Help on commands is available from the Help menu in a debugger window.
See the SHOW PROCESS command
description for a list of additional states.
An unhandled exception is one for which there is no handler in the current frame or for which there is a handler that executes a raise statement and propagates the exception to an outer scope.
An unhandled exception is an exception for which there is no handler in the current frame or for which there is a handler that executes a raise statement and propagates the exception to an outer scope.
Help on commands is available from the Help menu in a debugger window.
Integrity servers support the GNAT Pro Ada 95 compiler from AdaCore.
MACRO--32 must be compiled with the AMACRO compiler.