VSI OpenVMS System Analysis Tools Manual
- Operating System and Version:
- VSI OpenVMS Alpha Version 8.4-2L1 or higher
VSI OpenVMS IA-64 Version 8.4-1H1 or higher
Preface
1. About VSI
VMS Software, Inc. (VSI) is an independent software company licensed by Hewlett Packard Enterprise to develop and support the OpenVMS operating system.
2. About This Manual
The VSI OpenVMS System Analysis Tools Manual is intended primarily for the system programmer or analyst who must investigate the causes of system failures and debug kernel-mode code, such as a device driver.
This manual also includes system management information for maintaining the system resources necessary to capture and store system crash dumps, including the use of dump-off-system-disk (DOSD). To help determine the cause of a hung process or improve system performance, consult this manual for instructions on using the appropriate system analysis tool to analyze your system.
3. Document Structure
This VSI OpenVMS System Analysis Tools Manual contains an introductory chapter and four parts.
Chapter 1, "Overview of System Analysis Tools" presents an overview of the system analysis tools, which are:
System Dump Analyzer Utility including Crash Log Utility Extractor, several other extensions, and descriptions of the callable routines available to user-written extensions
System Code and System Dump debuggers
Alpha Watchpoint Utility
System Service Logging Utility
Delta/XDelta Debugger
Dump-Off-System-Disk
Part I,''OpenVMS System Dump Analyzer (SDA)'' describes the System Dump Analyzer (SDA), its use and commands, the SDA Crash Log Utility Extractor (CLUE), several other SDA extensions, and the SDA callable routines.
Part II,''OpenVMS System Code Debugger and System Dump Debugger'' describes the System Code Debugger (SCD) and the System Dump Debugger (SDD).
Part III,''OpenVMS Alpha Watchpoint Utility'' describes the Alpha Watchpoint Utility (WP).
Part IV,''OpenVMS System Service Logging Utility'' describes the System Service Logging Utility (SSLOG).
4. Related Documents
For additional information, refer to the following documents:
VSI OpenVMS Version 8.4 Upgrade and Installation Manual
VSI OpenVMS System Manager's Manual, Volume 2: Tuning, Monitoring, and Complex Systems
Writing OpenVMS Alpha Device Drivers in C
OpenVMS AXP Internals and Data Structures
Alpha Architecture Reference Manual
Intel IA-64 Architecture Software Developer's Manual
MACRO-64 Assembler for OpenVMS AXP Systems Reference Manual
5. VSI Encourages Your Comments
You may send comments or suggestions regarding this manual or any VSI document by sending electronic mail to the following Internet address: <docinfo@vmssoftware.com>. Users who have VSI OpenVMS support contracts through VSI can contact <support@vmssoftware.com> for help with this product.
6. OpenVMS Documentation
The full VSI OpenVMS documentation set can be found on the VMS Software Documentation webpage at https://docs.vmssoftware.com.
7. Conventions
The following conventions are used in this manual:
| Convention | Meaning |
|---|---|
| Ctrl/x | A sequence such as Ctrl/x indicates that you must hold down the key labeled Ctrl while you press another key or a pointing device button. |
... |
A horizontal ellipsis in examples indicates one of the
following possibilities:
|
. . . | A vertical ellipsis indicates the omission of items from a code example or command format; the items are omitted because they are not important to the topic being discussed. |
| () | In command format descriptions, parentheses indicate that you must enclose choices in parentheses if you specify more than one. |
| [] | In command format descriptions, brackets indicate optional choices. You can choose one or more items or no items. Do not type the brackets on the command line. However, you must include the brackets in the syntax for OpenVMS directory specifications and for a substring specification in an assignment statement. |
| | | In command format descriptions, vertical bars separate choices. Do not type the vertical bars on the command line. |
| Bold type | Bold type represents the name of an argument, an attribute, or a reason. Bold type also represents the introduction of a new term. |
| Italic type | Italic type indicates important information, complete
titles of manuals, or variables. Variables include information that
varies in system output (Internal error
number), in command lines
(/PRODUCER=name),
and in command parameters in text (where dd
represents the predefined code for the device type). |
| UPPERCASE TYPE | Uppercase type indicates the name of a routine, the name of a file, or the abbreviation for a system privilege. |
Monospace type |
Monospace type indicates code examples, command examples, and interactive screen displays. In text, this type also identifies URLs, UNIX commands and pathnames, PC-based commands and folders, and certain elements of the C programming language. |
| Bold monospace type indicates a DCL command or command qualifier. |
| - | A hyphen at the end of a command format description, command line, or code line indicates that the command or statement continues on the following line. |
| _$ | An underscore and dollar sign at the beginning of a command line or code line indicates that the command or statement has been continued from the previous line. The underscore and dollar sign will appear automatically when continuing a command from the previous line using a hyphen; do not type them on the command line. |
| Numbers | All numbers in text are assumed to be decimal unless otherwise noted. Nondecimal radixes – binary, octal, or hexadecimal – are explicitly indicated. |
Chapter 1. Overview of System Analysis Tools
This chapter presents an overview of the following system dump analysis tools and features:
System Dump Analyzer (SDA)
System Code Debugger (SCD)
System Dump Debugger (SDD)
Alpha Watchpoint Utility (WP)
Delta Debugger
XDelta Debugger
Dump-Off-System-Disk (DOSD)
System Service Logging Utility (SSLOG)
On-Chip Logic Analyzer (OCLA)
| To do the following: | Use this utility: | Described in: |
| Analyze a running system. | SDA | Chapter 2, "SDA Description" |
| Analyze a dump file. | SDA | Chapter 2, "SDA Description" |
| Automate the analysis of crash dumps and maintain a fatal-bugcheck history. | CLUE | Chapter 5, "SDA CLUE Extension" |
| Debug nonpagable system code and device drivers running at any IPL. | SCD | Chapter 11, "OpenVMS System Code Debugger" |
| Analyze certain system dumps, display source code, variables or registers in use at the time of a system failure. | SDD | Chapter 12, "OpenVMS System Dump Debugger" |
| Maintain a history of modifications made to a specific location in shared memory on an Alpha system. | WP | Chapter 13, "Watchpoint Utility (Alpha Only)" |
| Monitor execution of user programs and OpenVMS running at IPL 0. | Delta Debugger | Section 1.6, ''Delta/XDelta Debugger'' |
| Debug system code that runs early in booting or when there is no Ethernet adapter dedicated to SCD. | Xdelta Debugger | Section 1.6, ''Delta/XDelta Debugger'' |
| Write the system dump file to a device other than the system disk. | DOSD | Section 1.7, ''Dump-Off-System-Disk (DOSD)'' |
| Characterize spinlock usage and collect per-CPU spinlock performance data. | SPL | Chapter 8, "SDA SPL Extension" |
| Display XFC data structures and statistics to help tune the extended file cache. | XFC | Chapter 9, "SDA XFC Extension" |
| Extend the functionality of SDA. | SDA Extension Callable Routines | Chapter 10, "SDA Extensions and Callable Routines" |
| Log system services. | SSLOG | Chapter 14, "System Service Logging" |
| Determine which instructions have executed in a specific Alpha EV7 CPU. | OCLA | Chapter 7, "SDA OCLA Extension (Alpha Only)" |
1.1. System Dump Analyzer (SDA)
The OpenVMS system dump analyzer (SDA) utility enables you to analyze a running system or a system dump after a system failure occurs. With a system failure, the operating system copies the contents of memory to a system dump file or the primary page file. Additionally, it records the hardware context of each processor. With SDA, you can interpret the contents of the dump file, examine the status of each processor at the time of the system failure, and investigate possible causes of failure.
See Part I,''OpenVMS System Dump Analyzer (SDA)'' for more complete information about SDA, SDA CLUE (Crash Log Utility Extractor), SPL (Spinlock Tracing Utility), other SDA extensions, and the SDA Extension routines.
1.2. System Code Debugger (SCD)
The OpenVMS System Code Debugger (SCD) allows you to debug nonpageable system code and device drivers running at any interrupt priority level (IPL). You can use the SCD to perform the following tasks:
Control the system software's execution----stop at points of interest, resume execution, intercept fatal exceptions, and so on
Trace the execution path of the system software
Display the source code where the software is executing, and step by source line
Monitor exception conditions
Examine and modify the values of variables
In some cases, test the effect of modifications without having to edit the source code, recompile, and relink
SCD is a symbolic debugger. You can specify variable names, routine names, and so on, precisely as they appear in your source code.
SCD recognizes the syntax, data typing, operators, expressions, scoping rules, and other constructs of a given language. If your code or driver is written in more than one language, you can change the debugging context from one language to another during a debugging session.
See Part II,''OpenVMS System Code Debugger and System Dump Debugger'' for complete information about SCD.
1.3. System Dump Debugger (SDD)
The OpenVMS System Dump Debugger allows you to analyze certain system dumps using the commands and semantics of SCD. You can use SDD to perform the following tasks:
Display the source code where the software was executing at the time of the system failure
Examine the values of variables and registers at the time of the system failure
SDD is a symbolic debugger. You can specify variable names, routine names, and so on, precisely as they appear in your source code.
SDD recognizes the syntax, data typing, operators, expressions, scoping rules, and other constructs of a given language. If your code or driver is written in more than one language, you can change the debugging context from one language to another during a debugging session.
See Part II,''OpenVMS System Code Debugger and System Dump Debugger'' for complete information about SCD.
1.4. Watchpoint Utility (Alpha Only)
The OpenVMS Watchpoint utility allows you to maintain a history of modifications that are made to a particular location in shared system space. It sets watchpoints on 32-bit and 64-bit addresses, and watches any system addresses whether in S0, S1, or S2 space.
See Part III,''OpenVMS Alpha Watchpoint Utility'' for complete information about the Watchpoint utility.
1.5. System Service Logging
To log system services, use the System Service Logging (SSLOG) Utility. For additional information, see Chapter 14, "System Service Logging".
1.6. Delta/XDelta Debugger
The OpenVMS Delta/XDelta debugger allows you to monitor the execution of user programs and the OpenVMS operating system. The Delta/XDelta debuggers both use the same commands and expressions, but they are different in how they operate. Delta operates as an exception handler in a process context; whereas XDelta is invoked directly from the hardware system control block (SCB) vector in a system context.
You use OpenVMS Delta instead of the OpenVMS symbolic debugger to debug programs that run in privileged processor mode at interrupt priority level (IPL) 0. Because Delta operates in a process context, you can use it to debug user-mode programs or programs that execute at interrupt priority level (IPL) 0 in any processor mode---user, supervisor, executive, and kernel. To run Delta in a processor mode other than user mode, your process must have the privilege that allows Delta to change to that mode: change-mode-to-executive (CMEXEC), or change-mode-to-kernel (CMKRNL) privilege. You cannot use Delta to debug code that executes at an elevated IPL. To debug with Delta, you invoke it from within your process by specifying it as the debugger instead of the symbolic debugger.
You use OpenVMS XDelta instead of the System Code Debugger when debugging system code that runs early in booting or when there is no Ethernet adapter that can be dedicated to SCD. Because XDelta is invoked directly from the hardware system control block (SCB), it can be used to debug programs executing in any processor mode or at any IPL level. To use XDelta, you must have system privileges, and you must include XDelta when you boot the system. Since XDelta is not process specific, it is not invoked from a process. To debug with XDelta, you must boot the system with a command to include XDelta in memory. XDelta's existence terminates when you reboot the system without XDelta.
On OpenVMS systems, XDelta supports 64-bit addressing. Quadword display mode displays full quadwords of information. The 64-bit address display mode accepts and displays all addresses as 64-bit quantities. XDelta has predefined command strings for displaying the contents of the page frame number (PFN) database.
You can use Delta/XDelta commands to perform the following debugging tasks:
Open, display, and change the value of a particular location
Set, clear, and display breakpoints
Set, display modes in byte, word, longword, or ASCII
Display instructions
Execute the program in a single step with the option to step over a subroutine
Set base registers
List the names and locations of all loaded modules of the executive
Map an address to an executive module
See the VSI OpenVMS Delta/XDelta Debugger Manual for complete information about using the Delta/XDelta debugging utility.
1.7. Dump-Off-System-Disk (DOSD)
The OpenVMS system allows you to write the system dump file to a device other than the system disk. This is useful in large memory systems and in clusters with common system disks where sufficient disk space, on one disk, is not always available to support your dump file requirements. To perform this activity, you must correctly enable the DUMPSTYLE system parameter to allow the bugcheck code to write the system dump file to an alternative device.
See the VSI OpenVMS System Manager's Manual, Volume 2: Tuning, Monitoring, and Complex Systems for complete information about how to write the system dump file to a disk other than the system disk.
1.8. On-Chip Logic Analyzer (OCLA)
The Alpha EV7 On-chip Logic Analyzer utility (OCLA) enables a user to determine which instructions have executed on an Alpha EV7 CPU. One-seventh of the Alpha EV7 cache is set aside as acquisition memory where the virtual addresses of instructions executed by the Alpha EV7 CPU are stored. The acquisition memory can later by analyzed with SDA. For more information on OCLA, see Chapter 7, "SDA OCLA Extension (Alpha Only)".
Part I. OpenVMS System Dump Analyzer (SDA)
Part I,''OpenVMS System Dump Analyzer (SDA)'' describes the capabilities and system management of SDA. It describes how to use SDA to perform the following tasks:
Analyzing a system dump and a running system
Understanding SDA context and commands
Investigating system failures
Inducing system failures
Understanding the ANALYZE command and qualifiers
Invoking SDA commands, SDA CLUE extension commands, SDA Spinlock Tracing commands, and SDA extension routines
Determining which instructions have executed in a specific system CPU, with SDA OCLA commands (Alpha only)
Chapter 2. SDA Description
This chapter describes the functions and the system management of SDA. It describes initialization, operation, and procedures in analyzing a system dump and analyzing a running system. This chapter also describes the SDA context, the command format, and the way both to investigate system failures and induce system failures.
2.1. Capabilities of SDA
When a system failure occurs, the operating system copies the contents of memory to a system dump file or the primary page file, recording the hardware context of each processor in the system as well. The System Dump Analyzer (SDA) is a utility that allows you to interpret the contents of this file, examine the status of each processor at the time of the system failure, and investigate the probable causes of the failure.
You can invoke SDA to analyze a system dump, using the DCL command ANALYZE/CRASH_DUMP. You can then use SDA commands to perform the following operations:
Direct (or echo) the output of an SDA session to a file or device (SET OUTPUT or SET LOG).
Display the condition of the operating system and the hardware context of each processor in the system at the time of the system failure (SHOW CRASH or CLUE CRASH).
Select a specific processor in a multiprocessing system as the subject of analysis (SET CPU).
Select the default size of address data manipulated by the EXAMINE and EVALUATE commands (SET FETCH).
Enable or disable the sign extension of 32-bit addresses (SET SIGN_EXTEND).
Display the contents of a specific process stack (SHOW STACK or CLUE STACK).
Format a call frame from a stack location (SHOW CALL_FRAME).
Read a set of global symbols into the SDA symbol table (READ).
Define symbols to represent values or locations in memory and add them to the SDA symbol table (DEFINE).
Delete symbols not required from the SDA symbol table (UNDEFINE).
Evaluate an expression in hexadecimal and decimal, interpreting its value as a symbol, a condition value, a page table entry (PTE), a processor status (PS) quadword, or date and time (EVALUATE).
Examine the contents of memory locations, optionally interpreting them as assembler instructions, a PTE, a PS, or date and time (EXAMINE).
Display device status as reflected in system data structures (SHOW DEVICE).
Display the contents of the stored machine check frame (SHOW MACHINE_CHECK or CLUE MCHK) for selected HP computers.
Format system data structures (FORMAT).
Validate the integrity of the links in a queue (VALIDATE QUEUE).
Display a summary of all processes on the system (SHOW SUMMARY).
Show the hardware or software context of a process (SHOW PROCESS or CLUE PROCESS).
Display the OpenVMS RMS data structures of a process (SHOW PROCESS with the /RMS qualifier).
Display memory management data structures (SHOW POOL, SHOW PFN_DATA, SHOW PAGE_TABLE, or CLUE MEMORY).
Display lock management data structures (SHOW RESOURCES or SHOW LOCKS).
Display OpenVMS Cluster management data structures (SHOW CLUSTER, SHOW CONNECTIONS, SHOW RSPID, or SHOW PORTS).
Display multiprocessor synchronization information (SHOW SPINLOCKS).
Display the layout of the executive images (SHOW EXECUTIVE).
Capture and archive a summary of dump file information in a list file (CLUE HISTORY).
Copy the system dump file (COPY).
Define keys to invoke SDA commands (DEFINE/KEY).
Search memory for a given value (SEARCH).
Although SDA provides a great deal of information, it does not automatically analyze all the control blocks and data contained in memory. For this reason, in the event of system failure, it is extremely important that you save not only the output provided by SDA commands, but also a copy of the system dump file written at the time of the failure.
You can also invoke SDA to analyze a running system, using the DCL command ANALYZE/SYSTEM. Most SDA commands generate useful output when entered on a running system.
Caution
Although analyzing a running system may be instructive, you should undertake such an operation with caution. System context, process context, and a processor's hardware context can change during any given display.
In a multiprocessing environment, it is very possible that, during analysis, a process running SDA could be rescheduled to a different processor frequently. Therefore, avoid examining the hardware context of processors in a running system.
2.2. System Management and SDA
The system manager must ensure that the system writes a dump file whenever the system fails. The manager must also see that the dump file is large enough to contain all the information to be saved, and that the dump file is saved for analysis. The following sections describe these tasks.
2.2.1. Writing System Dumps
The operating system attempts to write information into the system dump file only if the system parameter DUMPBUG is set. (The DUMPBUG parameter is set by default. To examine and change its value, consult the VSI OpenVMS System Manager's Manual, Volume 2: Tuning, Monitoring, and Complex Systems.) If DUMPBUG is set and the operating system fails, the system manager has the following choices for writing system dumps:
Have the system dump file written to either SYSDUMP.DMP (the system dump file) or to PAGEFILE.SYS (the primary system page file).
Set the DUMPSTYLE system parameter to an even number (for dumps containing all physical memory) or to an odd number (for dumps containing only selected virtual addresses). See Section 2.2.1.1, ''Dump File Style'' for more information about the DUMPSTYLE parameter values.
2.2.1.1. Dump File Style
There are two types of dump files---a full memory dump (also known as a physical dump), and a dump of selected virtual addresses (also known as a selective dump). Both full and selective dumps may be produced in either compressed or uncompressed form. Compressed dumps save disk space and time taken to write the dump at the expense of a slight increase in time to access the dump with SDA. The SDA commands COPY/COMPRESS and COPY/DECOMPRESS can be used to convert an existing dump.
A dump can be written to the system disk, or to another disk set aside for dumps. When using a disk other than a system disk, the disk name is set in the console environment variable DUMP_DEV. This disk is also known as the "dump off system disk" (DOSD) disk.
When writing a system dump, information about the crash is displayed at the system console. This can be either minimal output (for example, bug check code, process name, and image name), or verbose output (for example, executive layout, stack and register contents).
In an OpenVMS Galaxy system, shared memory is dumped by default. It is sometimes necessary to disable the dumping of shared memory. For more information about shared memory, see VSI OpenVMS Alpha Partitioning and Galaxy Guide.
DUMPSTYLE, which specifies the method of writing system dumps, is a 32-bit mask. Table 2.1, ''Definitions of Bits in DUMPSTYLE'' shows how the bits are defined. Each bit can be set independently. The value of the SYSGEN parameter is the sum of the values of the bits that have been set. Remaining or undefined values are reserved to VSI.
| Bit | Value | Description |
|---|---|---|
| 0 | 1 | 0= Full dump. The entire contents of physical memory will be written to the dump file. 1= Selective dump. The contents of memory will be written to the dump file selectively to maximize the usefulness of the dump file while conserving disk space. (Only pages that are in use are written). |
| 1 | 2 | 0= Minimal console output. This consists of the bugcheck code; the identity of the CPU, process, and image where the crash occurred; the system date and time; plus a series of dots indicating progress writing the dump. 1= Full console output. This includes the minimal output previously described plus stack and register contents, system layout, and additional progress information such as the names of processes as they are dumped. |
| 2 | 4 |
0= Dump to system disk. The dump will be written to SYS$SYSDEVICE:[SYSn.SYSEXE]SYSDUMP.DMP, or in its absence, SYS$SYSDEVICE:[SYSn.SYSEXE]PAGEFILE.SYS. 1= Dump to alternate disk. The dump will be written to dump_dev:[SYSn.SYSEXE]SYSDUMP.DMP, where dump_dev is the value of the console environment variable DUMP_DEV. |
| 3 | 8 | 0= Uncompressed dump. Pages are written directly to the dump file. 1= Compressed dump. Each page is compressed before it is written, providing a saving in space and in the time taken to write the dump, at the expense of a slight increase in time taken to access the dump. |
| 4 | 16 | 0= Dump shared memory. 1= Do not dump shared memory. |
| 5 | 32 | 0= Write all processes and global pages in a selective dump. 1= Write only key processes and global pages in a selective dump. This bit is ignored when writing a full dump (bit 0 = 0). This bit should be set only if the priority processes have been correctly set up, as described in VSI OpenVMS System Manager's Manual, Volume 2: Tuning, Monitoring, and Complex Systems. |
| 6--31 | Reserved to VSI. |
The default setting for DUMPSTYLE is 9 (a compressed selective dump, including shared memory, written to the system disk). Unless a value for DUMPSTYLE is specified in MODPARAMS.DAT, AUTOGEN.COM will set DUMPSTYLE either to 1 (an uncompressed selective dump, including shared memory, written to the system disk) if there is less than 128 megabytes of memory on the system, or to 9 (a compressed selective dump, including shared memory, written to the system disk).
2.2.1.2. Comparison of Full and Selective Dumps
A full dump requires that all physical memory be written to the dump file. This ensures the presence of all the page table pages required for SDA to emulate translation of system virtual addresses. Any even-numbered value in the DUMPSTYLE system parameter generates a full dump.
In certain system configurations, it may be impossible to preserve the entire contents of memory in a disk file. For instance, a large memory system or a system with small disk capacity may not be able to supply enough disk space for a full memory dump. If the system dump file cannot accommodate all of memory, information essential to determining the cause of the system failure may be lost.
To preserve those portions of memory that contain information most useful in determining the causes of system failures, a system manager sets the value of the DUMPSTYLE system parameter to specify a dump of selected virtual address spaces. In a selective dump, related pages of virtual address space are written to the dump file as units called logical memory blocks (LMBs). For example, one LMB consists of the page tables for system space; another is the address space of a particular process. Those LMBs most likely to be useful in crash dump analysis are written first. Any odd-numbered value in the DUMPSTYLE system parameter generates a selective dump.
Table 2.2, ''Comparison of Full and Selective Dumps'' compares full and selective style dumps.
| Item | Full | Selective |
|---|---|---|
| Available Information | Complete contents of physical memory in use, stored in order of increasing physical address. | System page table, global page table, system space memory, and process and control regions (plus global pages) for all saved processes. |
| Unavailable Information | Contents of paged-out memory at the time of the system failure. | Contents of paged-out memory at the time of the system failure, process and control regions of unsaved processes, and memory not mapped by a page table. |
| SDA Command Limitations | None. | The following commands are not useful for unsaved processes: SHOW PROCESS/CHANNELS, SHOW PROCESS/IMAGE, SHOW PROCESS/RMS, SHOW STACK, and SHOW SUMMARY/IMAGE. |
2.2.1.3. Controlling the Size of Page Files and Dump Files
You can adjust the size of the system page file and dump file using AUTOGEN (the recommended method) or by using SYSGEN.
AUTOGEN automatically calculates the appropriate sizes for page and dump files. AUTOGEN invokes the System Generation utility (SYSGEN) to create or change the files. However, you can control sizes calculated by AUTOGEN by defining symbols in the MODPARAMS.DAT file. The file sizes specified in MODPARAMS.DAT are copied into the PARAMS.DAT file during AUTOGEN's GETDATA phase. AUTOGEN then makes appropriate adjustments in its calculations.
Although VSI recommends using AUTOGEN to create and modify page and dump file sizes, you can use SYSGEN to directly create and change the sizes of those files.
The sections that follow discuss how you can calculate the size of a dump file.
See the VSI OpenVMS System Manager's Manual for detailed information about using AUTOGEN and SYSGEN to create and modify page and dump file sizes.
2.2.1.4. Writing to the System Dump File
OpenVMS writes the contents of the error-log buffers, processor registers, and memory into the system dump file, overwriting its previous contents. If the system dump file is too small, OpenVMS cannot copy all memory to the file when a system failure occurs.
SYS$SYSTEM:SYSDUMP.DMP (SYS$SPECIFIC:[SYSEXE]SYSDUMP.DMP) is created during installation. To successfully store a crash dump, SYS$SYSTEM:SYSDUMP.DMP must be enlarged to hold all of memory (full dump) or all of system space and the key processes (selective dump).
To calculate the correct size for an uncompressed full dump to SYS$SYSTEM:SYSDUMP.DMP, use the following formula:
size-in-blocks(SYS$SYSTEM:SYSDUMP.DMP)
        = size-in-pages(physical-memory) * blocks-per-page
        + number-of-error-log-buffers * blocks-per-buffer
        + 10
Use the DCL command SHOW MEMORY to determine the total size of physical memory on your system. There is a variable number of error log buffers in any given system, depending on the setting of the ERRORLOGBUFF_S2 system parameter. The size of each buffer depends on the setting of the ERLBUFFERPAG_S2 parameter. (See the VSI OpenVMS System Manager's Manual for additional information about these parameters.)
2.2.1.5. Writing to a Dump File off the System Disk
OpenVMS allows you to write the system dump file to a device other than the system disk. This is useful in large memory systems and in clusters with common system disks where sufficient disk space, on one disk, is not always available to support customer dump file requirements. To perform this activity, the DUMPSTYLE system parameter must be correctly enabled to allow the bugcheck code to write the system dump file to an alternative device.
The requirements for writing the system dump file off the system disk are the following:
The dump device directory structure must resemble the current system disk structure. The [SYSn.SYSEXE]SYSDUMP.DMP file will reside there, with the same boot time system root.
You can use AUTOGEN to create this file. In the MODPARAMS.DAT file, the following symbol prompts AUTOGEN to create the file:DUMPFILE_DEVICE = $nnn$ddcuuuu
The dump device cannot be part of a volume set or a member of a shadow set.
You must set up DOSD for SDA CLUE as described in Chapter 5, "SDA CLUE Extension".
The DUMP_DEV environment variable must exist on your system. You specify the dump device at the console prompt, using the following format:
For Alpha
>>> SET DUMP_DEV device-name[,...]For IA-64
Shell> VMS_SET DUMP_DEV device-name[,...]On some CPU types, you can enter a list of devices. The list can include various alternate paths to the system disk and the dump disk.
By specifying alternate paths in DUMP_DEV, a dump can still be written if the disk fails over to an alternate path while the system is running. When the system crashes, the bugcheck code can use the alternate path by referring to the contents of DUMP_DEV.
When you enter a list of devices, however, the system disk must come last.
For information on how to write the system dump file to an alternative device to the system disk, see the VSI OpenVMS System Manager's Manual, Volume 2: Tuning, Monitoring, and Complex Systems.
2.2.1.6. Writing to the System Page File
If SYS$SYSTEM:SYSDUMP.DMP does not exist, and there is no DOSD device or dump file, the operating system writes the dump of physical memory into SYS$SYSTEM:PAGEFILE.SYS, the primary system page file, overwriting the contents of that file.
If the SAVEDUMP system parameter is set, the dump file is retained in PAGEFILE.SYS when the system is booted after a system failure. If the SAVEDUMP parameter is not set, which is the default, OpenVMS uses the entire page file for paging and any dump written to the page file is lost. (To examine or change the value of the SAVEDUMP parameter, consult the VSI OpenVMS System Manager's Manual, Volume 2: Tuning, Monitoring, and Complex Systems.)
To calculate the minimum size for a full memory dump to SYS$SYSTEM:PAGEFILE.SYS, use the following formula:
size-in-blocks(SYS$SYSTEM:PAGEFILE.SYS)
        = size-in-pages(physical-memory) * blocks-per-page
        + number-of-error-log-buffers  * blocks-per-buffer
        + 10
        + value of the system parameter RSRVPAGCNT * blocks-per-page
Note that this formula calculates the minimum size requirement for saving a physical dump in the system's page file. VSI recommends that the page file be a bit larger than this minimum to avoid hanging the system. Also note that you can only write the system dump into the primary page file (SYS$SYSTEM:PAGEFILE.SYS). Secondary page files cannot be used to save dump file information.
Note also that OpenVMS will not fill the page file completely when writing a system dump, since the system might hang when rebooting after a system crash. RSRVPAGCNT pages are kept unavailable for dumps. This applies to both full dumps and selective dumps.
Writing crash dumps to SYS$SYSTEM:PAGEFILE.SYS presumes that you will later free the space occupied by the dump for use by the pager. Otherwise, your system may hang during the startup procedure. To free this space, you can do one of the following:
Include SDA commands that free dump space in the site-specific startup command procedure (described in Section 2.2.4, ''Invoking SDA When Rebooting the System'').
Use the SDA COPY command to copy the dump from SYS$SYSTEM:PAGEFILE.SYS to another file. Use the SDA COPY command instead of the DCL COPY command because the SDA COPY command only copies the blocks used by the dump and causes the pages occupied by the dump to be freed from the system's page file.
If you do not need to copy the dump elsewhere, issue an ANALYZE/CRASH_DUMP/RELEASE command. When you issue this command, SDA immediately releases the pages to be used for system paging, effectively deleting the dump. Note that this command does not allow you to analyze the dump before deleting it.
2.2.2. Saving System Dumps
Every time the operating system writes information to the system dump file, it writes over whatever was previously stored in the file. The system writes information to the dump file whenever the system fails. For this reason, the system manager must save the contents of the file after a system failure has occurred.
The system manager can use the SDA COPY command or the DCL COPY command. Either command can be used in a site-specific startup procedure, but the SDA COPY command is preferred because it marks the dump file as copied. As mentioned earlier, this is particularly important if the dump was written into the page file, SYS$SYSTEM:PAGEFILE.SYS, because it releases those pages occupied by the dump to the pager. Another advantage of using the SDA COPY command is that this command copies only the saved number of blocks and not necessarily the whole allotted dump file. For instance, if the size of the SYSDUMP.DMP file is 100,000 blocks and the bugcheck wrote only 60,000 blocks to the dump file, then DCL COPY would create a file of 100,000 blocks. However, SDA COPY would generate a file of only 60,000 blocks.
Because system dump files are set to NOBACKUP, the Backup utility (BACKUP) does not copy them to tape unless you use the qualifier /IGNORE=NOBACKUP when invoking BACKUP. When you use the SDA COPY command to copy the system dump file to another file, OpenVMS does not set the new file to NOBACKUP.
As created during installation, the file SYS$SYSTEM:SYSDUMP.DMP is protected against world access. Because a dump file can contain privileged information, VSI recommends that the system manager does not change this default protection.
When a dump is being analyzed, it is useful to have data available that cannot be written to the dump file at the time of the system crash. This data includes the full file specification associated with a file identification and, on OpenVMS IA-64, the unwind data for images activated in processes.
If the dump is being analyzed on the system where it was originally written, this data can be collected for use in the current SDA session by using the COLLECT command. If the dump is being copied for analysis elsewhere, the COPY/COLLECT command can be used to collect the data and append it to the copy being written. If the COPY/COLLECT command is used after a COLLECT command, the data already collected is appended to the dump copy.
By default, a copy of the original dump, as written at the time of the system crash, will include collection. You can use the COPY/NOCOLLECT command to override this. Conversely, a copy of a dump previously copied by SDA without collection (COPY/NOCOLLECT) will not include collection. You can use COPY/COLLECT to override this.
Copying a dump that already contains an appended collection will always include that collection.
For all file and unwind data to be collected successfully, all disks that were mounted at the time of the system crash should be remounted and accessible to the process running SDA. If SDA is invoked early during the startup to save the contents of the dump (for example, using CLUE$SITE_PROC, as described in Section 2.2.4, ''Invoking SDA When Rebooting the System''), but disks are not mounted until a batch job is run, the COPY/NOCOLLECT command should be used in the CLUE$SITE_PROC command procedure. Once all disks are mounted, you can use a COPY/COLLECT command to save file and unwind data.
If the COPY and COLLECT operations cannot be done as a single step, a COLLECT/SAVE command will write the collection to a separate file that can be used later in conjunction with the dump file. A later COPY will combine the two files.
2.2.3. Partial Dump Copies
Because of the layout of a selective dump, it is often the case that only a small part of the dump is needed to investigate the cause of the system crash. The system manager must save the complete dump locally, as described in the previous section, but has to provide only the key sections of the dump to VSI Services for analysis. This can significantly reduce the time taken to copy the dump over the network. Such a copy is referred to as a Partial Dump Copy. It can only be used when a selective system dump (compressed or uncompressed) has been written, and is not available for full system dumps or for process dumps.
If you require information from a section of the dump that was not copied, it can be extracted from the saved local copy and submitted separately. The ANALYZE /CRASH_DUMP command accepts multiple input files from the same crash and treats them as a single dump.
For an explanation of key processes and key global pages, and the organization of a selective system dump, see the chapter Managing Page, Swap, and Dump Files in the VSI OpenVMS System Manager's Manual, Volume 2: Tuning, Monitoring, and Complex Systems.
2.2.3.1. Example - Use of Partial Dump Copies
The following steps describe a typical use of Partial Dump Copies:
Save the complete dump:
$ ANALYZE/CRASH SYS$SYSTEM:SYSDUMP.DMP

OpenVMS system dump analyzer
...analyzing an I64 compressed selective memory dump...

Dump taken on 22-SEP-2009 18:17:17.99 using version XC4I-J2I
SSRVEXCEPT, Unexpected system service exception

SDA> COPY SSRVEXCEPT.DMP
SDA> EXIT
Create a partial copy containing only the key sections of the dump:
$ ANALYZE/CRASH SSRVEXCEPT

OpenVMS system dump analyzer
...analyzing an I64 compressed selective memory dump...

Dump taken on 22-SEP-2009 18:17:17.99 using version XC4I-J2I
SSRVEXCEPT, Unexpected system service exception

SDA> COPY SSRVKEY /PARTIAL=KEY
SDA> EXIT
Provide the output of this copy, containing only the key sections, to VSI Services, where it can be analyzed as follows:
$ ANALYZE/CRASH SSRVKEY

OpenVMS system dump analyzer
...analyzing an I64 compressed selective memory dump...

Dump taken on 22-SEP-2009 18:17:17.99 using version XC4I-J2I
SSRVEXCEPT, Unexpected system service exception

SDA> SHOW CRASH
SDA> !
- During analysis of the crash, VSI Services determines that the CLUSTER_SERVER process, not included in the partial dump copy, is required and requests that part of the dump. Extract the process from the saved complete copy, as follows:
$ ANALYZE/CRASH SSRVEXCEPT

OpenVMS system dump analyzer
...analyzing an I64 compressed selective memory dump...

Dump taken on 22-SEP-2009 18:17:17.99 using version XC4I-J2I
SSRVEXCEPT, Unexpected system service exception

SDA> COPY SSRVCSP /PARTIAL=PROCESS=NAME=CLUSTER_SERVER
SDA> EXIT
Provide the output of this copy to VSI Services for analysis, where it can be analyzed as follows:
$ ANALYZE/CRASH SSRVKEY,SSRVCSP

OpenVMS system dump analyzer
...analyzing an I64 compressed selective memory dump...

Dump taken on 22-SEP-2009 18:17:17.99 using version XC4I-J2I
SSRVEXCEPT, Unexpected system service exception

SDA> SHOW PROCESS CLUSTER_SERVER
SDA> ! etc.
2.2.3.2. Additional notes on Partial Dump Copies
This section provides additional notes on Partial Dump Copies.
In Step 4 of the preceding example, the COPY command cannot be given as shown:
SDA> COPY /PARTIAL=PROCESS=NAME=CLUSTER_SERVER SSRVCSP
This is because SDA must treat the combined string "CLUSTER SERVER SSRVCSP" as the process name, since spaces are valid in a process name. Alternative formats that can be used are as follows:
SDA> COPY /PARTIAL=PROCESS=NAME=CLUSTER_SERVER SSRVCSP
SDA> COPY /PARTIAL=PROCESS=NAME=(CLUSTER_SERVER) SSRVCSP
SDA> COPY /PARTIAL=(PROCESS=NAME=CLUSTER_SERVER) SSRVCSP
In Step 5 of the preceding example, the input files cannot be specified as "SSRV*". In that case, SSRVCSP.DMP can be opened before SSRVKEY.DMP. The file that contains the section PT must be opened first.
- In a selective system dump, processes are dumped in two sections:
Process Page Table Space
Process Memory
If a process is copied as part of a COPY /PARTIAL, the two sections are always copied together.
In a selective system dump from an Alpha system with Resource Affinity Domains (RADs) enabled, there is a Replicated System Space section for each RAD other than the base RAD. If replicated system space is copied as part of a COPY /PARTIAL, all replicated system space sections are always copied together.
See the description of the COPY command in Chapter 4 for a complete list of the possible section names.
2.2.4. Invoking SDA When Rebooting the System
When the system reboots after a system failure, SDA is automatically invoked by default. SDA archives information from the dump in a history file. In addition, a listing file with more detailed information about the system failure is created in the directory pointed to by the logical name CLUE$COLLECT. (Note that the default directory is SYS$ERRORLOG unless you redefine the logical name CLUE$COLLECT in the procedure SYS$MANAGER:SYLOGICALS.COM.) The file name is in the form CLUE$node_ddmmyy_hhmm.LIS where the timestamp (hhmm) corresponds to the system failure time and not the time when the file was created.
Directed by commands in a site-specific file, SDA can take additional steps to record information about the system failure. They include the following:
Supplementing the contents of the list file containing the output of specific SDA commands.
Copying the contents of the dump file to another file. This information is otherwise lost at the next system failure when the system saves information only about that failure.
If the logical name CLUE$SITE_PROC points to a valid and existing command file, it will be executed as part of the CLUE HISTORY command when you reboot. If used, this file should contain only valid SDA commands.
Generated by a set sequence of commands, the CLUE list file contains only an overview of the failure and is unlikely to provide enough information to determine the cause of the failure. VSI, therefore, recommends that you always copy the dump file.
The following example shows SDA commands that can make up your site-specific command file to produce a more complete SDA listing after each system failure, and to save a copy of the dump file:
!
! SDA command file, to be executed as part of the system
! bootstrap from within CLUE. Commands in this file can
! be used to save the dump file after a system bugcheck, and
! to execute any additional SDA commands.
!
! Note that the logical name DMP$ must have been defined
! within SYS$MANAGER:SYLOGICALS.COM
!
READ/EXEC                   ! read in the executive images' symbol tables
SHOW STACK                  ! display the stack
COPY DMP$:SAVEDUMP.DMP      ! copy and save dump file
!
The CLUE HISTORY command is executed first, followed by the SDA commands in this site-specific command file. See the reference section on CLUE HISTORY for details on the summary information that is generated and stored in the CLUE list file by the CLUE HISTORY command. Note that the SDA COPY command must be the last command in the command file. If the dump has been written to PAGEFILE.SYS, then the space used by the dump will be automatically returned for use for paging as soon as the COPY is complete and no more analysis is possible. You might need to include the /NOCOLLECT qualifier on the COPY command. See Section 2.2.2, ''Saving System Dumps'' for details.
To point to your site-specific file, add a line such as the following to the file SYS$MANAGER:SYLOGICALS.COM:
$ DEFINE/SYSTEM CLUE$SITE_PROC SYS$MANAGER:SAVEDUMP.COM
In this example, the site-specific file is named SAVEDUMP.COM.
The CLUE list file can be printed immediately or saved for later examination.
SDA is invoked and executes the specified commands only when the system boots for the first time after a system failure. If the system is booting for any other reason (such as a normal system shutdown and reboot), SDA exits.
If CLUE files occupy more space than the threshold allows (the default is 5000 blocks), the oldest files will be deleted until the threshold limit is reached. The threshold limit can be customized with the CLUE$MAX_BLOCK logical name.
To prevent the running of CLUE at system startup, define the logical CLUE$INHIBIT in the SYLOGICALS.COM file as TRUE in the system logical name table.
2.3. Analyzing a System Dump
SDA performs certain tasks before bringing a dump into memory, presenting its initial displays, and accepting command input. These tasks include the following:
Verifying that the process invoking it is suitably privileged to read the dump file
Using RMS to read in pages from the dump file
Building the SDA symbol table from the files SDA$READ_DIR:SYS$BASE_IMAGE.EXE and SDA$READ_DIR:REQSYSDEF.STB
Executing the commands in the SDA initialization file
For detailed information on investigating system failures, see Section 2.7, ''Investigating System Failures''.
2.3.1. Requirements
To analyze a dump file, your process must have read access both to the file that contains the dump and to copies of SDA$READ_DIR:SYS$BASE_IMAGE.EXE and SDA$READ_DIR:REQSYSDEF.STB (the required subset of the symbols in the file SYSDEF.STB). SDA reads these tables by default.
2.3.2. Invoking SDA
If your process can access the files listed in Section 2.3.1, ''Requirements'', you can issue the DCL command ANALYZE/CRASH_DUMP to invoke SDA. If you do not specify the name of a dump file in the command, and SYS$SYSTEM:SYSDUMP.DMP cannot be opened, SDA prompts you:
$ ANALYZE/CRASH_DUMP
_Dump File:
If any part of the file name is specified, the default file specification is as follows:
@@@@SYS$DISK:[default-dir]SYSDUMP.DMP
SYS$DISK and [default-dir] represent the disk and directory specified in your last SET DEFAULT command.
If you are rebooting after a system failure, SDA is automatically invoked. See Section 2.2.4, ''Invoking SDA When Rebooting the System''.
2.3.3. Mapping the Contents of the Dump File
SDA first attempts to map the contents of memory as stored in the specified dump file. To do this, it must first locate the page tables for system space among its contents. The system page tables contain one entry for each page of system virtual address space.
If SDA cannot find the system page tables in the dump file, it displays the following message:
%SDA-E-SPTNOTFND, system page table not found in dump file
If that error message is displayed, you cannot analyze the crash dump, but must take steps to ensure that any subsequent dump can be analyzed. To do this, you must either adjust the DUMPSTYLE system parameter as discussed in Section 2.2.1.1, ''Dump File Style'' or increase the size of the dump file as indicated in Section 2.2.1.3, ''Controlling the Size of Page Files and Dump Files''.
If SDA finds the system page tables in an incomplete dump, the following message is displayed:
%SDA-W-SHORTDUMP, dump file was n blocks too small when dump written;
                  analysis may not be possible
Under certain conditions, some memory locations might not be saved in the system dump file. Additionally, if a bugcheck occurs during system initialization, the contents of the register display may be unreliable. The symptom of such a bugcheck is a SHOW SUMMARY display that shows no processes or only the swapper process.
If you use an SDA command to access a virtual address that has no corresponding physical address, SDA generates the following error message:
%SDA-E-NOTINPHYS, 'location': virtual data not in physical memory
When analyzing a selective dump file, if you use an SDA command to access a virtual address that has a corresponding physical address not saved in the dump file, SDA generates one of the following error messages:
%SDA-E-MEMNOTSVD, memory not saved in the dump file

%SDA-E-NOREAD, unable to access location n
2.3.4. Building the SDA Symbol Table
After locating and reading the system dump file, SDA attempts to read the system symbol table file into the SDA symbol table. If SDA cannot find SDA$READ_DIR:SYS$BASE_IMAGE.EXE---or is given a file that is not a system symbol table in the /SYMBOL qualifier to the ANALYZE command---it displays a fatal error and exits. SDA also reads into its symbol table a subset of SDA$READ_DIR:SYSDEF.STB, called SDA$READ_DIR:REQSYSDEF.STB. This subset provides SDA with the information needed to access some of the data structures in the dump.
When SDA finishes building its symbol table, SDA displays a message identifying itself and the immediate cause of the system failure. In the following example, the cause of the system failure was the deallocation of a bad page file address.
OpenVMS Alpha System Dump Analyzer

Dump taken on 27-MAR-1993  11:22:33.92
BADPAGFILD, Bad page file address deallocated
2.3.5. Executing the SDA Initialization File (SDA$INIT)
After displaying the system failure summary, SDA executes the commands in the SDA initialization file, if you have established one. SDA refers to its initialization file by using the logical name SDA$INIT. If SDA cannot find the file defined as SDA$INIT, it searches for the file SYS$LOGIN:SDA.INIT.
This initialization file can contain SDA commands that read symbols into SDA's symbol table, define keys, establish a log of SDA commands and output, or perform other tasks. For instance, you may want to use an SDA initialization file to augment SDA's symbol table with definitions helpful in locating system code. If you issue the following command, SDA includes those symbols that define many of the system's data structures, including those in the I/O database:
READ SDA$READ_DIR:filename
You may also find it helpful to define those symbols that identify the modules in the images that make up the executive by issuing the following command:
READ/EXECUTIVE SDA$READ_DIR:
After SDA has executed the commands in the initialization file, it displays its prompt as follows:
SDA>
This prompt indicates that you can use SDA interactively and enter SDA commands.
An SDA initialization file may invoke a command procedure with the @ command. However, such command procedures cannot invoke other command procedures.
2.4. Analyzing a Running System
Occasionally, OpenVMS encounters an internal problem that hinders system performance without causing a system failure. By allowing you to examine the running system, SDA enables you to search for the solution without disturbing the operating system. For example, you may be able to use SDA to examine the stack and memory of a process that is stalled in a scheduler state, such as a miscellaneous wait (MWAIT) or a suspended (SUSP) state.
If your process has change-mode-to-kernel (CMKRNL) privilege, you can invoke SDA to examine the system. Use the following DCL command:
$ ANALYZE/SYSTEM
SDA attempts to load SDA$READ_DIR:SYS$BASE_IMAGE.EXE and SDA$READ_DIR:REQSYSDEF.STB. It then executes the contents of any existing SDA initialization file, as it does when invoked to analyze a crash dump (see Sections Section 2.3.4, ''Building the SDA Symbol Table'' and Section 2.3.5, ''Executing the SDA Initialization File (SDA$INIT)'', respectively). SDA subsequently displays its identification message and prompt, as follows:
OpenVMS Alpha System Analyzer

SDA>
This prompt indicates that you can use SDA interactively and enter SDA commands. When analyzing a running system, SDA sets its process context to that of the process running SDA.
If you are analyzing a running system, consider the following:
When used in this mode, SDA does not map the entire system, but instead retrieves only the information it needs to process each individual command. To update any given display, you must reissue the previous command.
Caution
When using SDA to analyze a running system, carefully interpret its displays. Because system states change frequently, it is possible that the information SDA displays may be inconsistent with the current state of the system.
Certain SDA commands are illegal in this mode, such as SET CPU. Use of these commands results in the following error message:
%SDA-E-CMDNOTVLD, command not valid on the running system
The SHOW CRASH command, although valid, does not display the contents of any of the processor's set of hardware registers.
2.5. SDA Context
When you invoke SDA to analyze either a crash dump or a running system, SDA establishes a default context for itself from which it interprets certain commands.
When you are analyzing a uniprocessor system, SDA's context is solely process context, which means SDA can interpret its process-specific commands in the context of either the process current on the uniprocessor or some other process in another scheduling state. When SDA is initially invoked to analyze a crash dump, SDA's process context defaults to that of the process that was current at the time of the system failure. When you invoke SDA to analyze a running system, SDA's process context defaults to that of the current process, that is, the one executing SDA. To change SDA's process context, issue any of the following commands:
SET PROCESS process-name
SET PROCESS/ADDRESS=pcb-address
SET PROCESS/INDEX=nn
SET PROCESS/NEXT
SET PROCESS/SYSTEM
SHOW PROCESS process-name
SHOW PROCESS/ADDRESS=pcb-address
SHOW PROCESS/INDEX=nn
SHOW PROCESS/NEXT
SHOW PROCESS/SYSTEM
VALIDATE PROCESS/POOL process-name
VALIDATE PROCESS/POOL/ADDRESS=pcb-address
VALIDATE PROCESS/POOL/INDEX=nn
VALIDATE PROCESS/POOL/NEXT
VALIDATE PROCESS/POOL/SYSTEM
When you invoke SDA to analyze a crash dump from a multiprocessing system with more than one active CPU, SDA maintains a second dimension of context---its CPU context---that allows it to display certain processor-specific information. This information includes the reason for the bugcheck exception, the currently executing process, the current IPL, and the spinlocks owned by the processor. When you invoke SDA to analyze a multiprocessor's crash dump, its CPU context defaults to that of the processor that induced the system failure. When you are analyzing a running system, CPU context is not accessible to SDA. Therefore, the SET CPU command is not permitted.
You can change the SDA CPU context by using any of the following commands:
SET CPU cpu-id
SET CPU /FIRST
SET CPU /NEXT
SET CPU /PRIMARY
SHOW CPU cpu-id
SHOW CPU /FIRST
SHOW CPU /NEXT
SHOW CPU /PRIMARY
SHOW CRASH
SHOW MACHINE_CHECK cpu-id
Changing CPU context involves an implicit change in process context in either of the following ways:
If there is a current process on the CPU made current, SDA process context is changed to that of that CPU's current process.
If there is no current process on the CPU made current, SDA process context is undefined and no process-specific information is available until SDA process context is set to that of a specific process.
Changing process context requires a switch of CPU context as well. For instance, when you issue a SET PROCESS command, SDA automatically changes its CPU context to that of the CPU on which that process was most recently current. The following commands can have this effect:
SET PROCESS process-name
SET PROCESS/ADDRESS=pcb-address
SET PROCESS/INDEX=nn
SET PROCESS/NEXT
SHOW PROCESS process-name
SHOW PROCESS/ADDRESS=pcb-address
SHOW PROCESS/INDEX=nn
SHOW PROCESS/NEXT
VALIDATE PROCESS/POOL process-name
VALIDATE PROCESS/POOL/ADDRESS=pcb-address
VALIDATE PROCESS/POOL/INDEX=nn
VALIDATE PROCESS/POOL/NEXT
2.6. SDA Command Format
The following sections describe the format of SDA commands and the expressions you can use with SDA commands.
command-name[/qualifier...] [parameter][/qualifier...] [!comment]
The command-name is an SDA command. Each command tells the utility to perform a function. Commands can consist of one or more words, and can be abbreviated to the number of characters that make the command unique. For example, SH stands for SHOW.
The parameter is the target of the command. For example, SHOW PROCESS RUSKIN tells SDA to display the context of the process RUSKIN. The command EXAMINE 80104CD0;40 displays the contents of 40 bytes of memory, beginning with location 80104CD0.
When you supply part of a file specification as a parameter, SDA assumes default values for the omitted portions of the specification. The default device is SYS$DISK, the device specified in your most recent SET DEFAULT command. The default directory is the directory specified in the most recent SET DEFAULT command. See the VSI OpenVMS DCL Dictionary for a description of the DCL command SET DEFAULT.
The qualifier modifies the action of an SDA command. A qualifier is always preceded by a slash (/). Several qualifiers can follow a single parameter or command name, but each must be preceded by a slash. Qualifiers can be abbreviated to the shortest string of characters that uniquely identifies the qualifier.
The comment consists of text that describes the command; this comment is not actually part of the command. Comments are useful for documenting SDA command procedures. When executing a command, SDA ignores the exclamation point and all characters that follow it on the same line.
2.6.1. Using Expressions and Operators
You can use expressions as parameters for some SDA commands, such as SEARCH and EXAMINE. To create expressions, use any of the following elements:
Numerals
Radix operators
Arithmetic and logical operators
Precedence operators
Symbols
Numerals are one possible component of an expression. The following sections describe the use of the other components.
2.6.1.1. Radix Operators
Radix operators determine which numeric base SDA uses to evaluate expressions. You can use one of the three radix operators to specify the radix of the numeric expression that follows the operator:
^X (hexadecimal)
^O (octal)
^D (decimal)
The default radix is hexadecimal. SDA displays hexadecimal numbers with leading zeros and decimal numbers with leading spaces.
2.6.1.2. Arithmetic and Logical Operators
There are two types of arithmetic and logical operators:
Unary operators affect the value of the expression that follows them. (See Table 2.3, ''SDA Unary Operators''.)
Binary operators combine the operands that precede and follow them. (See Table 2.4, ''SDA Binary Operators''.)
In evaluating expressions containing binary operators, SDA performs logical AND, OR, and XOR operations, and multiplication, division, and arithmetic shifting before addition and subtraction. Note that the SDA arithmetic operators perform integer arithmetic on 64-bit operands.
| Operator | Action |
|---|---|
| # | Performs a logical NOT of the expression. |
| + | Makes the value of the expression positive. |
| -- | Makes the value of the expression negative. |
| @ | Evaluates the following expression as an address, then uses the contents of that address as its value. |
| ^Q | Specifies that the size of the field to be used as an address is a quadword when used with the unary operator @ 1. |
| ^L | Specifies that the size of the field to be used as an address is a longword when used with the unary operator @ 1. |
| ^W | Specifies that the size of the field to be used as an address is a word when used with the unary operator @ 1. |
| ^B | Specifies that the size of the field to be used as an address is a byte when used with the unary operator @ 1. |
| ^P | Specifies a physical address when used with the unary operator @. The command SET FETCH can be used to change the default FETCH size and/or access method. See the SET FETCH command description in Chapter 4 for more details and examples. |
| ^V | Specifies a virtual address when used with the unary operator @ 1. The command SET FETCH can be used to change the default FETCH size and/or access method. See the SET FETCH command description in Chapter 4 for more details and examples. |
| G | Adds FFFFFFFF 80000000 16 to the value of the expression 2. The unary operator G corresponds to the first virtual address in S0 system space. For example, the expression GD40 can be used to represent the address FFFFFFFF 80000D4016. |
| H | Adds 7FFE0000 16 to the value of the expression 3. The unary operator H corresponds to a convenient base address in P1 space (7FFE000016). You can therefore refer to an address such as 7FFE2A6416 as H2A64 |
| I | Fills the leading digits of the following hexadecimal number with hex value of F. For example: |
| Operator | Action |
|---|---|
| + | Addition |
| -- | Subtraction |
| * | Multiplication |
| & | Logical AND |
| | | Logical OR |
| \ | Logical XOR |
| / | Division. In division, SDA truncates the quotient to an integer, if necessary, and does not retain a remainder. |
| @ | Arithmetic shifting |
| "." |
Catenates two 32-bit values into a 64-bit value. For example: SDA> eval fe.50000 Hex = 000000FE00050000 Decimal = 1090922020864 |
2.6.1.3. Precedence Operators
SDA uses parentheses as precedence operators. Expressions enclosed in parentheses are evaluated first. SDA evaluates nested parenthetical expressions from the innermost to the outermost pairs of parentheses.
2.6.1.4. SDA Symbols
An SDA symbol can represent several value types. It can represent a constant, a data address, a procedure or function descriptor address, or a routine address. Constants are usually offsets of a particular field in a data structure; however, they can also represent constant values such as the BUG$_xxx symbols.
Symbols are composed of up to 31 letters and numbers, and can include the dollar sign ($) and underscore (_) characters. When you invoke SDA, it reads in the global symbols from the symbols table section of SYS$BASE_IMAGE.EXE, and from REQSYSDEF.STB, a required subset of the symbols in the file SYSDEF.STB. You can add other symbols to SDA's symbol table by using the DEFINE and READ commands.
All address symbols identify memory locations. SDA generally does not distinguish among different types of address symbols. However, for a symbol identified as the name of a procedure descriptor, SDA takes an additional step of creating an associated symbol to name the code entry point address of the procedure. It forms the code entry point symbol name by appending _C to the name of the procedure descriptor.
Also, SDA substitutes the code entry point symbol name for the procedure descriptor symbol when you enter the following command:
SDA> EXAMINE/INSTRUCTION procedure-descriptorFor example, enter the following command:
SDA> EXAMINE/INSTRUCTION SCH$QAST
SDA displays the following information:
SCH$QAST_C: SUBQ SP,#X40,SP
Now enter the EXAMINE command but do not specify the /INSTRUCTION qualifier, as follows:
SDA> EXAMINE SCH$QAST
SDA displays the following information:
SCH$QAST: 0000002C.00003009 ".0..,..."
This display shows the contents of the first two longwords of the procedure descriptor.
Note that there are no routine address symbols on Alpha systems, except for those in MACRO-64 assembly language modules. Therefore, SDA creates a routine address symbol for every procedure descriptor it has in its symbol table. The new symbol name is the same as for the procedure descriptor except that it has an _C appended to the end of the name.
Sources for SDA Symbols
SDA obtains its information from the following:
Images (.EXE files)
Image symbol table files (.STB files)
Object files
SDA also defines symbols to access registers and to access common data structures.
The only images with symbols are shareable images and executive images. These images contain only universal symbols, such as constants and addresses.
The image symbol table files are produced by the linker with the /SYMBOLS qualifier. These files normally contain only universal symbols, as do the executable images. However, if the SYMBOL_TABLE=GLOBALS linker option is specified, the .STB file also contains all global symbols defined in the image. See the VSI OpenVMS Linker Utility Manual for more information.
Object files can contain global constant values. An object file used with SDA typically contains symbol definitions for data structure fields. Such an object file can be generated by compiling a MACRO-32 source module that invokes specific macros. The macros, which are typically defined in SYS$LIBRARY:LIB.MLB or STARLET.MLB, define symbols that correspond to data structure field offsets. The macro $UCBDEF, for example, defines offsets for fields within a unit control block (UCB). OpenVMS Alpha and IA-64 provide several such object modules in SDA$READ_DIR, as listed in the table below. For compatibility with OpenVMS VAX, the modules' file types have been renamed to .STB.
| File | Contents |
|---|---|
| DCLDEF.STB | Symbols for the DCL interpreter |
| DECDTMDEF.STB | Symbols for transaction processing |
| GLXDEF.STB | Symbols for OpenVMS Galaxy data structures |
| IMGDEF.STB | Symbols for the image activator |
| IODEF.STB | I/O database structure symbols |
| NETDEF.STB | Symbols for DECnet data structures |
| REQSYSDEF.STB | Required symbols for SDA |
| RMSDEF.STB | Symbols that define RMS internal and user data structures and RMS$_ xxx completion codes |
| SCSDEF.STB | Symbols that define data structures for system communications services |
| SYSDEF.STB | Symbols that define system data structures, including the I/O database |
| TCPIP$NET_GLOBALS.STB 1 | Data structure definitions for TCP/IP internet driver, execlet, and ACP data structures. Available only if TCP/IP has been installed. |
| TCPIP$NFS_GLOBALS.STB 1 | Data structure definitions for TCP/IP NFS server. Available only if TCP/IP has been installed. |
| TCPIP$PROXY_GLOBALS.STB 1 | Data structure definitions for TCP/IP proxy execlet |
| TCPIP$PWIP_GLOBALS.STB 1 | Data structure definitions for TCP/IP PWIP driver, and ACP data structures. Available only if TCP/IP has been installed. |
| TCPIP$TN_GLOBALS.STB 1 | Data structure definitions for TCP/IP TELNET/RLOGIN server driver data structures. Available only if TCP/IP has been installed. |
The following table lists symbols that SDA defines automatically on initialization.
| ASN | Address space number |
| AST | Both the asynchronous system trap status and enable registers: AST<3:0> = AST enable; AST<7:4> = AST status |
| BR0 through BR7 | Branch registers (IA-64 only) |
| CYCLE_COUNTER | Process cycle counter |
| ESP | Executive stack pointer |
| EBSP | Executive register stack pointer (IA-64 only) |
| FEN | Floating-point enable |
| FP | Frame pointer (R29) |
| FP0 through FP31 | Floating-point registers (Alpha only) |
| FP0 through FP127 | Floating point registers (IA-64 only) |
| FPCR | Floating-point control register (Alpha only) |
| FPSR | Floating-point status register (IA-64 only) |
| GP | Global pointer (R1) (IA-64 only) |
| G | FFFFFFFF.80000000 16, the base address of system space |
| H | 00000000.7FFE0000 16, a base address in P1 space |
| I | FFFFFFFF.FFFFFFFF 16, also fills the leading digits of a hexadecimal number with the value of F |
| KSP | Kernel stack pointer |
| KBSP | Kernel register stack pointer (IA-64 only) |
| PAL_RSVD | PAL reserved area in process HWPCB |
| PC | Program counter |
| PCC | Process cycle counter |
| PS | Processor status |
| PTBR | Page table base register |
| R0 through R31 | Integer registers (Alpha only) |
| R0 through R127 | Integer registers (IA-64 only) |
| SCC | System cycle counter |
| SP | Current stack pointer of a process |
| SSP | Supervisor stack pointer |
| SBSP | Supervisor register stack pointer (IA-64 only) |
| SYSPTBR | Page table base register for system space |
| USP | User stack pointer |
| UBSP | User register stack pointer (IA-64 only) |
| VIRBND | Virtual Address Boundary for RADs (Alpha only) |
After a SET CPU command is issued (for analyzing a crash dump only), the symbols defined in the table below are set for that CPU.
| CPUDB | Address of CPU database |
| IPL | Interrupt priority level register |
| MCES | Machine check error summary register |
| PCBB | Process context block base register |
| PRBR | Processor base register (CPU database address) |
| RAD | Address of RAD database |
| SCBB | System control block base register |
| SISR | Software interrupt status register |
| VPTB | Virtual Page Table Base register |
After a SET PROCESS command is issued, the symbols listed in the table below are defined for that process.
| ARB | Address of access rights block |
| FRED | Address of floating-point register and execution data block |
| JIB | Address of job information block |
| KTB | Address of the kernel thread block |
| ORB | Address of object rights block |
| PCB | Address of process control block |
| PHD | Address of process header |
| PSB | Address of persona security block |
Other SDA commands, such as SHOW DEVICE and SHOW CLUSTER, predefine additional symbols.
Symbols can include lowercase letters. Commands that manipulate symbols (such as DEFINE, SHOW SYMBOL, UNDEFINE) require these symbols to be enclosed within quotation marks ("symbol" ).
SDA Symbol Initialization
On initialization, SDA reads the universal symbols defined by SYS$BASE_IMAGE.EXE. For every procedure descriptor address symbol found, a routine address symbol is created (with _C appended to the symbol name).
SDA then reads the object file REQSYSDEF.STB. This file contains data structure definitions that are required for SDA to run correctly. It uses these symbols to access some of the data structures in the crash dump file or on the running system.
Finally, SDA initializes the process registers defined in Table 2.8, ''SDA Symbols Defined by SET PROCESS Command'' and executes a SET CPU command, defining the symbols as well.
Use of SDA Symbols
There are two major uses of the address type symbols. First, the EXAMINE command employs them to find the value of a known symbol. For example, EXAMINE CTL$GL_PCB finds the PCB for the current process. Then, certain SDA commands (such as EXAMINE, SHOW STACK, and FORMAT) use them to symbolize addresses when generating output.
When the code for one of these commands needs a symbol for an address, it calls the SDA symbolize routine. The symbolize routine tries to find the symbol in the symbol table whose address is closest to, but not greater than the requested address. This means, for any given address, the routine may return a symbol of the form symbol_name+offset. If, however, the offset is greater than 0FFF16, it fails to find a symbol for the address.
As a last resort, the symbolize routine checks to see if this address falls within a known memory range. Currently, the only known memory ranges are those used by the OpenVMS executive images and those used by active images in a process. SDA searches through the executive loaded image list (LDRIMG data structure) and activated image list (IMCB data structures) to see if the address falls within any of the image sections. If SDA does find a match, it returns one of the following types of symbols:
@@@@executive_image_name+offset activated_image_name+offset
The offset is the same as the image offset as defined in the map file.
The constants in the SDA symbol table are usually used to display a data structure with the FORMAT command. For example, the PHD offsets are defined in SYSDEF.STB; you can display all the fields of the PHD by entering the following commands:
SDA> READ SDA$READ_DIR:SYSDEF.STB

SDA> FORMAT/TYPE=PHD phd_address
Symbols and Address Resolution
In OpenVMS, executive and user images are loaded into dynamically assigned address space. To help you associate a particular virtual address with the image whose code has been loaded at that address, SDA provides several features:
The SHOW EXECUTIVE command
The symbolization of addresses, described in the previous section
The READ command
The SHOW PROCESS command with the /IMAGES qualifier
The MAP command
The OpenVMS executive consists of two base images, SYS$BASE_IMAGE.EXE and SYS$PUBLIC_VECTORS.EXE, and a number of other separately loadable images. Some of these images are loaded on all systems, while others support features unique to particular system configurations. Executive images are mapped into system space during system initialization.
By default, a typical executive image is not mapped at contiguous virtual addresses. Instead, its nonpageable image sections are loaded into a reserved set of pages with other executive images' nonpageable sections. The pageable sections of a typical executive image are mapped contiguously into a different part of system space. An image mapped in this manner is said to be sliced. A particular system may have system parameters defined that disable executive image slicing altogether.
Each executive image is described by a data structure called a loadable image data block (LDRIMG). The LDRIMG specifies whether the image has been sliced. If the image is sliced, the LDRIMG indicates the beginning of each image section and the size of each section. All the LDRIMGs are linked together in a list that SDA scans to determine what images have been loaded and into what addresses they have been mapped. The SHOW EXECUTIVE command displays a list of all images that are included in the OpenVMS executive.
Each executive image is a shareable image whose universal symbols are defined in the SYS$BASE_IMAGE.EXE symbol vector. On initialization, SDA reads this symbol vector and adds its universal symbols to the SDA symbol table.
Executive image .STB files define additional symbols within an executive image that are not defined as universal symbols and thus are not in the SYS$BASE_IMAGE.EXE symbol vector (see Sources for SDA Symbols Section 2.6.1.4, ''SDA Symbols'' in this section). You can enter a READ/EXECUTIVE command to read symbols defined in all executive image .STB files into the SDA symbol table, or a READ/IMAGE filespec command to read the .STB for a specified image only.
To obtain a display of all images mapped within a process, execute a SHOW PROCESS/IMAGE command. See the description of the SHOW PROCESS command for additional information about displaying the hardware and software context of a process.
You can also identify the image name and offset that correspond to a specified address with the MAP command. With the information obtained from the MAP command, you can then examine the image map to locate the source module and program section offset corresponding to an address.
2.6.2. SDA Display Mode
Some SDA commands produce more output than will fit on one screen. In this situation, SDA enters display mode, and outputs the screen overflow prompt at the bottom of the screen:
Press RETURN for more.
SDA>
If the RETURN key is pressed, SDA will continue the output of the command it was processing. If an EXIT command is entered, SDA will leave display mode, abort the command it was processing and output a regular SDA prompt. If any other command is entered, SDA will leave display mode, abort the command it was processing, and begin processing the new command.
SDA will leave display mode once a continued command completes.
2.7. Investigating System Failures
This section discusses how the operating system handles internal errors, and suggests procedures that can help you determine the causes of these errors. It illustrates, through detailed analysis of a sample system failure, how SDA helps you find the causes of operating system problems.
For a complete description of the commands discussed in the sections that follow, refer to Chapter 4, "SDA Commands" and Chapter 5, "SDA CLUE Extension" of this document, where all the SDA and CLUE commands are presented in alphabetical order.
2.7.1. Procedure for Analyzing System Failures
When the operating system detects an internal error so severe that normal operation cannot continue, it signals a condition known as a fatal bugcheck and shuts itself down. A specific bugcheck code describes each fatal bugcheck.
To resolve the problem, you must find the reason for the bugcheck. Many failures are caused by errors in user-written device drivers or other privileged code not supplied by VSI. To identify and correct these errors, you need a listing of the code in question.
Occasionally, a system failure is the result of a hardware failure or an error in code supplied by VSI. A hardware failure requires the attention of VSI Services. To diagnose an error in code supplied by VSI, you need listings of that code, which are available from VSI.
Start the search for the error by analyzing the CLUE list file that was created by default when the system failed. This file contains an overview of the system failure, which can assist you in finding the line of code that signaled the bugcheck. CLUE CRASH displays the content of the program counter (PC) in the list file. The content of the PC is the address of the next instruction after the instruction that signaled the bugcheck.
However, some bugchecks are caused by unexpected exceptions. In such cases, the address of the instruction that caused the exception is more informative than the address of the instruction that signaled the bugcheck.
The address of the instruction that caused the exception is located on the stack. You can obtain this address either by using the SHOW STACK command to display the contents of the stack or by using the SHOW CRASH or CLUE CRASH command to display the system state at time of exception. See Section 2.7.2, ''Fatal Bugcheck Conditions'' for information on how to proceed for several types of bugchecks.
Once you have found the address of the instruction that caused the bugcheck or exception, find the module in which the failing instruction resides. Use the MAP command to determine whether the instruction is part of a device driver or another executive image. Alternatively, the SHOW EXECUTIVE command shows the location and size of each of the images that make up the OpenVMS executive.
If the instruction that caused the bugcheck is not part of a driver or executive image, examine the linker's map of the module or modules you are debugging to determine whether the instruction that caused the bugcheck is in your program.
To determine the general cause of the system failure, examine the code that signaled the bugcheck or the instruction that caused the exception.
2.7.2. Fatal Bugcheck Conditions
There are many possible conditions that can cause OpenVMS to issue a bugcheck. Normally, these occasions are rare. When they do occur, they are often fatal exceptions or illegal page faults occurring within privileged code. This section describes the symptoms of several common bugchecks. A discussion of other exceptions and condition handling in general appears in the VSI OpenVMS Programming Concepts Manual.
An exception is fatal when it occurs while either of the following conditions exists:
The process is executing above IPL 2 (IPL$_ASTDEL).
The process is executing in a privileged (kernel or executive) processor access mode and has not declared a condition handler to deal with the exception.
When the system fails, the operating system reports the approximate cause of the system failure on the console terminal. SDA displays a similar message when you issue a SHOW CRASH command. For instance, for a fatal exception, SDA can display one of these messages:
FATALEXCPT, Fatal executive or kernel mode exception

INVEXCEPTN, Exception while above ASTDEL

SSRVEXCEPT, Unexpected system service exception

UNXSIGNAL, Unexpected signal name in ACP
When a FATALEXCPT, INVEXCEPTN, SSRVEXCEPT, or UNXSIGNAL bugcheck occurs, two argument lists, known as the mechanism and signal arrays, are placed on the stack.
Section 2.7.2.1, ''Alpha Mechanism Array'' to Section 2.7.2.6, ''IA-64 Exception Stack Frame'' describe these arrays and related data structures, and Section 2.7.2.7, ''SSRVEXCEPT Example'' shows example output from SDA for an SSRVEXCEPT bugcheck.
A page fault is illegal when it occurs while the interrupt priority level (IPL) is greater than 2 (IPL$_ASTDEL). When OpenVMS fails because of an illegal page fault, it displays the following message on the console terminal:
PGFIPLHI, Page fault with IPL too high
Section 2.7.2.8, ''Illegal Page Faults'' describes the stack contents when an illegal page fault occurs.
2.7.2.1. Alpha Mechanism Array
The figure below illustrates the Alpha mechanism array, which is made up entirely of quadwords. The first quadword of this array indicates the number of quadwords in this array; this value is always 2C16. These quadwords are used by the procedures that search for a condition handler and report exceptions.
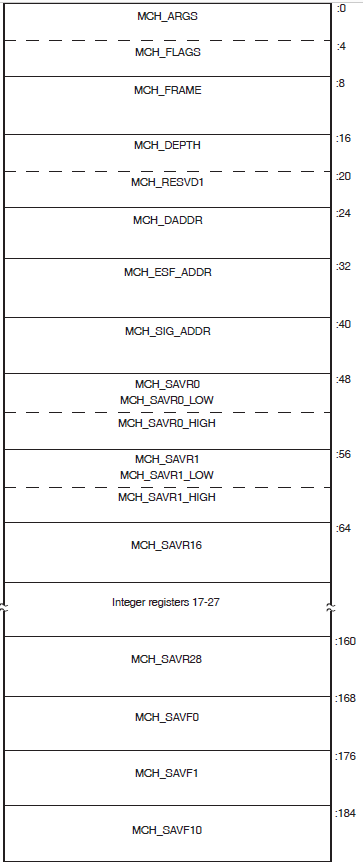
Symbolic offsets into the mechanism array are defined by using the SDA SHOW STACK command to identify the elements of the mechanism array on the stack using the symbols in the table below.
| Offset | Meaning |
|---|---|
| CHF$IS_MCH_ARGS | Number of quadwords that follow. In a mechanism array, this value is always 2C 16. |
| CHF$IS_MCH_FLAGS | Flag bits for related argument mechanism information. |
| CHF$PH_MCH_FRAME | Address of the FP (frame pointer) of the establisher's call frame. |
| CHF$IS_MCH_DEPTH | Depth of the OpenVMS search for a condition handler. |
| CHF$PH_MCH_DADDR | Address of the handler data quadword, if the exception handler data field is present. |
| CHF$PH_MCH_ESF_ADDR | Address of the exception stack frame (see Figure 2.5, ''Alpha Exception Stack Frame''figure2-5). |
| CHF$PH_MCH_SIG_ADDR | Address of the signal array (see Figure 2.3, ''Signal Array''). |
| CHF$IH_MCH_SAVRnn | Contents of the saved integer registers at the time of the exception. The following registers are saved: R0, R1, and R16 to R28 inclusive. |
| CHF$FH_MCH_SAVFnn | If the process was using floating point, contents of the saved floating-point registers at the time of the exception. The following registers are saved: F0, F1, and F10 to F30 inclusive. |
| CHF$PH_MCH_SIG64_ADDR | Address of the 64-bit signal array (see Figure 2.4, ''64-Bit Signal Array''). |
2.7.2.2. IA-64 Mechanism Array
The figure below illustrates the IA-64 mechanism array, which is made up entirely of quadwords. The first quadword of this array indicates the number of quadwords in the array. This value is either 4916, if floating point registers F32 to F127 have not been saved, or 10916, if the floating point registers have been saved. These quadwords are used by the procedures that search for a condition handler and report exceptions.
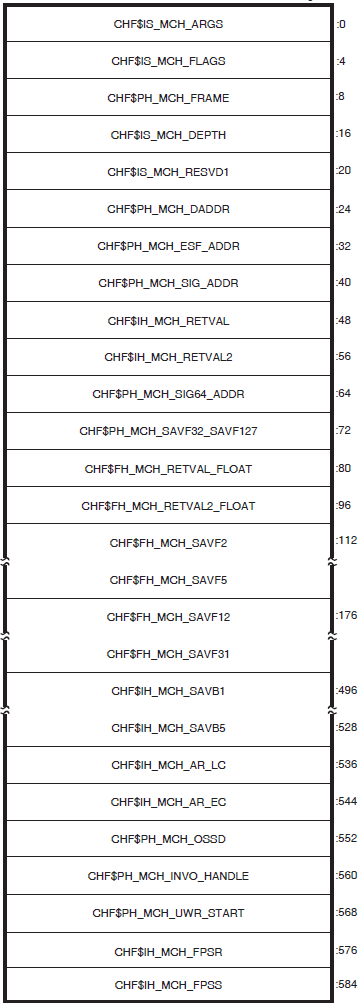
Symbolic offsets into the mechanism array are defined by using the SDA SHOW STACK command to identify the elements of the mechanism array on the stack using the symbols in the table below.
| Field Name | Contents |
|---|---|
| CHF$IS_MCH_ARGS | Count of quadwords in this array starting from the next quadword, CHF$PH_MCH_FRAME (not counting the first quadword that contains this longword). This value is 73 if CHF$V_FPREGS2_VALID is clear, and 265 if CHF$V_FPREGS2_VALID is set. |
| CHF$IS_MCH_FLAGS | Flag bits for related argument-mechanism information. |
| CHF$PH_MCH_FRAME | Contains the Previous Stack Pointer, PSP, (the value of the SP at procedure entry) for the procedure context of the establisher. |
| CHF$IS_MCH_DEPTH | Positive count of the number of procedure activation stack frames between the frame in which the exception occurred and the frame depth that established the handler being called. |
| CHF$PH_MCH_DADDR | Address of the handler data quadword (start of the Language Specific Data area, LSDA), if the exception handler data field is present in the unwind information block (as indicated by OSSD$V_HANDLER_DATA_VALID); otherwise, contains 0. |
| CHF$PH_MCH_ESF_ADDR | Address of the exception stack frame. |
| CHF$PH_MCH_SIG_ADDR | Address of the 32-bit form of signal array. This array is a 32-bit wide (longword) array. This is the same array that is passed to a handler as the signal argument vector. |
| CHF$IH_MCH_RETVAL | Contains a copy of R8 at the time of the exception. |
| CHF$IH_MCH_RETVAL2 | Contains a copy of R9 at the time of the exception. |
| CHF$PH_MCH_SIG64_ADDR | Address of the 64-bit form of signal array. This array is a 64-bit wide (quadword) array. |
| CHF$FH_MCH_SAVF32_SAVF127 | Address of the extension to the mechanism array that contains copies of F32 to F127 at the time of the exception. |
| CHF$FH_MCH_RETVAL_FLOAT | Contains a copy of F8 at the time of the exception. |
| CHF$FH_MCH_RETVAL2_FLOAT | Contains a copy of F9 at the time of the exception. |
| CHF$FH_MCH_SAVFnn | Contain copies of floating-point registers F2 to F5 and F12 to F31. Registers F6, F7 and F10, F11 are implicitly saved in the exception frame. |
| CHF$IH_MCH_SAVBnn | Contain copies of branch registers B1 to B5 at the time of the exception. |
| CHF$IH_MCH_AR_LC | Contains a copy of the Loop Count Register (AR65) at the time of the exception. |
| CHF$IH_MCH_AR_EC | Contains a copy of the Epilog Count Register (AR66) at the time of the exception. |
| CHF$PH_MCH_OSSD | Address of the operating-system specific data area. |
| CHF$PH_MCH_INVO_HANDLE | Contains the invocation handle of the procedure context of the establisher. |
| CHF$PH_MCH_UWR_START | Address of the unwind region. |
| CHF$IH_MCH_FPSR | Contains a copy of the hardware floating-point status register (AR.FPSR) at the time of the exception. |
| CHF$IH_MCH_FPSS | Contains a copy of the software floating-point status register (which supplements CHF$IH_MCH_FPSR) at the time of the exception. |
2.7.2.3. Signal Array
The signal array appears somewhat further down the stack. This array comprises all longwords so that the structure is VAX compatible. A signal array describes the exception that occurred. It contains an argument count, the exception code, zero or more exception parameters, the PC, and the PS. Therefore, the size of a signal array can vary from exception to exception. Although there are several possible exception conditions, access violations are most common. the figure below shows the signal array for an access violation.
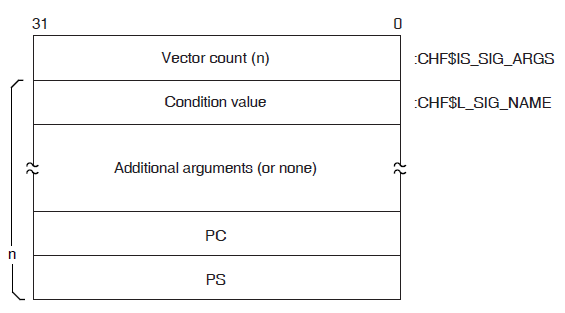
For access violations, the signal array is set up as follows:
| Value | Meaning |
|---|---|
| Vector list length | Number of longwords that follow. For access violations, this value is always 5. |
| Condition value | Exception code. The value 0C 16 represents an access violation. You can identify the exception code by using the SDA command EVALUATE/CONDITION_VALUE or SHOW CRASH. |
| Additional arguments |
These can include a reason mask and a virtual address. In the longword mask if bit 0 of the longword is set, the failing instruction (at the PC saved below) caused a length violation. If bit 1 is set, it referred to a location whose page table entry is in a "no access" page. Bit 2 indicates the type of access used by the failing instruction: it is set for write and modify operations and clear for read operations. The virtual address represents the low-order 32 bits of the virtual address that the failing instruction tried to reference. |
| PC | PC whose execution resulted in the exception. |
| PS | PS at the time of the exception. |
2.7.2.4. 64-Bit Signal Array
The 64-bit signal array also appears further down the stack. This array comprises all quadwords and is not VAX compatible. It contains the same data as the signal array, and Figure 2.4, ''64-Bit Signal Array'' shows the 64-bit signal array for an access violation. The SDA SHOW STACK command uses the CHF64$ symbols listed in the figure to identify the 64-bit signal array on the stack.
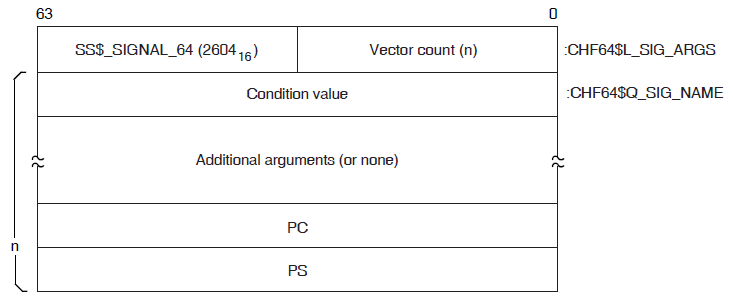
For access violations, the 64-bit signal array is set up as follows:
| Value | Meaning |
|---|---|
| Vector list length | Number of quadwords that follow. For access violations, this value is always 5. |
| Condition value | Exception code. The value 0C 16 represents an access violation. You can identify the exception code by using the SDA command EVALUATE/CONDITION_VALUE or SHOW CRASH. |
| Additional arguments | These can include a reason mask and a virtual address. In the quadword mask if bit 0 of the quadword is set, the failing instruction (at the PC saved below) caused a length violation. If bit 1 is set, it referred to a location whose page table entry is in a "no access" page. Bit 2 indicates the type of access used by the failing instruction: it is set for write and modify operations and clear for read operations. |
| PC | PC whose execution resulted in the exception. |
| PS | PS at the time of the exception. |
2.7.2.5. Alpha Exception Stack Frame
The figure below illustrates the Alpha exception stack frame, which comprises all quadwords.
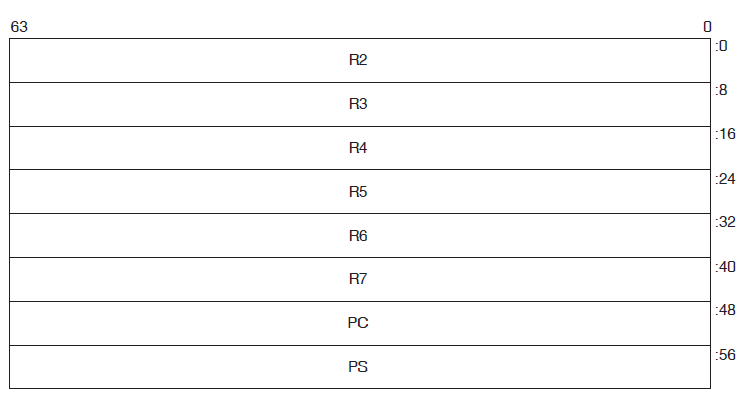
The values contained in the exception stack frame are defined as follows:
| Value | Contents |
|---|---|
| INTSTK$Q_R2 | Contents of R2 at the time of the exception |
| INTSTK$Q_R3 | Contents of R3 at the time of the exception |
| INTSTK$Q_R4 | Contents of R4 at the time of the exception |
| INTSTK$Q_R5 | Contents of R5 at the time of the exception |
| INTSTK$Q_R6 | Contents of R6 at the time of the exception |
| INTSTK$Q_R7 | Contents of R7 at the time of the exception |
| INTSTK$Q_PC | PC whose execution resulted in the exception |
| INTSTK$Q_PS | PS at the time of the exception (except high-order bits) |
The SDA SHOW STACK command identifies the elements of the exception stack frame on the stack using these symbols.
2.7.2.6. IA-64 Exception Stack Frame
Two figures below illustrate the IA-64 exception stack frame.
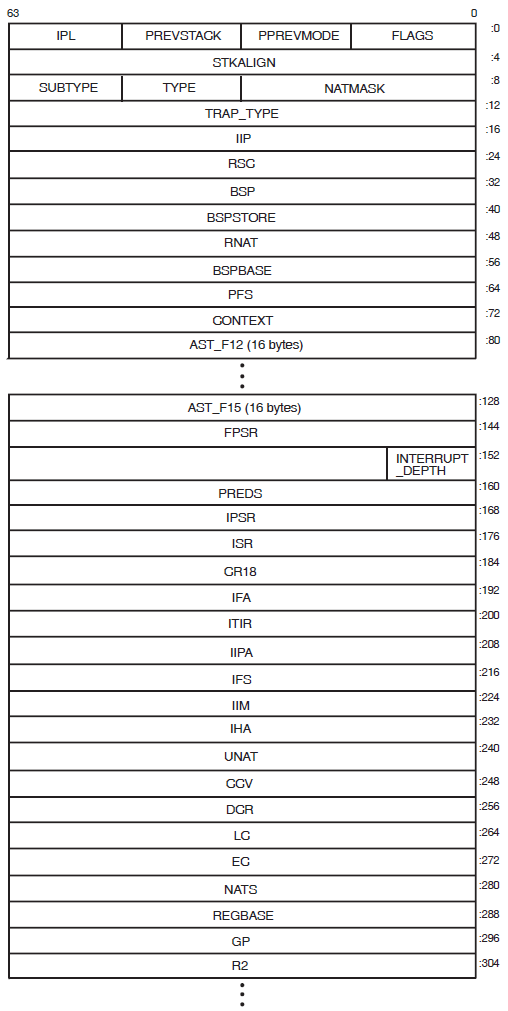
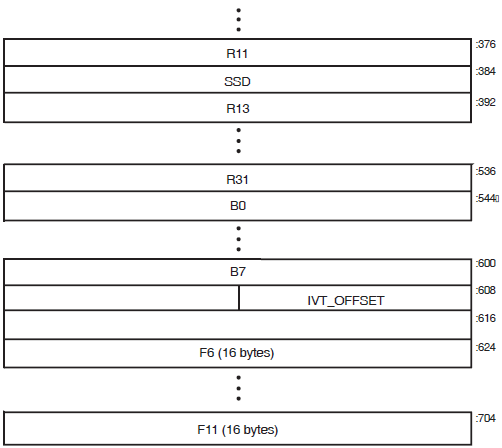
The values contained in the exception stack frame are defined in the table below.
| Field | Use |
|---|---|
| INTSTK$B_FLAGS | Indicates if certain registers have been saved. |
| INTSTK$B_PPREVMODE | Save interrupted context's PREVMODE. |
| INTSTK$B_PREVSTACK | Indicates which mode of stack (register and memory) we return to. |
| INTSTK$B_IPL | SWIS IPL state |
| INTSTK$L_STKALIGN | How much allocated on this stack for exception frame. |
| INTSTK$W_NATMASK | Mask of bits 3-9 of the exception frame address. |
| INTSTK$B_TYPE | Standard VMS structure type. |
| INTSTK$B_SUBTYPE | Standard VMS structure subtype. |
| INTSTK$L_TRAP_TYPE | Trap type. |
| INTSTK$Q_IIP | Interruption Instruction Pointer (CR19). |
| INTSTK$Q_RSC | Register Stack Control register. |
| INTSTK$Q_BSP | Backing store pointer. |
| INTSTK$Q_BSPSTORE | User BSP store pointer for next spill. |
| INTSTK$Q_RNAT | RNAT register. |
| INTSTK$Q_BSPBASE | Base of backing store for the inner mode. |
| INTSTK$Q_PFS | Previous function state. |
| INTSTK$Q_CONTEXT | Bookkeeping data for exception processing. |
| INTSTK$Q_AST_F12 through INTSTK$Q_AST_F15 | F12 to F15 - temporary FP registers; sometimes saved by AST. |
| INTSTK$Q_FPSR | Floating point status register. |
| INTSTK$B_INTERRUPT_DEPTH | Interrupt depth. |
| INTSTK$Q_PREDS | Predication registers. |
| INTSTK$Q_IPSR | Interruption Processor Status (CR16). |
| INTSTK$Q_ISR | Interruption Status Register (CR17). |
| INTSTK$Q_CR18 | Reserved control register. |
| INTSTK$Q_IFA | Interruption Fault Address (CR20). |
| INTSTK$Q_ITIR | Interruption TLB Insertion Register (CR21). |
| INTSTK$Q_IIPA | Interruption immediate register (CR22). |
| INTSTK$Q_IFS | Interruption Function State (CR23). |
| INTSTK$Q_IIM | Interruption immediate (CR24). |
| INTSTK$Q_IHA | Interruption Hash Address (CR25). |
| INTSTK$Q_UNAT | User NAT collection register. |
| INTSTK$Q_CCV | CCV register. |
| INTSTK$Q_DCR | Default control register. |
| INTSTK$Q_LC | Loop counter. |
| INTSTK$Q_EC | Epilogue counter. |
| INTSTK$Q_NATS | NATs for registers saved in this structure. |
| INTSTK$Q_REGBASE | Used to index into registers. |
| INTSTK$Q_GP | r1 - Used as global pointer. |
| INTSTK$Q_R2 | r2 - temporary register. |
| INTSTK$Q_R3 | r3 - temporary register. |
| INTSTK$Q_R4 through R7 | r4 through r7 - preserved registers (not saved by interrupt). |
| INTSTK$Q_R8 | r8 - return value. |
| INTSTK$Q_R9 | r9 - argument pointer. |
| INTSTK$Q_R10 | r10 - temporary register. |
| INTSTK$Q_R11 | r11 - temporary register. |
| INTSTK$Q_SSD | For future use. |
| INTSTK$Q_R13 | r13 - Thread Pointer. |
| INTSTK$Q_R14 through R31 | r14 through r31 - temporary registers. |
| INTSTK$Q_B0 | Return pointer on kernel entry. |
| INTSTK$Q_B1 through B5 | b1 through b5 - Preserved branch registers (not saved by interrupt). |
| INTSTK$Q_B6 | b6 - temporary branch register. |
| INTSTK$Q_B7 | b7 - temporary branch register. |
| INTSTK$L_IVT_OFFSET | Offset in IVT. |
| INTSTK$Q_F6 through F11 | f6 through f11 - temporary FP registers. |
2.7.2.7. SSRVEXCEPT Example
If OpenVMS encounters a fatal exception, you can find the code that signaled it by examining the PC in the signal array. Use the SHOW CRASH or CLUE CRASH command to display the PC and the instruction stream around the PC to locate the exception.
The following display shows the SDA output in response to the SHOW CRASH and SHOW STACK commands for an Alpha SSRVEXCEPT bugcheck. It illustrates the mechanism array, signal arrays, and the exception stack frame previously described.
OpenVMS (TM) Alpha system dump analyzer
...analyzing a selective memory dump...

Dump taken on 30-AUG-2000 13:13:46.83
SSRVEXCEPT, Unexpected system service exception

SDA>  SHOW CRASH
Time of system crash: 30-AUG-1996 13:13:46.83


Version of system: OpenVMS (TM) Alpha Operating System, Version V7.3

System Version Major ID/Minor ID: 3/0


System type: DEC 3000 Model 400

Crash CPU ID/Primary CPU ID:  00/00

Bitmask of CPUs active/available:  00000001/00000001


CPU bugcheck codes:
        CPU 00 -- SSRVEXCEPT, Unexpected system service exception

System State at Time of Exception
---------------------------------
Exception Frame:
----------------
        R2  = 00000000.00000003
        R3  = FFFFFFFF.80C63460  EXCEPTION_MON_NPRW+06A60
        R4  = FFFFFFFF.80D12740  PCB
        R5  = 00000000.000000C8
        R6  = 00000000.00030038
        R7  = 00000000.7FFA1FC0
        PC  = 00000000.00030078
        PS  = 00000000.00000003

         00000000.00030068:     STQ             R27,(SP)
         00000000.0003006C:     BIS             R31,SP,FP
         00000000.00030070:     STQ             R26,#X0010(SP)
         00000000.00030074:     LDA             R28,(R31)
   PC => 00000000.00030078:     LDL             R28,(R28)
         00000000.0003007C:     BEQ             R28,#X000007
         00000000.00030080:     LDQ             R26,#XFFE8(R27)
         00000000.00030084:     BIS             R31,R26,R0
         00000000.00030088:     BIS             R31,FP,SP

   PS =>
         MBZ SPAL      MBZ    IPL VMM MBZ CURMOD INT PRVMOD
         0   00   00000000000 00  0   0   KERN   0   USER


Signal Array
------------
        Length = 00000005
        Type   = 0000000C
        Arg    = 00000000.00010000
        Arg    = 00000000.00000000
        Arg    = 00000000.00030078
        Arg    = 00000000.00000003
%SYSTEM-F-ACCVIO, access violation, reason mask=00, virtual address=0000000000000000,
   PC=0000000000030078, PS=00000003

Saved Scratch Registers in Mechanism Array
------------------------------------------
R0   = 00000000.00020000  R1   = 00000000.00000000  R16  = 00000000.00020004
R17  = 00000000.00010050  R18  = FFFFFFFF.FFFFFFFF  R19  = 00000000.00000000
R20  = 00000000.7FFA1F50  R21  = 00000000.00000000  R22  = 00000000.00010050
R23  = 00000000.00000000  R24  = 00000000.00010051  R25  = 00000000.00000000
R26  = FFFFFFFF.8010ACA4  R27  = 00000000.00010050  R28  = 00000000.00000000

CPU 00 Processor crash information
----------------------------------


CPU 00 reason for Bugcheck: SSRVEXCEPT, Unexpected system service exception


Process currently executing on this CPU: SYSTEM


Current image file: $31$DKB0:[SYS0.][SYSMGR]X.EXE;1


Current IPL: 0  (decimal)


CPU database address:  80D0E000


CPUs Capabilities:    PRIMARY,QUORUM,RUN

General registers:

R0   = 00000000.00000000  R1   = 00000000.7FFA1EB8  R2   = FFFFFFFF.80D0E6C0
R3   = FFFFFFFF.80C63460  R4   = FFFFFFFF.80D12740  R5   = 00000000.000000C8
R6   = 00000000.00030038  R7   = 00000000.7FFA1FC0  R8   = 00000000.7FFAC208
R9   = 00000000.7FFAC410  R10  = 00000000.7FFAD238  R11  = 00000000.7FFCE3E0
R12  = 00000000.00000000  R13  = FFFFFFFF.80C6EB60  R14  = 00000000.00000000
R15  = 00000000.009A79FD  R16  = 00000000.000003C4  R17  = 00000000.7FFA1D40
R18  = FFFFFFFF.80C05C38  R19  = 00000000.00000000  R20  = 00000000.7FFA1F50
R21  = 00000000.00000000  R22  = 00000000.00000001  R23  = 00000000.7FFF03C8
R24  = 00000000.7FFF0040  AI   = 00000000.00000003  RA   = FFFFFFFF.82A21080
PV   = FFFFFFFF.829CF010  R28  = FFFFFFFF.8004B6DC  FP   = 00000000.7FFA1CA0
PC   = FFFFFFFF.82A210B4  PS   = 18000000.00000000


Processor Internal Registers:


ASN  = 00000000.0000002F                     ASTSR/ASTEN =          0000000F
IPL  =          00000000  PCBB = 00000000.003FE080  PRBR = FFFFFFFF.80D0E000
PTBR = 00000000.00001136  SCBB = 00000000.000001DC  SISR = 00000000.00000000
VPTB = FFFFFFFC.00000000  FPCR = 00000000.00000000  MCES = 00000000.00000000

CPU 00 Processor crash information
----------------------------------


        KSP    = 00000000.7FFA1C98
        ESP    = 00000000.7FFA6000
        SSP    = 00000000.7FFAC100
        USP    = 00000000.7AFFBAD0

No spinlocks currently owned by CPU 00SDA> SHOW STACK
Current Operating Stack (KERNEL):
00000000.7FFA1C78 18000000.00000000
00000000.7FFA1C80 00000000.7FFA1CA0
00000000.7FFA1C88 00000000.00000000
00000000.7FFA1C90 00000000.7FFA1D40
SP => 00000000.7FFA1C98 00000000.00000000
00000000.7FFA1CA0 FFFFFFFF.829CF010 EXE$EXCPTN
00000000.7FFA1CA8 FFFFFFFF.82A2059C EXCEPTION_MON_PRO+0259C
00000000.7FFA1CB0 00000000.00000000
00000000.7FFA1CB8 00000000.7FFA1CD0
00000000.7FFA1CC0 FFFFFFFF.829CEDA8 EXE$SET_PAGES_READ_ONLY+00948
00000000.7FFA1CC8 00000000.00000000
00000000.7FFA1CD0 FFFFFFFF.829CEDA8 EXE$SET_PAGES_READ_ONLY+00948
00000000.7FFA1CD8 00000000.00000000
00000000.7FFA1CE0 FFFFFFFF.82A1E930 EXE$CONTSIGNAL_C+001D0
00000000.7FFA1CE8 00000000.7FFA1F40
00000000.7FFA1CF0 FFFFFFFF.80C63780 EXE$ACVIOLAT
00000000.7FFA1CF8 00000000.7FFA1EB8
00000000.7FFA1D00 00000000.7FFA1D40
00000000.7FFA1D08 00000000.7FFA1F00
00000000.7FFA1D10 00000000.7FFA1F40
00000000.7FFA1D18 00000000.00000000
00000000.7FFA1D20 00000000.00000000
00000000.7FFA1D28 00000000.00020000 SYS$K_VERSION_04
00000000.7FFA1D30 00000005.00000250 BUG$_NETRCVPKT
00000000.7FFA1D38 829CE050.000008F8 BUG$_SEQ_NUM_OVF
CHF$IS_MCH_ARGS 00000000.7FFA1D40 00000000.0000002C
CHF$PH_MCH_FRAME 00000000.7FFA1D48 00000000.7AFFBAD0
CHF$IS_MCH_DEPTH 00000000.7FFA1D50 FFFFFFFF.FFFFFFFD
CHF$PH_MCH_DADDR 00000000.7FFA1D58 00000000.00000000
CHF$PH_MCH_ESF_ADDR 00000000.7FFA1D60 00000000.7FFA1F00
CHF$PH_MCH_SIG_ADDR 00000000.7FFA1D68 00000000.7FFA1EB8
CHF$IH_MCH_SAVR0 00000000.7FFA1D70 00000000.00020000 SYS$K_VERSION_04
CHF$IH_MCH_SAVR1 00000000.7FFA1D78 00000000.00000000
CHF$IH_MCH_SAVR16 00000000.7FFA1D80 00000000.00020004 UCB$M_LCL_VALID+00004
CHF$IH_MCH_SAVR17 00000000.7FFA1D88 00000000.00010050 SYS$K_VERSION_16+00010
CHF$IH_MCH_SAVR18 00000000.7FFA1D90 FFFFFFFF.FFFFFFFF
CHF$IH_MCH_SAVR19 00000000.7FFA1D98 00000000.00000000
CHF$IH_MCH_SAVR20 00000000.7FFA1DA0 00000000.7FFA1F50
CHF$IH_MCH_SAVR21 00000000.7FFA1DA8 00000000.00000000
CHF$IH_MCH_SAVR22 00000000.7FFA1DB0 00000000.00010050 SYS$K_VERSION_16+00010
CHF$IH_MCH_SAVR23 00000000.7FFA1DB8 00000000.00000000
CHF$IH_MCH_SAVR24 00000000.7FFA1DC0 00000000.00010051 SYS$K_VERSION_16+00011
CHF$IH_MCH_SAVR25 00000000.7FFA1DC8 00000000.00000000
CHF$IH_MCH_SAVR26 00000000.7FFA1DD0 FFFFFFFF.8010ACA4 AMAC$EMUL_CALL_NATIVE_C+000A4
CHF$IH_MCH_SAVR27 00000000.7FFA1DD8 00000000.00010050 SYS$K_VERSION_16+00010
CHF$IH_MCH_SAVR28 00000000.7FFA1DE0 00000000.00000000
00000000.7FFA1DE8 00000000.00000000
00000000.7FFA1DF0 00000000.00000000
00000000.7FFA1DF8 00000000.00000000
00000000.7FFA1E00 00000000.00000000
00000000.7FFA1E08 00000000.00000000
00000000.7FFA1E10 00000000.00000000
00000000.7FFA1E18 00000000.00000000
00000000.7FFA1E20 00000000.00000000
00000000.7FFA1E28 00000000.00000000
00000000.7FFA1E30 00000000.00000000
00000000.7FFA1E38 00000000.00000000
00000000.7FFA1E40 00000000.00000000
00000000.7FFA1E48 00000000.00000000
00000000.7FFA1E50 00000000.00000000
00000000.7FFA1E58 00000000.00000000
00000000.7FFA1E60 00000000.00000000
00000000.7FFA1E68 00000000.00000000
00000000.7FFA1E70 00000000.00000000
00000000.7FFA1E78 00000000.00000000
00000000.7FFA1E80 00000000.00000000
00000000.7FFA1E88 00000000.00000000
00000000.7FFA1E90 00000000.00000000
00000000.7FFA1E98 00000000.00000000
CHF$PH_MCH_SIG64_ADDR 00000000.7FFA1EA0 00000000.7FFA1ED0
00000000.7FFA1EA8 00000000.00000000
00000000.7FFA1EB0 00000000.7FFA1F50
00000000.7FFA1EB8 0000000C.00000005
00000000.7FFA1EC0 00000000.00010000 SYS$K_VERSION_07
00000000.7FFA1EC8 00000003.00030078 SYS$K_VERSION_01+00078
CHF$L_SIG_ARGS 00000000.7FFA1ED0 00002604.00000005 UCB$M_TEMPLATE+00604
CHF$L_SIG_ARG1 00000000.7FFA1ED8 00000000.0000000C
00000000.7FFA1EE0 00000000.00010000 SYS$K_VERSION_07
00000000.7FFA1EE8 00000000.00000000
00000000.7FFA1EF0 00000000.00030078 SYS$K_VERSION_01+00078
00000000.7FFA1EF8 00000000.00000003
INTSTK$Q_R2 00000000.7FFA1F00 00000000.00000003
INTSTK$Q_R3 00000000.7FFA1F08 FFFFFFFF.80C63460 EXCEPTION_MON_NPRW+06A60
INTSTK$Q_R4 00000000.7FFA1F10 FFFFFFFF.80D12740 PCB
INTSTK$Q_R5 00000000.7FFA1F18 00000000.000000C8
INTSTK$Q_R6 00000000.7FFA1F20 00000000.00030038 SYS$K_VERSION_01+00038
INTSTK$Q_R7 00000000.7FFA1F28 00000000.7FFA1FC0
INTSTK$Q_PC 00000000.7FFA1F30 00000000.00030078 SYS$K_VERSION_01+00078
INTSTK$Q_PS 00000000.7FFA1F38 00000000.00000003
Prev SP (7FFA1F40) ==> 00000000.7FFA1F40 00000000.00010050 SYS$K_VERSION_16+00010
00000000.7FFA1F48 00000000.00010000 SYS$K_VERSION_07
00000000.7FFA1F50 FFFFFFFF.8010ACA4 AMAC$EMUL_CALL_NATIVE_C+000A4
00000000.7FFA1F58 00000000.7FFA1F70
00000000.7FFA1F60 00000000.00000001
00000000.7FFA1F68 FFFFFFFF.800EE81C RM_STD$DIRCACHE_BLKAST_C+005AC
00000000.7FFA1F70 FFFFFFFF.80C6EBA0 SCH$CHSEP+001E0
00000000.7FFA1F78 00000000.829CEDE8 EXE$SIGTORET
00000000.7FFA1F80 00010050.00000002 SYS$K_VERSION_16+00010
00000000.7FFA1F88 00000000.00020000 SYS$K_VERSION_04
00000000.7FFA1F90 00000000.00030000 SYS$K_VERSION_01
00000000.7FFA1F98 FFFFFFFF.800A4D64 EXCEPTION_MON_NPRO+00D64
00000000.7FFA1FA0 00000000.00000003
00000000.7FFA1FA8 FFFFFFFF.80D12740 PCB
00000000.7FFA1FB0 00000000.00010000 SYS$K_VERSION_07
00000000.7FFA1FB8 00000000.7AFFBAD0
00000000.7FFA1FC0 00000000.7FFCF880 MMG$IMGHDRBUF+00080
00000000.7FFA1FC8 00000000.7B0E9851
00000000.7FFA1FD0 00000000.7FFCF818 MMG$IMGHDRBUF+00018
00000000.7FFA1FD8 00000000.7FFCF938 MMG$IMGHDRBUF+00138
00000000.7FFA1FE0 00000000.7FFAC9F0
00000000.7FFA1FE8 00000000.7FFAC9F0
00000000.7FFA1FF0 FFFFFFFF.80000140 SYS$PUBLIC_VECTORS_NPRO+00140
00000000.7FFA1FF8 00000000.0000001B
.
.
.2.7.2.8. Illegal Page Faults
When an illegal page fault occurs, the stack appears as pictured in the figure below.
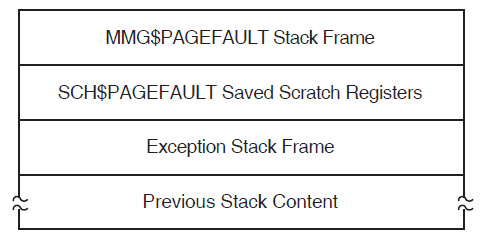
The stack contents are as follows:
| MMG$PAGEFAULT Stack Frame | Stack frame built at entry to MMG$PAGEFAULT, the page fault exception service routine. On Alpha, the frame includes the contents of the following registers at the time of the page fault: R3, R8, R11 to R15, R29 (frame pointer) |
| SCH$PAGEFAULT Saved Scratch Registers (Alpha only) | Contents of the following registers at the time of the page fault: R0, R1, R16 to R28 |
| Exception Stack Frame | Exception stack frame ---see Figure 2.5, ''Alpha Exception Stack Frame'', Figure 2.6, ''IA-64 Exception Stack Frame'' and Figure 2.7, ''IA-64 Exception Stack Frame (cont.)''. |
| Previous Stack Content | Contents of the stack prior to the illegal page-fault error |
When you analyze a dump caused by a PGFIPLHI bugcheck, the SHOW STACK command identifies the exception stack frame using the symbols shown in Table 2.12, ''Alpha Exception Stack Frame Values'' or Table 2.13, ''IA-64 Exception Stack Frame Values''. The SHOW CRASH or CLUE CRASH command displays the instruction that caused the page fault and the instructions around it.
2.8. Page Protections and Access Rights
Page protections and access rights are different on Alpha and IA-64 systems. They are visible in output from the following commands:
SHOW PAGE
SHOW PROCESS/PAGE
EXAMINE/PTE
EVALUATE/PTE
Due to system differences, there is a need to distinguish "Write+Read+Execute" from "Write+Read" and to distinguish "Read+Execute" from "Read".
On an Alpha system, W=W+R+E and R=R+E but on an IA-64 system, additional w and r indicators are introduced for non-execute cases.
On Alpha, page protection is described by 8 bits--- one Read bit for each mode, and one Write Bit. Therefore in the "Read" column, there might be KESU (read access in all modes) or K--- (read access in Kernel mode only) or NONE (no read access). Similarly in the "Writ" column. Not all combinations of the 8 bits are possible (for example, Write access for a mode implies Read access at that mode and both Read and Write access for all inner modes).
On IA-64, page protection is described by 5 bits, a combination of the Access Rights and Privilege Level fields. SDA interprets these with a single character to describe access in each mode, as shown in the table below.
| Code | Meaning |
|---|---|
| r | Read |
| w | Read, Write |
| R | Read, Execute |
| W | Read, Write, Execute |
| X | Execute |
| K | Promote to Kernel |
| E | Promote to Executive |
| S | Promote to Supervisor |
| - | No access |
For example WRRR means Kernel mode has Read+Write+Execute access; all other modes have Read+Execute access.
2.9. Inducing a System Failure
If the operating system is not performing well and you want to create a dump you can examine, you must induce a system failure. Occasionally, a device driver or other user-written, kernel-mode code can cause the system to execute a loop of code at a high priority, interfering with normal system operation. This loop can occur even though you have set a breakpoint in the code if the loop is encountered before the breakpoint. To gain control of the system in such circumstances, you must cause the system to fail and then reboot it.
If the system has suspended all noticeable activity and is hung, see the examples of causing system failures in Section 2.9.2, ''Procedure for Causing a System Failure''.
If you are generating a system failure in response to a system hang, be sure to record the PC and PS as well as the contents of the integer registers at the time of the system halt.
2.9.1. Meeting Crash Dump Requirements
The following requirements must be met before the operating system can write a complete crash dump:
You must not halt the system until the console dump messages have been printed in their entirety and the memory contents have been written to the crash dump file. Be sure to allow sufficient time for these events to take place or make sure that all disk activity has stopped before using the console to halt the system.
There must be a crash dump file in SYS$SPECIFIC:[SYSEXE]: named either SYSDUMP.DMP or PAGEFILE.SYS.
This dump file must be either large enough to hold the entire contents of memory (as discussed in Section 2.2.1.1, ''Dump File Style'') or, if the DUMPSTYLE system parameter is set, large enough to accommodate a subset or compressed dump (also discussed in Section 2.2.1.1, ''Dump File Style'').
If SYSDUMP.DMP is not present, the operating system attempts to write crash dumps to PAGEFILE.SYS. In this case, the SAVEDUMP system parameter must be 1 (the default is 0).
Alternatively, the system must be set up for DOSD. See Section 2.2.1.5, ''Writing to a Dump File off the System Disk'', and the VSI OpenVMS System Manager's Manual, Volume 2: Tuning, Monitoring, and Complex Systems for details.
The DUMPBUG system parameter must be 1 (the default is 1).
2.9.2. Procedure for Causing a System Failure
This section tells you how to enter the XDelta utility (XDELTA) to force a system failure.
Before you can use XDelta, it must be loaded at system startup. To load XDelta during system bootstrap, you must set bit 1 in the boot flags. See the VSI OpenVMS Version 8.4 Upgrade and Installation Manual for information about booting with the XDelta utility.
On Alpha, put the system in console mode by pressing Ctrl/P or the Halt push button. Enter the following commands at the console prompt to enter XDelta:
>>> DEPOSIT SIRR E
>>> CONTINUE
On IA-64, enter XDELTA by pressing Ctrl/P at the console.
Once you have entered XDelta, use any valid XDelta commands to examine register or memory locations, step through code, or force a system failure (by entering ;C under XDelta). See the VSI OpenVMS Delta/XDelta Debugger Manual for more information about using XDelta.
On Alpha, if you did not load XDelta, you can force a system crash by entering console commands that make the system incur an exception at high IPL. At the console prompt, enter commands to set the program counter (PC) to an invalid address and the PS to kernel mode at IPL 31 before continuing. This results in a forced INVEXCEPTN-type bugcheck. Some VSI Alpha computers employ the console command CRASH (which will force a system failure) while other systems require that you manually enter the commands.
Enter the following commands at the console prompt to force a system failure:
>>> DEPOSIT PC FFFFFFFFFFFFFF00
>>> DEPOSIT PS 1F00
>>> CONTINUE
For more information, refer to the hardware manuals that accompanied your Alpha computer.
On IA-64, pressing Ctrl/P when XDelta is not loaded causes the OpenVMS system to output the following:
Crash (y/n):
A response of Y forces a system crash; entering any other character lets the system continue processing.
Chapter 3. ANALYZE Usage
This chapter describes the format, usage, and qualifiers of the System Dump Analyzer (SDA) utility.
The System Dump Analyzer (SDA) utility helps determine the causes of system failures. This utility is also useful for examining the running system.
3.1. ANALYZE
ANALYZE
ANALYZE
Format
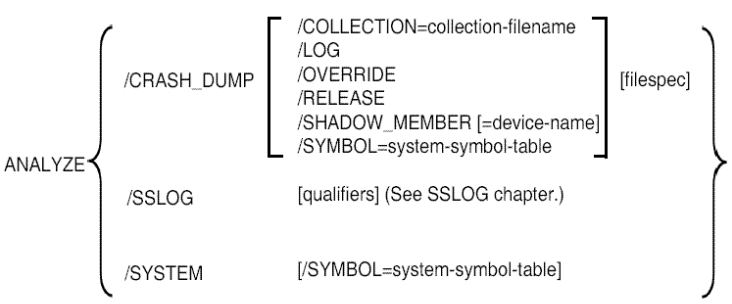
Parameters
collection-file-name
Name of the file that contains the file ID translation data or unwind data to be used by SDA.
device-name
The device containing the system dump.
filespec
Name of the file(s) that contain the dump you want to analyze.
If filespec is not specified in an ANALYZE/CRASH_DUMP command, the default is the highest version of SYS$SYSTEM:SYSDUMP.DMP. If this file does not exist or cannot be opened, SDA prompts you for a file name. If any field of filespec is provided, the remaining fields default to the highest version of SYSDUMP.DMP in your default directory.
filespec can be a comma-separated list of files, including wildcards, where all the files contain Partial Dump Copies from the same original dump. See Section 2.2.3, ''Partial Dump Copies'' for a description of Partial Dump Copies. The following restrictions apply when multiple files are specified:
Files are opened in the order they are specified.
The file that contains System Page Tables (section PT) must be the first file opened. This is the Primary dump file.
If using a wildcard to specify file names, the primary dump file must be the first file to match the wildcard.
The files specified must be part of the same original crash dump.
If any section of the dump is found in multiple input files, SDA issues a warning, but continues.
If the file or unwind data collection is in a separate file, it must have the same name and location as the primary dump file, with file type .COLLECT, or must be specified using the /COLLECTION qualifier.
The files specified must either be all compressed or all uncompressed. They cannot be mixed.
You cannot specify filespec for ANALYZE/SYSTEM.
system-symbol-table
The system symbol table used by SDA.
Qualifiers
The /CRASH_DUMP and /SYSTEM qualifiers (described in this chapter) specify whether the object of an SDA session is a crash dump or a running system. Additional qualifiers used with these help to create the environment of an SDA session. The /SSLOG qualifier specifies that data be collected by the System Service Logging utility, which is documented in Chapter 14, "System Service Logging".
/COLLECTION
/LOG
/CRASH_DUMP
/OVERRIDE
/RELEASE
/SHADOW_MEMBER
/SSLOG
/SYMBOL
/SYSTEM
The only additional qualifiers that can be used when invoking ANALYZE/SYSTEM are /LOG and /SYMBOL. See Chapter 14 for details of additional qualifiers that can be used when invoking ANALYZE/SSLOG. The following table shows which combinations of additional qualifiers can be used together when invoking ANALYZE/CRASH_DUMP:
| /OVERRIDE | /RELEASE | /SHADOW | /SYMBOL | |
| /COLLECTION | No | No | Yes | yes |
| /OVERRIDE | -- | No | Yes | See note |
| /RELEASE | -- | -- | No | See note |
| /SHADOW | -- | -- | -- | Yes |
Note
/LOG can be used with any valid combination of qualifiers. /SYMBOL is ignored if it is specified with /OVERRIDE or /RELEASE.
The qualifiers are described on the following pages.
Description
By default, the System Dump Analyzer is automatically invoked when you reboot the system after a system failure.
To analyze a system dump interactively, invoke SDA by issuing the following command:
$ ANALYZE/CRASH_DUMP filespec
If you do not specify filespec, and SYS$SYSTEM:SYSDUMP.DMP does not exist or cannot be opened, SDA prompts you for a file name.
To analyze a crash dump, your process must have the privileges necessary for reading the dump file. This usually requires system privilege (SYSPRV), but your system manager can, if necessary, allow less privileged processes to read the dump files. Your process needs change-mode-to-kernel (CMKRNL) privilege to release page file dump blocks, whether you use the /RELEASE qualifier or the SDA COPY command.
Invoke SDA to analyze a running system by issuing the following command:
$ ANALYZE/SYSTEM
To examine a running system, your process must have change-mode-to-kernel (CMKRNL) privilege. Your process must also have the map-by-PFN privilege (PFNMAP) to access memory by physical address on a running system. You cannot specify filespec when using the /SYSTEM qualifier.
To send all output from SDA to a file, use the SDA command SET OUTPUT, specifying the name of the output file. The file produced is 132 columns wide and is formatted for output to a printer. To later redirect the output to your terminal, use the following command:
SDA> SET OUTPUT SYS$OUTPUT
To send a copy of all the commands you type and a copy of all the output those commands produce to a file, use the SDA command SET LOG, specifying the name of the log file. The file produced is 132 columns wide and is formatted for output to a printer.
To exit from SDA, use the EXIT command. Note that the EXIT command also causes SDA to exit from display mode. Thus, if SDA is in display mode, you must use the EXIT command twice: once to exit from display mode, and a second time to exit from SDA. See Section 2.6.2, ''SDA Display Mode'' for a description of display mode.
3.2. /COLLECTION
/COLLECTION
/COLLECTION — Valid for Alpha and IA-64 systems only. Indicates to SDA that the file ID translation data or unwind data is to be found in a separate file.
Format
/COLLECTION = collection-file-name
At least one field of the collection file name must be specified. Other fields default to the highest generation of the same file name and location as the dump file, with a file type of .COLLECT.
Description
SDA can provide additional information when analyzing a dump if a collection has been made of file identification translation data (on both Alpha and IA-64) and of unwind data (on IA-64 only). This data is usually saved when the dump file is copied using the SDA COPY/COLLECT command, but it can be saved to a separate file using the COLLECT/SAVE command.
By default, COLLECT/SAVE creates a .COLLECT file with the same name and in the same directory as the dump file. A subsequent ANALYZE/CRASH_DUMP command automatically uses this file. If the collection file is in a different location or if the collection previously appended to the dump file is incomplete (for example, if a disk was not mounted at the time of the SDA COPY), you can use the /COLLECTION qualifier to specify an alternate collection file.
Example
$ ANALYZE/CRASH_DUMP SYS$SYSTEM:SYSDUMP.DMP
...
SDA> COLLECT/SAVE=SYS$LOGIN:NEWCOLL.COLLECT
SDA> EXIT
$ ANALYZE/CRASH_DUMP SYS$SYSTEM:SYSDUMP.DMP /COLLECTION=SYS$LOGIN:NEWCOLL
...
3.3. /CRASH_DUMP
/CRASH_DUMP
/CRASH_DUMP — Invokes SDA to analyze the specified dump file.
Format
/CRASH_DUMP [filespec]
Parameter
- filespec
Name of the file that contains the dump you want to analyze. If no filespec is given on an ANALYZE/CRASH_DUMP command, the default is the highest version of SYS$SYSTEM:SYSDUMP.DMP. If this file does not exist, SDA prompts you for a file name. If any field of filespec is given, the remaining fields default to the highest version of SYSDUMP.DMP in your default directory.
Description
See Section 2.3, ''Analyzing a System Dump'' for additional information on crash dump analysis. You cannot specify the /SYSTEM qualifier when you include the /CRASH_DUMP qualifier in the ANALYZE command.
Examples
$ ANALYZE/CRASH_DUMP SYS$SYSTEM:SYSDUMP.DMP
$ ANALYZE/CRASH SYS$SYSTEM
These commands invoke SDA to analyze the crash dump stored in SYS$SYSTEM:SYSDUMP.DMP.
$ ANALYZE/CRASH SYS$SYSTEM:PAGEFILE.SYS
This command invokes SDA to analyze a crash dump stored in the system page file.
3.4. /LOG
/LOG
/LOG — Causes SDA to display the names of the files opened because SDA initializes itself.
Format
/LOG
Parameters
None.
Description
SDA displays the names of the files opened because SDA initializes itself. Note that this does not affect the behavior of commands within SDA such as READ, but only files opened when SDA is initialized.
/LOG can be used on ANALYZE /CRASH_DUMP and ANALYZE /SYSTEM.
Examples
$ ANALYZE/CRASH_DUMP /LOG T*
%SDA-I-OPENED, opened USER$:[SYSMGR]T1.DMP;1 as dump file #1
%SDA-I-OPENED, opened SYS$COMMON:[SYS$LDR]SYS$BASE_IMAGE.EXE;1 as symbol file
%SDA-I-OPENED, opened USER$:[SYSMGR]T2.DMP;1 as dump file #2

OpenVMS system dump analyzer
...analyzing an I64 compressed selective memory dump...

%SDA-I-OPENED, opened SYS$COMMON:[SYS$LDR]REQSYSDEF.STB;1 as symbol file
Dump taken on 14-DEC-2009 17:16:31.35 using version XC6G-J2I
SSRVEXCEPT, Unexpected system service exception

$ SDA>
This example shows the use of the /LOG qualifier to identify the set of files being used by SDA.
3.5. /OVERRIDE
/OVERRIDE
/OVERRIDE — When used with the /CRASH_DUMP qualifier, invokes SDA to analyze only the structure of the specified dump file when a corruption or other problem prevents normal invocation of SDA with the ANALYZE/CRASH_DUMP command.
Format
/CRASH_DUMP/OVERRIDE [filespec]
Parameter
- filespec
Name of the crash dump file to be analyzed. The default file specification is:
SYS$DISK:[default-dir]SYSDUMP.DMP
SYS$DISK and [default-dir] represent the disk and directory specified in your last SET DEFAULT command. If you do not specify filespec, and SYS$SYSTEM:SYSDUMP.DMP does not exist or cannot be opened, SDA prompts you for it.
Description
See Section 2.3, ''Analyzing a System Dump'' for additional information on crash dump analysis. Note that when SDA is invoked with /OVERRIDE, not all the commands in Section 2.3, ''Analyzing a System Dump'' can be used. Commands that can be used are as follows:
Output control commands such as SET OUTPUT and SET LOG
Dump file related commands such as SHOW DUMP and CLUE ERRLOG
Commands that cannot be used are as follows:
Commands that access memory addresses within the dump file such as EXAMINE and SHOW SUMMARY
Also, the /RELEASE qualifier cannot be used when you include the /OVERRIDE qualifier in the ANALYZE/CRASH_DUMP command.
When /OVERRIDE is used, the SDA command prompt is SDA>>.
Example
$ ANALYZE/CRASH_DUMP/OVERRIDE SYS$SYSTEM:SYSDUMP.DMP
$ ANALYZE/CRASH/OVERRIDE SYS$SYSTEM
These commands invoke SDA to analyze the crash dump stored in SYS$SYSTEM:SYSDUMP.DMP.
3.6. /RELEASE
/RELEASE
/RELEASE — Invokes SDA to release those blocks in the specified system page file occupied by a crash dump. Requires CMKRNL (change-mode-to-kernel) privilege.
Format
/CRASH_DUMP/RELEASE filespec
Parameter
- filespec
Name of the system page file (SYS$SYSTEM:PAGEFILE.SYS). Because the default file specification is SYS$DISK:[default-dir]SYSDUMP.DMP, you must identify the page file explicitly. SYS$DISK and [default-dir] represent the disk and directory specified in your last DCL command SET DEFAULT.
If you do not specify filespec, and SYS$SYSTEM:SYSDUMP.DMP does not exist or cannot be opened, SDA prompts you for it. Note that if you do not specify filespec, and SYS$SYSTEM:SYSDUMP.DMP exists and can be opened, SDA will report an error because this is not the primary page file.
Description
Use the /RELEASE qualifier to release from the system page file those blocks occupied by a crash dump. When invoked with the /RELEASE qualifier, SDA immediately deletes the dump from the page file and allows no opportunity to analyze its contents.
When you specify the /RELEASE qualifier in the ANALYZE command, do the following:
Use the /CRASH_DUMP qualifier.
Include the name of the system page file (SYS$SYSTEM:PAGEFILE.SYS) as the filespec.
If you do not specify the system page file or the specified page file does not contain a dump, SDA generates the following messages:
%SDA-E-BLKSNRLSD, no dump blocks in page file to release, or not page file
%SDA-E-NOTPAGFIL, specified file is not the page file
You cannot specify the /OVERRIDE or /SHADOW_MEMBER qualifier when you include the /RELEASE qualifier in the ANALYZE/CRASH_DUMP command.
Example
$ ANALYZE/CRASH_DUMP/RELEASE SYS$SYSTEM:PAGEFILE.SYS
$ ANALYZE/CRASH/RELEASE PAGEFILE.SYS
These commands invoke SDA to release to the page file those blocks in SYS$SYSTEM:PAGEFILE.SYS occupied by a crash dump.
3.7. /SHADOW_MEMBER
/SHADOW_MEMBER
/SHADOW_MEMBER — Valid for Alpha and IA-64 systems only. Specifies which member of a shadow set contains the system dump to be analyzed, or allows the user to determine what system dumps have been written to the members of the shadow set.
Format
/CRASH_DUMP/SHADOW_MEMBER [filespec]
Description
If the system disk is a shadow set, a system dump is written to only one member of the shadow set (usually the master member at the time the dump is written). By default, if the filespec translates to a file on a shadow set, SDA reads the dump only from the master member. If at analysis time, the master member is different from where the dump was written, the /SHADOW_MEMBER qualifier allows the user to choose the member from which the dump is to be read.
If the correct member is not known, the /SHADOW_MEMBER qualifier may be specified without a device name. SDA will display a one-line summary of the most recent dump written to each member and then prompt the user to determine which member to use. The prompt is:
Shadow set action?
The possible responses are:
|
Command |
Effect |
|
EXIT |
Aborts the SDA session without analyzing a dump. |
|
HELP |
Displays simple help text. See Example 3 below. |
|
USE <device_name> |
Initiates analysis of the system dump located on the specified shadow set member. |
The one-line summary for each member consists of the following fields:
Member device name
Bugcheck name
Date and time of system crash
Node name
VMS Version
Flags—none, one or more of: Bad_Checksum, ErrorLog_Dump, Not_Saved, Old_Dump
If there is no usable dump on a member, SDA output will an explanatory warning message followed by a line giving the member device name and the message "No system or error log dump found."
Note that SDA cannot distinguish a dump on a shadowed system disk from a dump copied to a shadowed data disk. SDA will therefore always read the dump from a single member of a host-based shadow set. (In an OpenVMS Cluster system with multiple shadowed system disks, one system’s system disk will be a data disk on other systems.) This does not affect dumps being read directly from a DOSD disk, since DOSD disks cannot be members of a host-based shadow set.
Note
The /SHADOW_MEMBER qualifier is not useful if the system dump has been written to the primary page file on a shadowed system disk. You cannot specify /RELEASE with /SHADOW_MEMBER.
Examples
$ ANALYZE/CRASH_DUMP DSA777:[SYS0.SYSEXE]SYSDUMP.DMP
%SDA-I-USEMASTER, accessing dump file via _$31$DKB200:, master member of shadow set _DSA777:
OpenVMS (TM) Alpha system dump analyzer
...analyzing a compressed selective memory dump...
Dump taken on 12-DEC-2001 08:23:07.80
SSRVEXCEPT, Unexpected system service exception
SDA>
This command initiates dump analysis using the master member of the shadow set DSA777 (the default action).
$ ANALYZE/CRASH_DUMP/SHADOW_MEMBER=DKB0 DSA777:[SYS0.SYSEXE]SYSDUMP.DMP
OpenVMS (TM) Alpha system dump analyzer
...analyzing a compressed selective memory dump...

Dump taken on 12-DEC-2001 08:23:07.80
SSRVEXCEPT, Unexpected system service exception

SDA>
This command initiates dump analysis using member device $31$DKB0 of the shadow set DSA777.
$ ANALYZE/CRASH_DUMP/SHADOW_MEMBER DSA8888:[SYS1.SYSEXE]SYSDUMP.DMP
_$70$DKA303:     INVEXCEPTN           16-NOV-2001 00:00:25.74 MRVP2    X96S-FT1
_$70$DKA202:     INCONSTATE           18-NOV-2001 02:08:45.05 MRVP2    X96S-FT1

Shadow set action? HELP

Shadow set actions:

     EXIT                            exit SDA
     HELP                            this display
     USE <shadow_set_member>         proceed using specified shadow set member

Shadow set action? USE _$70$DKA303:

OpenVMS (TM) Alpha system dump analyzer
...analyzing a compressed selective memory dump...

%SDA-W-NOTSAVED, global pages not saved in the dump file
Dump taken on 16-NOV-2001 00:00:25.74
INVEXCEPTN, Exception while above ASTDEL

SDA> EXIT
This command displays the dumps to be found on the members of shadow set DSA8888:[SYS1.SYSEXE]SYSDUMP.DMP and then begins analysis of the dump written to device _$70$DKA303.
3.8. /SSLOG
/SSLOG
/SSLOG — Displays data collected by the System Service Logging Utility (SSLOG). For more information about this and associated commands, see Chapter 14, System Service Logging.
Format
/SSLOG
3.9. /SYMBOL
/SYMBOL
/SYMBOL — Specifies an alternate system symbol table for SDA to use.
Format
/SYMBOL = system-symbol-table
File specification of the OpenVMS Alpha SDA system symbol table required by SDA to analyze a system dump or running system. The specified system-symbol-table must contain those symbols required by SDA to find certain locations in the executive image.
If you do not specify the /SYMBOL qualifier, SDA uses SDA$READ_ DIR:SYS$BASE_IMAGE.EXE to load system symbols into the SDA symbol table. When you specify the /SYMBOL qualifier, SDA assumes the default disk and directory to be SYS$DISK:[ ], that is, the disk and directory specified in your last DCL command SET DEFAULT. If you specify a file for this parameter that is not a system symbol table, SDA exits with a fatal error.
Description
The /SYMBOL qualifier allows you to specify a system symbol table to load into the SDA symbol table. You can use the /SYMBOL qualifier whether you are analyzing a system dump or a running system. It is not normally necessary to use the /SYMBOL qualifier when analyzing the running system, since the default SYS$BASE_IMAGE.EXE is the one in use in the system. However if SDA$READ_DIR has been redefined during crash dump analysis, then the /SYMBOL qualifier can be used to ensure that the correct base image is found when analyzing the running system.
The /SYMBOL qualifier can be used with the /CRASH_DUMP and /SYSTEM qualifiers. It is ignored when /OVERRIDE or /RELEASE is specified.
Example
$ ANALYZE/CRASH_DUMP/SYMBOL=SDA$READ_DIR:SYS$BASE_IMAGE.EXE SYS$SYSTEM
This command invokes SDA to analyze the crash dump stored in SYS$SYSTEM:SYSDUMP.DMP, using the base image in SDA$READ_DIR.
3.10. /SYSTEM
/SYSTEM
/SYSTEM — Invokes SDA to analyze a running system. Requires CMKRNL (change-mode-to-kernel) privilege. Also requires PFNMAP (map-by-PFN) privilege to access memory by physical address.
Format
/SYSTEM
Parameters
None.
Description
See Section 2.4, ''Analyzing a Running System'' for information on how to use SDA to analyze a running system. See Chapter 4, "SDA Commands" for information on SDA commands.
The only other qualifiers you can specify with /SYSTEM are /LOG and /SYMBOL.
Example
$ ANALYZE/SYSTEM

OpenVMS (TM) system analyzer

SDA>
This command invokes SDA to analyze the running system.
Chapter 4. SDA Commands
This chapter describes the SDA commands that you can use to analyze a system dump or a running system. SDA extension commands, such as CLUE and FLT are described in separate chapters.
4.1. @(Execute Command)
Causes SDA to execute SDA commands contained in a file. Use this command to execute a set of frequently used SDA commands.
Format
@filespec
Parameter
- filespec
Name of a file that contains the SDA commands to be executed. The default file type is .COM.
Example
SDA> @USUAL
The execute (@) command executes the following commands, as contained in a file named USUAL.COM:
SET OUTPUT LASTCRASH.LIS
SHOW CRASH
SHOW PROCESS
SHOW STACK
SHOW SUMMARY
This command procedure first makes the file LASTCRASH.LIS the destination for output generated by subsequent SDA commands. Next, the command procedure sends information to the file about the system failure and its context, including a description of the process executing at the time of the failure, the contents of the stack on which the failure occurred, and a list of the processes active on the system.
An EXIT command within a command procedure terminates the procedure at that point, as would an end-of-file.
Command procedures cannot be nested.
4.2. ATTACH
Switches control of your terminal from your current process to another process in your job (for example, one created with the SDA SPAWN command).
Format
ATTACH [/PARENT] process-name
Parameter
- process-name
Name of the process to which you want to transfer control.
Qualifier
- /PARENT
Transfers control of the terminal to the parent process of the current process. When you specify this qualifier, you cannot specify the process-name parameter.
Examples
SDA> ATTACH/PARENT
This ATTACH command attaches the terminal to the parent process of the current process.
SDA> ATTACH DUMPER
This ATTACH command attaches the terminal to a process named DUMPER in the same job as the current process.
4.3. COLLECT
Collect file identification to file name translation data on both OpenVMS Alpha and OpenVMS IA-64, and process unwind data only on OpenVMS IA-64.
Format
COLLECT [qualifiers]
Parameters
None.
Qualifiers
- /LOG
Displays information on the progress of the COLLECT command, for example, the name of the process being scanned, or (on IA-64) the name of an image whose unwind data is being collected.
- /SAVE [= file name]
Writes collection data to a separate file. By default, a file of type .COLLECT with the same name as the dump file will be created in the same directory as the dump file.
- /UNDO
Removes all the file or unwind data from an earlier COLLECT command from SDA's memory. COLLECT/UNDO does not affect the file or unwind data already appended to the dump file being analyzed, or already written to a separate collection file.
Description
When a dump is being analyzed, it is useful to have data available that cannot be written to the dump file at the time of the system crash. This data includes the full file specification associated with a file identification. On OpenVMS IA-64, it also includes the unwind data for images activated in processes.
If the dump is being analyzed on the system where it was originally written, this data can be collected for use in the current SDA session using the COLLECT command. If the dump is being copied for analysis elsewhere, the COPY/COLLECT command may be used to collect the data and append it to the copy being written. If the COPY/COLLECT command is used after a COLLECT command, the data already collected is appended to the dump copy.
For all file or unwind data to be collected successfully, all disks that were mounted at the time of the system crash should be remounted and accessible to the process running SDA.
If the COPY and the COLLECT cannot be done as a single step, a COLLECT/SAVE command writes the collection to a separate file that can be used later with the dump file. A later COPY will combine the two files.
Example
SDA> COLLECT
%SDA-W-DISKNOACC, no access to _$30$DKB100: for file and/or unwind data
%SDA-W-FILENOACC, no access to _$30$DKB0:(7709,1,0) for unwind data
-SYSTEM-W-NOSUCHFILE, no such file
In this example, the disk $30$DKB100, which was mounted at the time the system crashed, is not available when file and/or unwind data is being collected. In addition, unwind data cannot be collected for the image with file identification (7709,1,0) on _$30$DKB0: since it no longer exists.
4.4. COPY
Copies the contents of the dump file to another file.
Format
COPY [/qualifier...]
            output-filespec
Parameter
- output-filespec
Name of the device, directory, and file to which SDA copies the dump file. The default output-filespec is SYS$DISK:[default-dir]filename.DMP, where SYS$DISK and [default-dir] represent the disk and directory specified in your last DCL command
SET DEFAULT. You must specify an output-filespec.
Qualifiers
- /COLLECT
/NOCOLLECT Causes SDA to collect (or not collect) file identification or unwind data from the current system and append it to the copy being created. For more details, see the Description section.
- /COMPRESS
Causes SDA to compress dump data as it is writing a copy. If the dump being analyzed is already compressed, then SDA does a direct COPY, and issues an informational message indicating that it is ignoring the /COMPRESS qualifier.
- /CONFIRM
Causes SDA to prompt for which processes to copy when performing a Partial Dump Copy. This qualifier can only be used when /PARTIAL=PROCESS=option is specified. For each possible process in the set, SDA prompts as follows, where the default response is No and only a single character response is needed otherwise:
Copy process "process-name"? (Y/[N]/A/Q):
Where the response:
YES   Includes the process in the copy.
NO    Excludes the process from the copy.
ALL   Includes the process and all remaining processes in the copy.
QUIT  Excludes the process and all remaining processes from the copy.
- /DECOMPRESS
Causes SDA to decompress dump data as it is writing a copy. If the dump being analyzed is already decompressed, then SDA does a direct COPY, and issues an informational message indicating that it is ignoring the /DECOMPRESS qualifier.
- /LOG
Displays information about the progress of the COPY command, for example, the name of the process being copied in a selective dump, or, in the case of COPY/COLLECT on IA-64, the name of an image whose unwind data is being appended to the dump copy.
- /PARTIAL=(section,...)
Causes SDA to copy only the specified sections of the dump. The /PARTIAL qualifier can only be used with a selective system dump (compressed or uncompressed). It is not available for full system dumps or for process dumps. Also, the /PARTIAL qualifier cannot be combined with /COMPRESS, /DECOMPRESS, or /[NO]COLLECT. Such a copy must be performed as two separate COPY commands, and requires exiting from SDA and then re-invoking SDA on the intermediate copy.
See Section 2.2.3, ''Partial Dump Copies'' for a description of Partial Dump Copies. For an explanation of key processes and key global pages, and the organization of a selective system dump, see the VSI OpenVMS System Manager's Manual, Volume 2: Tuning, Monitoring, and Complex Systems.
Multiple sections must be separated by commas. If only one section is given, the parentheses may be omitted. Possible sections are as follows:
| PT | System Page Table Space | |
| S0S1 | 32-bit System Space | |
| S2 | 64-bit System Space | |
| REPLICATED_SYS | Replicated System Space (only applies to Alpha systems with RADs enabled) | |
| PROCESS=option | Process Space for one or more processes. Options are: | |
| ALL | All processes. This is the default. | |
| KEY | All key processes. | |
| OTHER | All other (not key) processes. | |
| NAME=(list) | Specific named processes (see note below) | |
| GLOBAL=option | Global Pages. Options are: | |
| ALL | All global pages mapped by processes. This is the default. | |
| KEY | All global pages mapped by key processes. | |
| OTHER | All other (not key) global pages mapped by processes. | |
| KEY | Equivalent to: PT, S0S1, S2, REPLICATED_SYS, PROCESS = KEY, GLOBAL = KEY | |
| OTHER | Equivalent to: PROCESS = OTHER, GLOBAL = OTHER | |
| SYSTEM | Equivalent to: PT, S0S1, S2, REPLICATED_SYS | |
Note
If /PARTIAL=PROCESS=NAME=(list) is specified:
Multiple process names must be separated by commas. If only one process name is given, the parentheses may be omitted.
Process names can include "%" and "*" wildcards.
The comparison of the given name to actual process names in the dump is performed case-blind, and trailing spaces and tabs are ignored.
Process names can include characters, such as "," and "/". You can enclose the process name in quotes to include some of these special characters in the name you specify, or you can use the "%" wildcard instead of characters.
Description
Each time the system fails, the contents of memory and the hardware context of the current process (as directed by the DUMPSTYLE parameter) are copied into the file SYS$SYSTEM:SYSDUMP.DMP (or the page file), overwriting its contents. If you do not save this crash dump elsewhere, it will be overwritten the next time that the system fails.
The COPY command allows you to preserve a crash dump by copying its contents to another file. It is generally useful to invoke SDA during system initialization to execute the COPY command. This ensures that a copy of the dump file is made only after the system has failed. The preferred method for doing this, using the logical name CLUE$SITE_PROC, is described in Section 2.2.4, ''Invoking SDA When Rebooting the System''.
The COPY command does not affect the contents of the file containing the dump being analyzed.
If you are using the page file (SYS$SYSTEM:PAGEFILE.SYS) as the dump file instead of SYSDUMP.DMP, successful completion of the COPY command will automatically cause the blocks of the page file containing the dump to be released, thus making them available for paging. Even if the copy operation succeeds, the release operation requires that your process have change-mode-to-kernel (CMKRNL) privilege. When the dump pages have been released from the page file, the dump information in these pages will be lost and SDA will immediately exit. You must perform subsequent analysis upon the copy of the dump created by the COPY command.
If you press Ctrl/T while using the COPY command, the system displays how much of the file has been copied.
When a dump is being analyzed, it is useful to have data available that cannot be written to the dump file at the time of the system crash. This data includes the full file specification associated with a file identification and, on OpenVMS IA-64, the unwind data for images activated in processes.
If the dump is being analyzed on the system where it was originally written, this data can be collected for use in the current SDA session using the COLLECT command. If the dump is being copied for analysis elsewhere, the COPY/COLLECT command can be used to collect the data and append it to the copy being written. If the COPY/COLLECT command is used after a COLLECT command, the data already collected is appended to the dump copy.
By default, a copy of the original dump, as written at the time of the system crash, includes collection. You can use COPY/NOCOLLECT to override this default. Conversely, a copy of a dump previously copied by SDA without collection (COPY/NOCOLLECT) does not include collection. You can use COPY/COLLECT to override this setting.
When you copy a dump that already contains an appended collection, the copy will always include that collection.
For all file and unwind data to be collected successfully, all disks that were mounted at the time of the system crash should be remounted and be accessible to the process running SDA. If SDA is invoked early in the startup procedure to save the contents of the dump (for example, using CLUE$SITE_PROC as described in Section 2.2.4, ''Invoking SDA When Rebooting the System''), but disks are not mounted until a batch job is run, you should use the COPY/NOCOLLECT command in the CLUE$SITE_PROC command procedure. Once all disks are mounted, you can use a COPY/COLLECT command to save file or unwind data.
If the COPY and the COLLECT procedures cannot be done as a single step, you can execute a COLLECT/SAVE command to write the collection to a separate file that can be used later in conjunction with the dump file. A later COPY operation can combine the two files.
Example
SDA> COPY SYS$CRASH:SAVEDUMP
The COPY command copies the dump file into the file SYS$CRASH:SAVEDUMP.DMP.
4.5. DEFINE
Assigns a value to a symbol.
Format
DEFINE [/qualifier...] symbol-name [=] expression
Parameters
- symbol-name
Name, containing from 1 to 31 alphanumeric characters, that identifies the symbol. Symbols that include lowercase letters must be enclosed in quotation marks ("symbol" ). See Section 2.6.1.4, ''SDA Symbols'' for a description of SDA symbol syntax and a list of default symbols.
- expression
Definition of the symbol's value. See Section 2.6.1, ''Using Expressions and Operators'' for a discussion of the components of SDA expressions.
Qualifier
- /FD
- /PD
Defines a symbol as a function descriptor (FD) or procedure descriptor (PD). It also defines the routine address symbol corresponding to the defined symbol (the routine address symbol has the same name as the defined symbol, only with _C appended to the symbol name). See Section 2.6.1.4, ''SDA Symbols'' for more information about symbols. /FD and /PD are completely interchangeable. SDA interprets them based on the architecture of the system or dump being analyzed.
Description
The DEFINE command causes SDA to evaluate an expression and then assign its value to a symbol. Both the DEFINE and EVALUATE commands perform computations to evaluate expressions. DEFINE adds symbols to the SDA symbol table but does not display the results of the computation. EVALUATE displays the result of the computation but does not add symbols to the SDA symbol table.
Examples
SDA>  DEFINE BEGIN = 80058E00
SDA>  DEFINE END = 80058E60
SDA>  EXAMINE BEGIN:END
In this example, DEFINE defines two addresses, called BEGIN and END. These symbols serve as reference points in memory, defining a range of memory locations for the EXAMINE command to inspect.
SDA>  DEFINE NEXT = @PC
SDA>  EXAMINE/INSTRUCTION NEXT
NEXT:   HALT
The symbol NEXT defines the address contained in the program counter, so that the symbol can be used in an EXAMINE/INSTRUCTION command.
SDA>  DEFINE VEC SCH$GL_PCBVEC
SDA>  EXAMINE VEC
SCH$GL_PCBVEC:  00000000.8060F2CC   "Ìò`....."
SDA>
After the value of global symbol SCH$GL_PCBVEC has been assigned to the symbol VEC, the symbol VEC is used to examine the memory location or value represented by the global symbol.
SDA>  DEFINE/PD VEC SCH$QAST
SDA>  EXAMINE VEC
SCH$QAST:  0000002C.00003008   ".0..,..."
SDA>  EXAMINE VEC_C
SCH$QAST_C:  B75E0008.43C8153E   ">.ÈC..^·"
SDA>
In this example, the DEFINE/PD command defines not only the symbol VEC, but also the corresponding routine address symbol (VEC_C).
4.6. DEFINE/KEY
Associates an SDA command with a terminal key. Once you have associated a command with a key, you can just press the defined key, followed by the Return key to issue the command. If you specify the /TERMINATE qualifier when you define the key, you do not have to press the Return key to issue the command.
Format
DEFINE/KEY [/qualifier...] key-name command
Parameters
- key-name
Name of the key to be defined. You can define the following keys under SDA:
Key Name Key Designation PF1 LK201, VT100 PF2 LK201, VT100 PF3 LK201, VT100 PF4 LK201, VT100 KP0...KP9 Keypad 0--9 PERIOD Keypad period COMMA Keypad comma MINUS Keypad minus ENTER Keypad ENTER UP Up arrow DOWN Down arrow LEFT Left arrow RIGHT Right arrow E1 LK201 Find E2 LK201 Insert Here E3 LK201 Remove E4 LK201 Select E5 LK201 Prev Screen E6 LK201 Next Screen HELP LK201 Help DO LK201 Do F7...F20 LK201 Function keys - command
SDA command to define a key. You must enclose the command in quotation marks (" ").
Qualifiers
- /IF_STATE=state_list
- /NOIF_STATE
Specifies a list of one or more states, one of which must be in effect for the key definition to work. The /NOIF_STATE qualifier has the same meaning as /IF_STATE=current_state. The state name is an alphanumeric string. States are established with the /SET_STATE qualifier. If you specify only one state name, you can omit the parentheses. By including several state names, you can define a key to have the same function in all the specified states.
- /LOCK_STATE
- /NOLOCK_STATE
Specifies that the state set by the /SET_STATE qualifier remains in effect until explicitly changed. By default, the /SET_STATE qualifier is in effect only for the next definable key you press or the next read-terminating character that you type. You can specify this qualifier only with the /SET_STATE qualifier.
The default is /NOLOCK_STATE.
- /SET_STATE=state-name
- /NOSET_STATE
Causes the key being defined to create a key state change instead of or in addition to issuing an SDA command. When you use the /SET_STATE qualifier, you supply the name of a key state to be used with the /IF_STATE qualifier in other key definitions.
For example, you can define the PF1 key as the GOLD key and use the /IF_STATE=GOLD qualifier to allow two definitions for the other keys, one in the GOLD state and one in the non-GOLD state. For more information on using the /IF_STATE qualifier, see the DEFINE/KEY command in the VSI OpenVMS DCL Dictionary or online help.
The default is /NOSET_STATE.
- /TERMINATE
- /NOTERMINATE
Causes the key definition to include termination of the command, which causes SDA to execute the command when the defined key is pressed. Therefore, you do not have to press the Return key after you press the defined key if you specify the /TERMINATE qualifier.
Description
The DEFINE/KEY command causes an SDA command to be associated with the specified key, in accordance with any of the specified qualifiers described previously.
If the symbol or key is already defined, SDA replaces the old definition with the new one. Symbols and keys remain defined until you exit from SDA.
Examples
SDA>  DEFINE/KEY PF1 "SHOW STACK"
SDA>  [PF1] SHOW STACK [RETURN]
Process stacks (on CPU 00)
-------------------------
Current operating stack (KERNEL):
   .
   .
   .
The DEFINE/KEY command defines PF1 as the SHOW STACK command. When you press the PF1 key, SDA displays the command and waits for you to press the Return key.
SDA>  DEFINE/KEY/TERMINATE PF1 "SHOW STACK"
SDA>  [PF1] SHOW STACK
Process stacks (on CPU 00)
-------------------------
Current operating stack (KERNEL):
      00000000.7FF95D00  00000000.0000000B
      00000000.7FF95D08  FFFFFFFF.804395C8  MMG$TBI_DATA_64+000B8
      00000000.7FF95D10  00000000.00000000
      00000000.7FF95D18  0000FE00.00007E04
SP => 00000000.7FF95D20  00000000.00000800  IRP$M_EXTEND
      00000000.7FF95D28  00000001.000002F7  UCB$B_PI_FKB+0000B
      00000000.7FF95D30  FFFFFFFF.804395C8  MMG$TBI_DATA_64+000B8
      00000000.7FF95D38  00000002.00000000
   .
   .
   .
The DEFINE/KEY command defines PF1 as the SDA SHOW STACK command. The /TERMINATE qualifier causes SDA to execute the SHOW STACK command without waiting for you to press the Return key.
SDA>  DEFINE/KEY/SET_STATE="GREEN" PF1 ""
SDA>  DEFINE/KEY/TERMINATE/IF_STATE=GREEN PF3 "SHOW STACK"
SDA>  [PF1] [PF3] SHOW STACK
Process stacks (on CPU 00)
-------------------------
Current operating stack (KERNEL):
   .
   .
   .
The first DEFINE/KEY command defines PF1 as a key that sets a command state GREEN. The trailing pair of quotation marks is required syntax, indicating that no command is to be executed when this key is pressed.
The second DEFINE command defines PF3 as the SHOW STACK command, but using the /IF_STATE qualifier makes the definition valid only when the command state is GREEN. Thus, you must press PF1 before pressing PF3 to issue the SHOW STACK command. The /TERMINATE qualifier causes the command to execute as soon as you press the PF3 key.
4.7. DUMP
Displays the contents of a range of memory formatted as a comma-separated variable (CSV) list, suitable for inclusion in a spreadsheet.
Format
DUMP range
[/BYTE | /WORD | /LONGWORD (default) | /QUADWORD]
[/DECIMAL | /HEXADECIMAL (default)]
[/FORWARD (default) | /REVERSE]
[/RECORD_SIZE=size ] (default = 512)
 [/INDEX_ARRAY [= {LONGWORD (default) | QUADWORD} ]
                    ]
 [/INITIAL_POSITION = {ADDRESS=address | RECORD=number }
                    ]
 [/COUNT = {ALL | records } ] (default = all
                    records)
[/PHYSICAL]
[/BYTE | /WORD |/NOSUPPRESS]
Parameter
- range
The range of locations to be displayed. The range is specified in one of the following formats:
m:n Range from address m to address n inclusive m;n Range from address m for n bytes The length of the range must be an exact multiple of the data item size --- or of the index array size if /INDEX_ARRAY is specified.
Qualifiers
- /BYTE
Outputs each data item as a byte.
- /COUNT = [ {ALL | records} ]
Gives the number of records to be displayed. The default is to display all records.
- /DECIMAL
Outputs data as decimal values.
- /FORWARD
Causes SDA to display the records in the history buffer in ascending address order. This is the default.
- /HEXADECIMAL
Outputs data as hexadecimal values. This is the default.
- /INDEX_ARRAY [= {LONGWORD (default) | QUADWORD} ]
Indicates to SDA that the range of addresses given is a vector of pointers to the records to be displayed. The vector can be a list of longwords (default) or quadwords. The size of the range must be an exact number of longwords or quadwords as appropriate.
- /INITIAL_POSITION = {ADDRESS=address | RECORD=number}
Indicates to SDA which record is to be displayed first. The default is the lowest addressed record if /FORWARD is used, and the highest addressed record if /REVERSE is used. The initial position may be given as a record number within the range, or the address at which the record is located.
- /LONGWORD
Outputs each data item as a longword. This is the default.
- /NOSUPPRESS
Indicates that SDA should not suppress leading zeroes when displaying data in hexadecimal format.
- /PHYSICAL
Indicates to SDA that all addresses (range and/or start position) are physical addresses. By default, virtual addresses are assumed.
- /QUADWORD
Outputs each data item as a quadword.
- /RECORD_SIZE=size
Indicates the size of each record within the history buffer, the default being 512 bytes. This size must exactly divide into the total size of the address range to be displayed, unless you specify /INDEX_ARRAY. If no record size is given, and the length of the range is not more than 512 bytes, a single record is output containing the range specified, with no record number field. The length of the range must be an exact multiple of the data item size --- or of the index array size if /INDEX_ARRAY is specified.
- /REVERSE
Causes SDA to display the records in the history buffer in descending address order.
- /WORD
Outputs each data item as a word.
Description
The DUMP command displays the contents of a range of memory formatted as a comma-separated variable (CSV) list, suitable for inclusion in a spreadsheet. It is intended for use with a history buffer containing records of information of which the most recently written entry is in the middle of the memory range.
Note
See SET OUTPUT/NOHEADER for related information.
Examples
SDA> DUMP dump g;200/initial_position=record=5/record_size=20/reverse
05,A77B0010,A79B0008,6B9C4001,47FF041F,A03E0000,47DF041C,201F0016,083
04,A03E0000,47DF041C,201F0058,083,A77B0010,A79B0008,6B9C4001,47FF041F
03,A03E0000,47DF041C,201F0075,083,A03E0000,47DF041C,201F001B,083
02,A77B0010,A79B0008,6B9C4001,47FF041F,A03E0000,47DF041C,201F0074,083
01,43E05120,083,6BFA8001,47FF041F,A77B0010,A79B0008,6B9C4001,47FF041F
0,201F0104,6BFA8001,47FF041F,47FF041F,201F0001,6BFA8001,47FF041F,47FF041F
0F,A03E0000,47DF041C,201F0065,083,A03E0000,47DF041C,201F0006,083
0E,A03E0000,47DF041C,201F001C,083,A03E0000,47DF041C,201F001A,083
0D,A03E0000,47DF041C,201F0077,083,A03E0000,47DF041C,201F0057,083
0C,A03E0000,47DF041C,201F002B,083,A03E0000,47DF041C,201F003A,083
0B,A03E0000,47DF041C,201F007D,083,A77B0010,A79B0008,6B9C4001,47FF041F
0A,A03E0000,47DF041C,201F005A,083,A03E0000,47DF041C,201F0078,083
09,A03E0000,47DF041C,201F0002,082,A03E0000,47DF041C,201F0037,083
08,A03E0000,47DF041C,201F0035,083,A03E0000,47DF041C,201F007A,083
07,A03E0000,47DF041C,201F0019,083,A03E0000,47DF041C,201F0034,083
06,A77B0010,A79B0008,6B9C4001,47FF041F,A03E0000,47DF041C,201F0018,083
This example shows the dump of an area of memory treated as 16 records of 32 bytes each, beginning at record 5, and dumped in reverse order. Note the record number in the first field, and that the dump wraps to the end of the memory area after the first record has been output.
SDA> EXAMINE SMP$GL_CPU_DATA;80
00000000 00000000 8FE26000 8FE14000 00000000 00000000 8FE02000 811FE000  ...
00000000 00000000 00000000 00000000 00000000 00000000 00000000 00000000  ...
00000000 00000000 00000000 00000000 00000000 00000000 00000000 00000000  ...
00000000 00000000 00000000 00000000 00000000 00000000 00000000 00000000  ...
SDA> DUMP SMP$GL_CPU_DATA;80/index_array/record_size=20/count=5
0,810C17C0,8EC7C180,026A09C0,02,0,FFFFFFFF,0,0
01,810C17C0,8EC7C400,026A09C0,02,0,FFFFFFFF,0,01
04,810C17C0,8EC7CB80,026A09C0,02,0,FFFFFFFF,0,04
This example shows the contents of the CPU database vector, then dumps the first 32 bytes of each CPU database entry. Only the first five entries in the array are requested, and those containing zero are ignored.
4.8. EVALUATE
Computes and displays the value of the specified expression in both hexadecimal and decimal. Alternative evaluations of the expression are available with the use of the qualifiers defined for this command.
Format
EVALUATE [ {/CONDITION_VALUE | /FPSR | /IFS
| /ISR | /PFS | /PS | /PSR
| /PTE
| /[NO]SYMBOLS [=filter] | /TIME}] expression
Parameter
- expression
SDA expression to be evaluated. Section 2.6.1, ''Using Expressions and Operators'' describes the components of SDA expressions.
Qualifiers
- /CONDITION_VALUE
Displays the message that the $GETMSG system service obtains for the value of the expression.
- /FPSR
(IA-64 only) Evaluates the specified expression in the format of a floating-point status register.
- /IFS
(IA-64 only) Evaluates the specified expression in the format of an interruption function state.
- /ISR
(IA-64 only) Evaluates the specified expression in the format of an interruption status register.
- /PFS
(IA-64 only) Evaluates the specified expression in the format of a previous function state.
- /PS
Evaluates the specified expression in the format of a processor status
- /PSR
(IA-64 only) Evaluates the specified expression in the format of a processor status register.
- /PTE
Interprets and displays the expression as a page table entry (PTE). The individual fields of the PTE are separated and an overall description of the PTE's type is provided.
- /SYMBOLS[=filter]
- /NOSYMBOLS
The default behavior of the EVALUATE command is to display up to five symbols that are known to be equal to the evaluated expression. If /SYMBOLS is specified with no filter, all symbols are listed in alphabetical order. If /NOSYMBOLS is specified, only the hexadecimal and decimal values are displayed. If /SYMBOLS is specified with a filter, only symbols that match the filter are displayed. The filter is a string containing wildcards, such as PCB$*.
- /TIME
Interprets and displays the expression as a 64-bit time value. Positive values are interpreted as absolute time; negative values are interpreted as delta time.
Description
If you do not specify a qualifier, the EVALUATE command interprets and displays the expression as hexadecimal and decimal values. In addition, if the expression is equal to the value of a symbol in the SDA symbol table, that symbol is displayed. If no symbol with this value is known, the next lower valued symbol is displayed with an appropriate offset unless the offset is extremely large. (See Section 2.6.1.4, ''SDA Symbols'' for a description of how SDA displays symbols and offsets.) The DEFINE command adds symbols to the SDA symbol table but does not display the results of the computation. EVALUATE displays the result of the computation but does not add symbols to the SDA symbol table.
Examples
SDA>  EVALUATE -1
Hex = FFFFFFFF.FFFFFFFF   Decimal = -1           I
The EVALUATE command evaluates a numeric expression, displays the value of that expression in hexadecimal and decimal notation, and displays a symbol that has been defined to have an equivalent value.
SDA>  EVALUATE 1
Hex = 00000000.00000001   Decimal = 1  CHF$M_CALEXT_CANCEL
                                              CHF$M_FPREGS_VALID
                                              CHF$V_CALEXT_LAST
                                              IRP$M_BUFIO
                                              IRP$M_CLN_READY
                                                 |
                           (remaining symbols suppressed by default)
The EVALUATE command evaluates a numeric expression and displays the value of that expression in hexadecimal and decimal notation. This example also shows the symbols that have the displayed value. A maximum of five symbols are displayed by default.
SDA>  DEFINE TEN = A
SDA>  EVALUATE TEN
Hex = 00000000.0000000A   Decimal = 10  IRP$B_TYPE
                                             IRP$S_FMOD
                                             IRP$V_MBXIO
                                             TEN
                                             UCB$B_TYPE
                                              |
                           (remaining symbols suppressed by default)
This example shows the definition of a symbol named TEN. The EVALUATE command then shows the value of the symbol.
Note that A, the value assigned to the symbol by the DEFINE command, could be a symbol. When SDA evaluates a string that can be either a symbol or a hexadecimal numeral, it first searches its symbol table for a definition of the symbol. If SDA finds no definition for the string, it evaluates the string as a hexadecimal number.
SDA>  EVALUATE (((TEN * 6) + (-1/4)) + 6)
Hex = 00000000.00000042      Decimal = 66
This example shows how SDA evaluates an expression of several terms, including symbols and rational fractions. SDA evaluates the symbol, substitutes its value in the expression, and then evaluates the expression. The fraction -1/4 is truncated to 0.
SDA>  EVALUATE/CONDITION 80000018
%SYSTEM-W-EXQUOTA, exceeded quota
This example shows the output of an EVALUATE/CONDITION command.
SDA>  EVALUATE/PFS 00000000.000013AF
         PPL    PEC    RRB.PR   RRB.FR   RRB.GR     SOR       SOL           SOF
         0       0.       0.       0.       0.       0.    39. (32-70)   47. (32-78)
This example shows the output of an EVALUATE/PFS command on an IA-64 system.
SDA>  EVALUATE/PS  0B03
         MBZ SPAL      MBZ    IPL VMM MBZ CURMOD INT PRVMOD
         0   00   00000000000 0B  0   0   KERN   0   USER
In this EVALUATE/PS command on an Alpha system, SDA interprets the entered value 0B03 as though it were a processor status (PS) and displays the resulting field values.
SDA> EVALUATE/PSR 00001410.0A026010
        RT  TB  LP  DB  SI  DI  PP  SP  DFH DFL DT  PK  I   IC  MFH MFL AC  BE
        1   0   1   0   0   0   0   0   0   0   1   0   1   1   0   1   0   0
        IA  BN  ED  RI  SS  DD  DA  ID  IT  MC  IS  CPL
        0   1   0   2   0   0   0   0   1   0   0   0
This example shows the output of an EVALUATE/PSR command on an IA-64 system.
SDA>  EVALUATE/PTE 0BCDFFEE
 3 3 2   2             2 1 1   1 1
 1 0 9   7             0 9 8   6 5               7 6   4 3     0
+-+-+---+-------------+-+-+---+-+---------------+-+---+-+-----+-+
|0|0| 0 |     005E    |0|1| 2 |1|      FF       |1| 3 |0|  7  |0|
+-+-+---+-------------+-+-+---+-+---------------+-+---+-+-----+-+
|                            00000000                           |
+---------------------------------------------------------------+
Global PTE:  Owner = S, Read Prot = KESU, Write Prot = KESU, CPY = 0
             GPT Index  = 00000000
The EVALUATE/PTE command displays the expression 0BCDFFEE as a page table entry (PTE) and labels the fields. It also describes the status of the page. For more information on interpreting information in this output, see Section 2.8, ''Page Protections and Access Rights''.
SDA> EVALUATE/TIME 009A9A4C.843DBA9F
10-OCT-1996 15:59:44.02
This example shows the use of the EVALUATE/TIME command.
SDA>  EVALUATE 2F0/SYMBOL=PCB*
Hex = 00000000.000002F0   Decimal = 752        PCB$L_INITIAL_KTB
                                               PCB$L_PCB
This example shows the use of the symbol filter. Only those symbols whose value is 2F0 and whose names begin with PCB are displayed.
4.9. EXAMINE
Displays either the contents of a location or of a range of locations in physical memory, or the contents of a register. Use location parameters to display specific locations or use qualifiers to display the entire process and system regions of memory.
Format
EXAMINE [location [/PHYSICAL] | /ALL | /P0 | /P1 |
                    /SYSTEM]
[/CONDITION_VALUE | /FPSR | /IFS | /ISR | /PFS
 | /PS | /PSL | /PSR | /PTE | /TIME | /[NO]FD |
                    /[NO]PD]
[/NOSUPPRESS]
[/INSTRUCTION]
Parameter
- location
Location in memory to be examined. A location can be represented by any valid SDA expression. (See Section 2.6.1, ''Using Expressions and Operators'' for additional information about expressions.) To examine a range of locations, use the following syntax:
m:n Range of locations to be examined, from m to n m;n Range of locations to be examined, starting at m and continuing for n bytes The default location that SDA uses is initially 0 in the program region (P0) of the process that was executing at the time the system failed (if you are examining a crash dump) or your process (if you are examining the running system). Subsequent uses of the EXAMINE command with no parameter specified increase the last address examined by eight. Use of the /INSTRUCTION qualifier increases the default address by four (for Alpha) or 16 (for IA-64). To examine memory locations of other processes, you must use the SET PROCESS command.
Qualifiers
- /ALL
Examines all the locations in the program, and control regions and system space, displaying the contents of memory in hexadecimal longwords and ASCII characters. Do not specify parameters when you use this qualifier.
- /CONDITION_VALUE
Examines the specified longword, displaying the message that the $GETMSG system service obtains for the value in the longword.
- /FD
- /NOFD
See the description of /PD.
- /FPSR
(IA-64 only) Examines the specified expression in the format of a floating-point status register.
- /IFS
(IA-64 only) Examines the specified expression in the format of an interruption function state.
- /INSTRUCTION
Translates the specified range of memory locations into assembly instruction format. Each symbol in the EXAMINE expression that is defined as a procedure descriptor is replaced with the code entry point address of that procedure, unless you also specify the /NOPD qualifier. For IA-64 only, SDA always displays entire bundles of instructions, not individual slots.
- /ISR
(IA-64 only) Examines the specified expression in the format of an interruption status register.
- /NOSUPPRESS
Inhibits the suppression of zeros when displaying memory with one of the following qualifiers: /ALL, /P0, /P1, /SYSTEM, or when a range is specified.
- /P0
Displays the entire program region for the default process. Do not specify parameters when you use this qualifier.
- /P1
Displays the entire control region for the default process. Do not specify parameters when you use this qualifier.
- /PD
- /NOPD
Functionally equivalent to /FD and /NOFD.
Causes the EXAMINE command to treat the location specified in the EXAMINE command as a function descriptor (FD) or procedure descriptor (PD), depending on the architecture of the system or dump being analyzed. /PD can also be used to qualify symbols.
You can use the /PD and /NOPD qualifiers with the /INSTRUCTION qualifier to override treating symbols as function or procedure descriptors. Placing the qualifier right after a symbol overrides how the symbol is treated. /PD forces it to be a procedure descriptor, and /NOPD forces it to not be a procedure descriptor.
If you place the /PD qualifier right after the /INSTRUCTION qualifier, SDA treats the calculated value as a function or procedure descriptor. /NOPD has the opposite effect.
In the following examples, TEST_ROUTINE is a PD symbol. Its value is 500 and the code address in this procedure descriptor is 1000. The first example displays instructions starting at 520.
EXAMINE/INSTRUCTION TEST_ROUTINE/NOPD+20
The next example fetches code address from TEST_ROUTINE PD, adds 20 and displays instructions at that address. In other words, it displays code starting at location 1020.
EXAMINE/INSTRUCTION TEST_ROUTINE+20
The final example treats the address TEST_ROUTINE+20 as a procedure descriptor, so it fetches the code address out of a procedure descriptor at address 520. It then uses that address to display instructions.
EXAMINE/INSTRUCTION/PD TEST_ROUTINE/NOPD+20
- /PFS
(IA-64 only) Examines the specified expression in the format of a previous function state.
- /PHYSICAL
Examines physical addresses. You cannot use the /PHYSICAL qualifier in combination with the /P0, /P1, or /SYSTEM qualifiers.
- /PS
- /PSL
Examines the specified quadword, displaying its contents in the format of a processor status. This qualifier must precede any parameters used in the command line.
- /PSR
(IA-64 only) Examines the specified expression in the format of a processor status register.
- /PTE
Interprets and displays the specified quadword as a page table entry (PTE). The display separates individual fields of the PTE and provides an overall description of the PTE's type.
- /SYSTEM
Displays portions of the writable system region. Do not specify parameters when you use this qualifier.
- /TIME
Examines the specified quadword, displaying its contents in the format of a system-date-and-time quadword.
Description
The following sections describe how to use the EXAMINE command.
Examining Locations
When you use the EXAMINE command to look at a location, SDA displays the location in symbolic notation (symbolic name plus offset), if possible, and its contents in hexadecimal and ASCII formats:
SDA> EXAMINE G6605C0
806605C0:  64646464.64646464  "dddddddd"
If the ASCII character that corresponds to the value contained in a byte is not printable, SDA displays a period (.). If the specified location does not exist in memory, SDA displays this message:
%SDA-E-NOTINPHYS, address : virtual data not in physical memory
To examine a range of locations, you can designate starting and ending locations separated by a colon. For example:
SDA> EXAMINE G40:G200
Alternatively, you can specify a location and a length, in bytes, separated by a semicolon. For example:
SDA> EXAMINE G400;16
When used to display the contents of a range of locations, the EXAMINE command displays six or ten columns of information. Ten columns are used if the terminal width is 132 or greater, or if a SET OUTPUT has been entered; six columns are used otherwise. An explanation of the columns is as follows:
Each of the first four or eight columns represents a longword of memory, the contents of which are displayed in hexadecimal format.
The fifth or ninth column lists the ASCII value of each byte in each longword displayed in the previous four or eight columns.
The sixth or tenth column contains the address of the first, or rightmost, longword in each line. This address is also the address of the first, or leftmost, character in the ASCII representation of the longwords. Thus, you read the hexadecimal dump display from right to left, and the ASCII display from left to right.
If a series of virtual addresses does not exist in physical memory, SDA displays a message specifying the range of addresses that were not translated.
If a range of virtual locations contains only zeros, SDA displays this message:
Zeros suppressed from 'loc1' to 'loc2'
Decoding Locations
You can translate the contents of memory locations into instruction format by using the /INSTRUCTION qualifier. This qualifier causes SDA to display the location in symbolic notation (if possible) and its contents in instruction format. The operands of decoded instructions are also displayed in symbolic notation. The location must be longword aligned (for Alpha) or octaword aligned (for IA-64).
Examining Memory Regions
You can display an entire region of virtual memory by using one or more of the qualifiers /ALL, /SYSTEM, /P0, and /P1 with the EXAMINE command.
Other Uses
Other uses of the EXAMINE command appear in the following examples.
Note
When examining individual locations, addresses are usually symbolized, as described previously. If the SET SYMBOLIZE OFF command is issued, addresses are not symbolized. See the SET SYMBOLIZE command for further details.
Examples
SDA> EXAMINE/PFS 7FF43C10
        PPL    PEC    RRB.PR   RRB.FR   RRB.GR     SOR       SOL           SOF
        0       0.       0.       0.       0.       0.    23. (32-54)   31. (32-62)
This example shows the display produced by the EXAMINE/PFS command. Headings refer to previous privilege level (PPL), previous epilog count (PEC), Register Rename Base (RRB) for Predicate (PR), Floating (FR), and General (GR) Registers, Size of Rotating (SOR) or Local (SOL) portion of the stack frame or Size of the Stack Frame (SOF). For more information, see the Intel IA-64 Architecture Software Developer's Manual.
SDA> EXAMINE/PS 7FF95E78
        MBZ SPAL      MBZ    IPL VMM MBZ CURMOD INT PRVMOD
        0   00   00000000000 08  0   0   KERN   0   EXEC
This example shows the display produced by the EXAMINE/PS command.
SDA> EXAMINE/PSR 7FF43C78
        RT  TB  LP  DB  SI  DI  PP  SP  DFH DFL DT  PK  I   IC  MFH MFL AC  BE
        1   0   1   0   0   0   0   0   1   0   1   0   1   1   0   1   0   0
        IA  BN  ED  RI  SS  DD  DA  ID  IT  MC  IS  CPL
        0   1   0   1   0   0   0   0   1   0   0   0
This example shows the display produced by the EXAMINE/PSR command
SDA> EXAMINE/PTE @^QMMG$GQ_L1_BASE
 3 3 2   2             2 1 1   1 1
 1 0 9   7             0 9 8   6 5               7 6   4 3     0
+-+-+---+-------------+-+-+---+-+---------------+-+---+-+-----+-+
|0|1| 0 |     0000    |0|0| 0 |0|      11       |0| 0 |0|  4  |1|
+-+-+---+-------------+-+-+---+-+---------------+-+---+-+-----+-+
|                            00007090                           |
+---------------------------------------------------------------+
Valid PTE: Owner = K, Read Prot = K---, Write Prot = K---
           Fault on = -E--, ASM = 00, Granularity Hint = 00 (8KB)
           CPY = 00, PFN = 00007090
The EXAMINE/PTE command displays and formats the level 1 page table entry at FFFFFEFD.BF6FC000. For more information on interpreting this display, see Section 2.8, ''Page Protections and Access Rights''.
SDA> EXAMINE/CONDITION_VALUE R0
%SYSTEM-F-NOPRIV, insufficient privilege or object protection violation
This example shows the text associated with the condition code in R0.
SDA> EXAMINE/TIME EXE$GQ_SYSTIME
12-DEC-2001 08:23:07.80
This example displays the current system as an ASCII absolute time.
4.10. EXIT
Exits from an SDA display or exits from the SDA utility.
Format
EXIT
Parameters
None.
Qualifiers
None.
Description
If SDA is displaying information on a video display terminal---and if that information extends beyond one screen---SDA enters display mode and displays a screen overflow prompt at the bottom of the screen:
Press RETURN for more.
SDA>
If you want to discontinue the current display at this point, enter the EXIT command. If you want SDA to execute another command, enter that command. SDA discontinues the display as if you entered EXIT, and then executes the command you entered.
When the SDA> prompt is not immediately preceded by the screen overflow prompt, entering EXIT causes your process to cease executing the SDA utility. When issued within a command procedure (either the SDA initialization file or a command procedure invoked with the execute (@) command), EXIT causes SDA to terminate execution of the procedure and return to the SDA prompt.
See Section 2.6.2, ''SDA Display Mode'' for a description of SDA display mode.
4.11. FORMAT
Displays a formatted list of the contents of a block of memory.
Format
FORMAT [/TYPE=block-type] location [/NOSYMBOLIZE][/PAGE][/PHYSICAL]
                        [/POSITIVE]
Parameters
- location
Location of the beginning of the data block. The location can be given as any valid SDA expression.
Qualifiers
- /NOSYMBOLIZE
If /NOSYMBOLIZE is specified, no attempt is made to symbolize the contents of any field in a structure. This is useful if the loaded execlet or activated image lists are corrupted, since symbolization relies on these lists.
- /PAGE
If the output of the formatted structure does not fit on one screen, SDA enters display mode. (For information on this topic, see Section 2.6.2, ''SDA Display Mode''.) By default, SDA displays the formatted structure without screen overflow prompts.
- /PHYSICAL
Specifies that the location given is a physical address.
- /POSITIVE
Symbols that describe negative offsets from the start of the structure are ignored. By default, all symbols for the block type are processed
- /TYPE=block-type
Forces SDA to characterize and format a data block at location as the specified type of data structure. The /TYPE qualifier thus overrides the default behavior of the FORMAT command in determining the type and/or subtype of a data block, as described in the Description section. The block-type can be the symbolic prefix of any data structure defined by the operating system.
Description
The FORMAT command performs the following actions:
Characterizes a range of locations as a system data
Assigns, if possible, a symbol to each item of data within the block
Displays all the data within the block, up to a quadword per line
Whenever successive quadword fields with no symbolic name containing the same value occur, only the first occurrence is output. Ellipses replace all subsequent occurrences.
Most OpenVMS control blocks include two bytes that indicate the block type and/or subtype at offsets 0A16 and 0B16, respectively. The type and/or subtype associate the block with a set of symbols that have a common prefix. Each symbol's name describes a field within the block, and the value of the symbol represents the offset of the field within the block.
If the type and/or subtype bytes contain a valid block type/subtype combination, SDA retrieves the symbols associated with that type of block (see $DYNDEF) and uses their values to format the block.
For a given block type, all associated symbols have the following form:
<block_type>$<field>_<name>
where field is one of the following:
B  Byte
W  Word
L  Longword
Q  Quadword
O  Octaword
A  Address
C  Constant
G  Global Longword
P  Pointer
R  Structure (variable size)
T  Counted ASCII string (up to 31 characters)
If SDA cannot find the symbols associated with the block type specified in the block-type byte or by the /TYPE qualifier, it issues the following message:
%SDA-E-NOSYMBOLS, no <block type> symbols found to format this block
If you receive this message, you may want to read additional symbols into the SDA symbol table and retry the FORMAT command. Many symbols that define OpenVMS data structures are contained within SDA$READ_DIR:SYSDEF.STB. Thus, you would issue the following command:
SDA> READ SDA$READ_DIR:SYSDEF.STB
If SDA issues the same message again, try reading additional symbols. Section 2.5, ''SDA Context'' lists additional modules provided by the OpenVMS operating system. Alternatively, you can create your own object modules with the MACRO-32 Compiler for OpenVMS. See the READ command description for instructions on creating such an object module.
Certain OpenVMS data structures do not contain a block type and/or subtype. If bytes contain information other than a block type/subtype---or do not contain a valid block type/subtype--- SDA either formats the block in a totally inappropriate way, based on the contents of offsets 0A16 and 0B16, or displays the following message:
%SDA-E-INVBLKTYP, invalid block type in specified block
To format such a block, you must reissue the FORMAT command, using the /TYPE qualifier to designate a block-type.
The FORMAT command produces a three-column display containing the following information:
The first column shows the virtual address of each item within the block.
The second column lists each symbolic name associated with a location within the block.
The third column shows the contents of each item in hexadecimal format, including symbolization if a suitable symbol exists.
Examples
SDA> READ SYSDEF
SDA> format  81475D00
FFFFFFFF.81475D00   UCB$L_FQFL           8104EA58          EXE$GL_FKWAITFL+00078
                    UCB$L_MB_MSGQFL
                    UCB$L_RQFL
                    UCB$W_MB_SEED
                    UCB$W_UNIT_SEED
FFFFFFFF.81475D04   UCB$L_FQBL           81412038
                    UCB$L_MB_MSGQBL
                    UCB$L_RQBL
FFFFFFFF.81475D08   UCB$W_SIZE                        0380
FFFFFFFF.81475D0A   UCB$B_TYPE                      10
FFFFFFFF.81475D0B   UCB$B_FLCK                    3A
FFFFFFFF.81475D0C   UCB$L_ASTQFL         81223888          SYS$DKDRIVER+19A88
                    UCB$L_FPC
                    UCB$L_MB_W_AST
                    UCB$T_PARTNER
  .
  .
  .
In this example on an OpenVMS Alpha system, the READ command loads the symbols from SDA$READ_DIR:SYSDEF.STB into SDA's symbol table. The FORMAT command displays the data structure that begins at 81475D0016, a unit control block (UCB). If a field has more than one symbolic name, all such names are displayed. Thus, the field that starts at 81475D0C16 has four designations: UCB$L_ASTQFL, UCB$L_FPC, UCB$L_MB_W_AST, and UCB$T_PARTNER.
The contents of each field appear to the right of the symbolic name of the field. Thus, the contents of UCB$L_FQBL are 8104EA5816
SDA> read sysdef
SDA> read/exec
SDA> format 84191D00
FFFFFFFF.84191D00   SPL$L_OWN_CPU                      00000000
FFFFFFFF.84191D04   SPL$L_OWN_CNT             FFFFFFFF
FFFFFFFF.84191D08   SPL$W_SIZE                             0100
FFFFFFFF.84191D0A   SPL$B_TYPE                           4F
FFFFFFFF.84191D0B   SPL$B_SUBTYPE                      01
FFFFFFFF.84191D0C   SPL$L_SPINLOCK            00000000
FFFFFFFF.84191D10   SPL$L_RANK                         00000000
FFFFFFFF.84191D14   SPL$B_IPL                       1F
                    SPL$L_IPL
FFFFFFFF.84191D15                             000000
FFFFFFFF.84191D18   SPL$L_RLS_PC                       00000000
FFFFFFFF.84191D1C   SPL$L_BUSY_WAITS          00000000
FFFFFFFF.84191D20   SPL$L_WAIT_CPUS                    00000000
FFFFFFFF.84191D24   SPL$L_WAIT_PC             00000000
FFFFFFFF.84191D28   SPL$Q_SPINS               00000000.00000000
FFFFFFFF.84191D30   SPL$Q_ACQ_COUNT           00000000.00008E08
FFFFFFFF.84191D38   SPL$L_TIMO_INT                     000186A0    UCB$M_FLOPPY_MEDIA+006A0
FFFFFFFF.84191D3C   SPL$PS_SHARE_ARRAY        00000000
FFFFFFFF.84191D40   SPL$PS_SHARE_LINK                  00000000
FFFFFFFF.84191D44   SPL$T_NAME                ""
FFFFFFFF.84191D45                             000000
FFFFFFFF.84191D48                             00000000.00000000
FFFFFFFF.84191D50   SPL$Q_RELEASE_COUNT       00000000.00008E08
FFFFFFFF.84191D58   SPL$Q_HISTORY_BITMASK     00000000.00000000
FFFFFFFF.84191D60   SPL$Q_ABUSE_THRESHOLD     00000000.00000000
FFFFFFFF.84191D68   SPL$Q_FLAGS               00000000.00000000
FFFFFFFF.84191D70                             00000000.00000000
       ...                                           ...
FFFFFFFF.84191D80   SPL$Q_ABUSE_BITMASK       00000000.00000000
FFFFFFFF.84191D88                             00000000.00000000
       ...                                           ...
FFFFFFFF.84191DB8                                      00000000
FFFFFFFF.84191DBC   SPL$L_VEC_INX             00000010
FFFFFFFF.84191DC0   SPL$L_OWN_PC_VEC                   8016B7A0    ERL$WAKE_C+00370
FFFFFFFF.84191DC4                             8016BF50             ERL$WAKE_C+00B20
FFFFFFFF.84191DC8                             8016BF50.8016B7A0
       ...                                           ...
FFFFFFFF.84191DD8                             8016B8C0.8016B7A0
FFFFFFFF.84191DE0                             000231E0.00022C20
FFFFFFFF.84191DE8                             00023BF0.000238D0
FFFFFFFF.84191DF0                             000231E0.00022C20

FFFFFFFF.84191DF8                             00023BF0.000238D0
                    SPL$C_LENGTH
   .
   .
   .
In this example on an OpenVMS IA-64 system, the READ command loads the symbols from SYSDEF and the loaded executive images into SDA's symbol table. The FORMAT command displays the data structure that begins at 84191D0016, a spinlock control block (SPL). If a field has more than one symbolic name, all such names are displayed. Thus, the field that starts at 84191D1416 has two designations: SPL$B_IPL and SPL$L_IPL.
The contents of each field appear to the right of the symbolic name of the field. Thus, the contents of SPL$B_IPL is 1F16.
4.12. HELP
Displays information about the SDA utility, its operation, and the format of its commands.
Format
HELP [topic-name]
Parameters
- topic-name
Topic for which you need information. A topic can be an SDA command name such as ATTACH or COPY, the name of an SDA extension such as CLUE or FLT, or a keyword such as Extensions or Process_Context.
If you enter HELP with no topic name, a list of all topics is displayed.
Qualifiers
None.
Description
The HELP command displays brief descriptions of SDA commands and concepts on the terminal screen (or sends these descriptions to the file designated in a SET OUTPUT command). You can request additional information by specifying the name of a topic in response to the Topic? prompt.
If you do not specify a parameter in the HELP command, it lists the features of SDA and those commands and topics for which you can request help, as follows:
Examples
SDA> HELP
HELP


     The System Dump Analyzer (SDA) allows you to inspect the contents
     of memory as saved in the dump taken at crash time or as exists
     in a running system. You can use SDA interactively or in batch
     mode. You can send the output from SDA to a listing file. You can
     use SDA to perform the following operations:

                     Assign a value to a symbol
                     Examine memory of any process
                     Format instructions and blocks of data
                     Display device data structures
                     Display memory management data structures
                     Display a summary of all processes on the system
                     Display the SDA symbol table
                     Copy the system dump file
                     Read global symbols from any object module
                     Search memory for a given value
                     Send output to a file or device

     For help on performing these functions, use the HELP command and
     specify a topic.

     Format

       HELP  [topic-name]


  Additional information available:

     .
     .
     .


Topic?
4.13. MAP
Transforms an address into an offset in a particular image.
Format
MAP address
Parameters
- address
Address to be identified.
Qualifiers
None.
Description
The MAP command identifies the image name and offset corresponding to an address. With this information, you can examine the image map to locate the source module and program section offset corresponding to an address.
If the address is in system space, MAP searches for the specified address in executive images first. It then checks activated images in process space to search those images installed using the /RESIDENT qualifier of the Install utility. Finally, it checks all image-resident sections in system space. If the address is in process space, MAP searches the activated images for the process.
If the address cannot be found, MAP displays the following message:
%SDA-E-NOTINIMAGE, Address not within a system/installed image
On IA-64, the MAP command can also provide additional data for addresses in system space. If the address is determined to be in a code section of an executive loaded image or a resident shareable image, and if the image file is accessible and was linked using /TRACEBACK, the traceback data is used to obtain and display the module name and routine name information.
Examples
SDA> MAP G90308
Image                               Base      End       Image Offset
SYS$VM
Nonpaged read only                  80090000  800ABA00  00000308
Examining the image map identified by this MAP command (SYS$VM.MAP) shows that image offset 308 falls within psect EXEC$HI_USE_PAGEABLE_CODE because the psect goes from offset 0 to offset 45D3:
   .
   .
   .
EXEC$HI_USE_PAGEABLE_CODE       00000000 000045D3 000045D4 ( 17876.) 2 **  5...
                SYSCREDEL       00000000 0000149B 0000149C (  5276.) 2 **  5
                SYSCRMPSC       000014A0 000045D3 00003134 ( 12596.) 2 **  5

EXEC$NONPAGED_CODE              000045E0 0001B8B3 000172D4 ( 94932.) 2 **  5...
                EXECUTE_FAULT   000045E0 0000483B 0000025C (   604.) 2 **  5
                IOLOCK          00004840 000052E7 00000AA8 (  2728.) 2 **  5
                LOCK_SYSTEM_PAGES
   .
   .
   .
Specifically, image offset 308 is located within source module SYSCREDEL. Therefore, to locate the corresponding code, you would look in SYSCREDEL for offset 308 in psect EXEC$HI_USE_PAGEABLE_CODE.
SDA> MAP G550000
Image                            Base         End       Image Offset
SYS$DKDRIVER                     80548000     80558000  00008000
In this example, the MAP command identifies the address as an offset into an executive image that is not sliced. The base and end addresses are the boundaries of the image.
SDA> MAP G550034
Image                            Base         End       Image Offset
SYS$DUDRIVER
      Nonpaged read/write        80550000     80551400  00008034
In this example, the MAP command identifies the address as an offset into an executive image that is sliced. The base and end addresses are the boundaries of the image section that contains the address of interest.
SDA> MAP GF0040
Image Resident Section           Base         End       Image Offset
MAILSHR                          800F0000     80119000  00000040
The MAP command identifies the address as an offset into an image-resident section residing in system space.
SDA> MAP 12000
Activated Image                  Base         End       Image Offset
MAIL                             00010000     000809FF  00002000
The MAP command identifies the address as an offset into an activated image residing in process-private space.
SDA> MAP B2340
Compressed Data Section          Base         End       Image Offset
LIBRTL                           000B2000     000B6400  00080340
The MAP command identifies the address as being within a compressed data section. When an image is installed with the Install utility using the /RESIDENT qualifier, the code sections are mapped in system space. The data sections are compressed into process-private space to reduce null pages or holes in the address space left by the absence of the code section. The SHOW PROCESS/IMAGE=ALL display shows how the data has been compressed; the MAP command searches this information to map an address in a compressed data section to an offset in an image.
SDA> MAP 7FC06000
Shareable Address Data Section          Base      End       Image Offset
LIBRTL                                  7FC06000  7FC16800  00090000
The MAP command identifies the address as an offset into a shareable address data section residing in P1 space.
SDA> MAP 7FC26000
Read-Write Data Section                 Base      End       Image Offset
LIBRTL                                  7FC26000  7FC27000  000B0000
The MAP command identifies the address as an offset into a read-write data section residing in P1 space.
SDA> MAP 7FC36000
Shareable Read-Only Data Section        Base      End       Image Offset
LIBRTL                                  7FC36000  7FC3F600  000C0000
The MAP command identifies the address as an offset into a shareable read-only data section residing in P1 space.
SDA> MAP 7FC56000
Demand Zero Data Section                Base      End       Image Offset
LIBRTL                                  7FC56000  7FC57000  000E0000
The MAP command identifies the address as an offset into a demand zero data section residing in P1 space.
SDA> MAP FFFFFFFF.8042FE00
Image                               Base               End          Image Offset
EXCEPTION_MON
    Code                      FFFFFFFF.8041FE00 FFFFFFFF.804E3DFF 00000000.00028000

    Module:     IPF_DECODE + 00005380
    Routine:    process_i_unit + 00000840
This example shows the additional module and routine offset information that is displayed for system space code sections.
4.14. MODIFY DUMP
Allows a given byte, word, longword, or quadword in the dump file to be modified.
Format
MODIFY DUMP value {/BLOCK=n/OFFSET=n | /NEXT}
{/BYTE | /WORD | /LONGWORD (d) | /QUADWORD}
[/CONFIRM=n]
Parameters
- value
New value deposited in the specified location in the dump file.
Qualifiers
- /BLOCK=n
Indicates block number to be modified. Required unless the /NEXT qualifier is given.
- /OFFSET=n
Indicates byte offset within block to be modified. Required unless the /NEXT qualifier is given.
- /NEXT
Indicates that the byte or bytes immediately following the location altered by the previous MODIFY DUMP command are to be modified. Used instead of the /BLOCK=n and /OFFSET=n qualifiers.
- /BYTE
Indicates that only a single byte is to be replaced
- /WORD
Indicates that a word is to be replaced.
- /LONGWORD
Indicates that a longword is to be replaced. This is the default.
- /QUADWORD
Indicates that a quadword is to be replaced.
- /CONFIRM=n
Checks existing contents of location to be modified.
Description
The MODIFY DUMP command is used on a dump file that cannot be analyzed without specifying the /OVERRIDE qualifier on the ANALYZE/CRASH_DUMP command. You can use the MODIFY DUMP command to correct the problem that prevents normal analysis of a dump file. You can only use the MODIFY DUMP command when you have invoked SDA with the ANALYZE/CRASH_DUMP/OVERRIDE command.
Important
This command is not intended for general use. It is provided for the benefit of VSI support personnel when investigating crash dumps that cannot be analyzed in other ways.
If the block being modified is part of either the dump header, the error log buffers, or the compression map, the changes made are not seen when you issue the appropriate SHOW DUMP command, unless you first exit from SDA and then reissue the ANALYZE/CRASH_DUMP command.
The MODIFY DUMP command sets a bit in the dump header to indicate that the dump has been modified. Subsequent ANALYZE/CRASH_DUMP commands issued to that file produce the following warning message:
%SDA-W-DUMPMOD, dump has been modified
Examples
SDA>> MODIFY DUMP/BLOCK=10/OFFSET=100/WORD FF
This example shows the dump file modified with the word at offset 100 in block 00000010 replaced by 00FF.
SDA>> MODIFY DUMP/BLOCK=10/OFFSET=100/WORD 0/CONFIRM=EE
%SDA-E-NOMATCH, expected value does not match value in dump; dump not updated
This example shows what happens when the actual word value of 00FF at offset 100 in block 00000010 does not match the given value of 00EE.
SDA>> MODIFY DUMP/BLOCK=10/OFFSET=100/WORD 0/CONFIRM=FF
This example shows the dump file modified with a word value of 00FF at offset 100 in block 00000010 replaced by 0000
4.15. READ
Loads the global symbols contained in the specified file into the SDA symbol table.
Format
READ {/EXECUTIVE [directory spec]
 | /FORCE filespec [/RELOCATE =expression |
                        /SYMVA=expression]
| /IMAGE filespec
| filespec}
[ /[NO]LOG]
Parameters
- directory-spec
Name of the directory containing the loadable images of the executive. This parameter defaults to SDA$READ_DIR, which is a search list of SYS$LOADABLE_IMAGES, SYS$LIBRARY, and SYS$SYSTEM.
- filespec
Name of the device, directory, and file from which you want to read global symbols. The default filespec is SYS$DISK:[default-dir]filename.type, where SYS$DISK and [default-dir] represent the disk and directory specified in your last DCL command
SET DEFAULT. If no type has been given in filespec, SDA first tries .STB and then .EXE.If no device or directory is given in the filespec, and the filespec is not found in SYS$DISK:[default-dir], then SDA attempts to open the file SDA$READ_DIR:filename.type. If no type has been given in filespec, SDA first tries .STB and then .EXE.
If the file name is the same as that of an execlet or image, but the symbols in the file are not those of the execlet or image, then you must use the
/FORCEqualifier, and optionally the/RELOCATEand/SYMVAqualifiers, to tell SDA how to interpret the symbols in the file.The
READcommand accepts quoted file names for access to images on ODS-5 disks with lowercase or compound characters in their names.
Qualifiers
- /EXECUTIVE directory-spec
Reads into the SDA symbol table all global symbols and global entry points defined within all loadable images that make up the executive. For all the execlets in the system, SDA reads the .STB or .EXE files in the requested directory.
- /FORCE filespec
Forces SDA to read the symbols file, regardless of what other information or qualifiers are specified. If you do not specify the /FORCE qualifier, SDA may not read the symbols file if the specified filespec matches the image name in either the executive loaded images or the current processes activated image list, and one of the following conditions is true:
The image has a symbols vector (is a shareable image), and a symbols vector was not specified with the /SYMVA or /IMAGE qualifier.
The image is sliced, and slicing information was not provided with the /IMAGE qualifier.
The shareable or executive image is not loaded at the same address it was linked at, and the relocation information was not provided with either the /IMAGE or /RELOCATE qualifier.
The use of /FORCE [/SYMVA=addr][/RELOCATE=addr] filespec is a variant of the /IMAGE qualifier and avoids fixing up the symbols to match an image of the same name.
- /IMAGE filespec
Searches the executive loaded image list and the current process activated image list for the image specified by filespec. If the image is found, the symbols are read in using the image symbol vector (if there is one) and either slicing or relocation information.
This is the preferred way to read in the .STB files produced by the linker. These .STB files contain all universal symbols, unless SYMBOL_TABLE=GLOBAL is in the linker options file, in which case the .STB file contains all universal and global symbols.
- /LOG
- /NOLOG (D)
The /LOG qualifier causes SDA to output the %SDA-I-READSYM message for each symbol table file it reads. By default, these messages are suppressed. You can specify /LOG and /NOLOG with any other combination of parameters and qualifiers.
- /RELOCATE=expression
Changes the relative addresses of the symbols to absolute addresses by adding the value of expression to the value of each symbol in the symbol table file to be read. This qualifier changes those addresses to absolute addresses in the address space into which the dump is mapped.
The relocation only applies to symbols with the relocate flag set. All universal symbols must be found in the symbol vector for the image. All constants are read in without any relocation.
If the image is sliced (image sections are placed in memory at different relative offsets than how the image is linked), then the /RELOCATE qualifier does not work. SDA compares the file name used as a parameter to the READ command against all the image names in the executive loaded image list and the current processes activated image list. If a match is found, and that image contains a symbol vector, an error results. At this point you can either use the /FORCE qualifier or the /IMAGE qualifier to override the error.
- /SYMVA=expression
Informs SDA whether the absolute symbol vector address is for a shareable image (SYS$PUBLIC_VECTORS.EXE) or base system image (SYS$BASE_IMAGE.EXE). All symbols found in the file with the universal flag are found by referencing the symbol vector (that is, the symbol value is a symbol vector offset).
Description
The READ command symbolically identifies locations in memory and the definitions used by SDA for which the default files (SDA$READ_DIR:SYS$BASE_IMAGE.EXE and SDA$READ_DIR:REQSYSDEF.STB) provide no definition. In other words, the required global symbols are located in modules and symbol tables that have been compiled and/or linked separately from the executive. SDA extracts no local symbols from the files.
The file specified in the READ command can be the output of a compiler or assembler (for example, an .OBJ file).
Note
The READ command can read both OpenVMS Alpha and OpenVMS IA-64 format files. Do not use READ to read files that contain symbols specific to another architecture, as this might change the behavior of other SDA commands for the current architecture.
Most often the file is provided in SYS$LOADABLE_IMAGES. Many SDA applications, for instance, need to load the definitions of system data structures by issuing a READ command specifying SYSDEF.STB. Others require the definitions of specific global entry points within the executive image.
The files in SYS$LOADABLE_IMAGES define global locations within executive images, including those listed in the table below. The actual list of executive images used varies, depending on platform type, devices, and the settings of several system parameters.
| File | Contents |
|---|---|
| ACME.EXE | $ACM system service |
| CNX$DEBUG.EXE | Connection Manager trace routines |
| DDIF$RMS_EXTENSION.EXE | Support for Digital Document Interchange Format (DDIF) file operations |
| ERRORLOG.STB | Error-logging routines and system services |
| EXCEPTION.STB | Bugcheck and exception-handling routines and those system services that declare condition and exit handlers. Variations of these files also exist, for example, where the file name ends in "_MON." System parameters such as SYSTEM_CHECK determine which image is loaded. |
| EXEC_INIT.STB | Initialization code |
| F11BXQP.STB | File system support |
| FC$GLOGALS.STB | Fibrechannel symbols |
| IMAGE_MANAGEMENT.STB | Image activator and the related system services |
| IO_ROUTINES.STB | $QIO system service, related system services (for example, $CANCEL and $ASSIGN), and supporting routines. Variations of these files also exist, for example, where the file name ends in "_MON." System parameters such as SYSTEM_CHECK determine which image is loaded. |
| LAT$RATING.EXE | CPU load-balancing routines for LAT |
| LCK$DEBUG.EXE | Lock manager trace routines |
| LMF$GROUP_TABLE.EXE | Data structures for licensed product groups. Alpha only. |
| LOCKING.STB | Lock management routines and system services |
| LOGICAL_NAMES.STB | Logical name routines and system services |
| MESSAGE_ROUTINES.STB | System message routines and system services (including $SNDJBC and $GETTIM) |
| MSCP.EXE | Disk MSCP server |
| MULTIPATH.STB | Fibrechannel multipath support routinesю Variations of these files also exist, for example, where the file name ends in "_MON." System parameters such as SYSTEM_CHECK determine which image is loaded. |
| NET$CSMACD.EXE | CSMA/CD LAN management module |
| NET$FDDI.EXE | FDDI LAN management module |
| NT_EXTENSION.EXE | NT extensions for persona system services |
| PROCESS_MANAGEMENT.STB | Scheduler, report system event, and supporting routines and system services. Variations of these files also exist, for example, where the file name ends in "_MON." System parameters such as SYSTEM_CHECK determine which image is loaded. |
| RECOVERY_UNIT_SERVICES.STB | Recovery unit system services |
| RMS.EXE | Global symbols and entry points for RMS |
| SECURITY.STB | Security management routines and system services. Variations of these files also exist, for example, where the file name ends in "_MON." System parameters such as SYSTEM_CHECK determine which image is loaded. |
| SHELL xxK.STB | Process shell |
| SPL$DEBUG.EXE | Spinlock trace routines |
| SSPI.EXE | Security Support Provider Interface |
| SYS$ xxDRIVER.EXE | Run-time device drivers |
| SYS$ACPI.EXE | Advanced Configuration and Power Interface routines. (IA-64 only) |
| SYS$ATMWORKS351.EXE | PCI-ATM driver |
| SYS$CLUSTER.EXE | OpenVMS Cluster support routines |
| SYS$CPU_ROUTINES_ xxxx.EXE | Processor-specific data and initialization routines. Alpha only. |
| SYS$EW1000A.EXE | Gigabit Ethernet driver |
| SYS$EW5700.EXE | Gigabit Ethernet driver. (IA-64 only) |
| SYS$GALAXY.STB | OpenVMS Galaxy support routines |
| SYS$HWP nnnn.EXE | PCI support routines. (IA-64 only) |
| SYS$IPC_SERVICES.EXE | Interprocess communication for DECdtm and Batch/Print |
| SYS$IPI nnnn.EXE | PCI support routines. (IA-64 only) |
| SYS$LAN.EXE | Common LAN routines |
| SYS$LAN_ATM.EXE | LAN routines for ATM |
| SYS$LAN_ATM4.EXE | LAN routines for ATM (ForeThought) |
| SYS$LAN_CSMACD.EXE | LAN routines for CSMA/CD |
| SYS$LAN_FDDI.EXE | LAN routines for FDDI |
| SYS$LAN_TR.EXE | LAN routines for Token Ring |
| SYS$MME_SERVICES.STB | Media Management Extensions |
| SYS$NETWORK_SERVICES.EXE | DECnet support |
| SYS$NTA.STB | NT affinity routines and services |
| SYS$ xxxx_SUPPORT.EXE | Processor-specific data and initialization routines. (IA-64 only) |
| SYS$PUBLIC_VECTORS.EXE | System service vector base image. This file is located in SYS$LIBRARY. |
| SYS$SCS.EXE | System Communication Services |
| SYS$TRANSACTION_SERVICES.EXE | DECdtm services |
| SYS$UTC_SERVICES.EXE | Universal Coordinated Time services |
| SYS$VCC.STB | Virtual I/O cache. Variations of these files also exist, for example, where the file name ends in "_MON." System parameters such as SYSTEM_CHECK determine which image is loaded. (Alpha only) |
| SYS$VM.STB | System pager and swapper, along with their supporting routines, and management system services |
| SYS$XFCACHE.STB | Extented File Cache. Variations of these files also exist, for example, where the file name ends in "_MON." System parameters such as SYSTEM_CHECK determine which image is loaded. |
| SYSDEVICE.STB | Mailbox driver and null driver |
| SYSGETSYI.STB | Get System Information system service ($GETSYI) |
| SYSLDR_DYN.STB | Dynamic executive image loader |
| SYSLICENSE.STB | Licensing system service ($LICENSE) |
| SYSTEM_DEBUG.EXE | XDelta and SCD routines |
| SYSTEM_PRIMITIVES.STB | Miscellaneous basic system routines, including those that allocate system memory, maintain system time, create fork processes, and control mutex acquisition. Variations of these files also exist, for example, where the file name ends in "_MON." System parameters such as SYSTEM_CHECK determine which image is loaded. |
| SYSTEM_SYNCHRONIZATION.STB | Routines that enforce synchronization. Variations of these files also exist, for example, where the file name ends in "_MON." System parameters such as SYSTEM_CHECK determine which image is loaded. |
| TCPIP$BGDRIVER.STB | TCP/IP internet driver. Available only if TCP/IP has been installed. |
| TCPIP$INETACP.STB | TCP/IP internet ACP Available only if TCP/IP has been installed. |
| TCPIP$INETDRIVER.STB | TCP/IP internet driver. Available only if TCP/IP has been installed. |
| TCPIP$INTERNET_SERVICES.STB | TCP/IP internet execlet |
| TCPIP$NFS_SERVICES.STB | Symbols for the TCP/IP NFS server. Available only if TCP/IP has been installed. |
| TCPIP$PROXY_SERVICES.STB | Symbols for the TCP/IP proxy execlet. Available only if TCP/IP has been installed. |
| TCPIP$PWIPACP.STB | TCP/IP PWIP ACP. Available only if TCP/IP has been installed. |
| TCPIP$PWIPDRIVER.STB | TCP/IP PWIP driver. Available only if TCP/IP has been installed. |
| TCPIP$TNDRIVER.STB | TCP/IP TELNET/RLOGIN server driver. Available only if TCP/IP has been installed. |
| TMSCP.EXE | Tape MSCP server |
| VMS_EXTENSION.EXE | VMS extensions for persona system services |
SDA can also read symbols from an image .EXE or .STB produced by the linker. The STB and EXE files only contain universal symbols. The STB file, however, can be forced to have global symbols for the image if you use the SYMBOL_TABLE=GLOBAL option in the linker options file.
A number of ready-built symbol table files ship with OpenVMS. They can be found in the directory SYS$LOADABLE_IMAGES, and all have names of the form xyzDEF.STB. Of these files, SDA automatically reads REQSYSDEF.STB on activation. You can add the symbols in the other files to SDA's symbol table using the READ command. Table 2.5, ''Modules Containing SDA Global Symbols and Data Structures'' lists the files that OpenVMS provides in SYS$LOADABLE_IMAGES that define data structure offsets.
The following MACRO program, GLOBALS.MAR, shows how to obtain symbols in addition to those in SYS$BASE_IMAGE.EXE, other executive images listed in Table 4.1, ''Modules Defining Global Locations Within Executive Images'', and the symbol table files that are listed in Table 2.5, ''Modules Containing SDA Global Symbols and Data Structures'':
.TITLE GLOBALS
; n.b. on following lines GLOBAL must be capitalized
$PHDDEF GLOBAL          ; Process header definitions
$DDBDEF GLOBAL          ; Device data block
$UCBDEF GLOBAL          ; Unit control block
$VCBDEF GLOBAL          ; Volume control block
$ACBDEF GLOBAL          ; AST control block
$IRPDEF GLOBAL          ; I/O request packet
; more can be inserted here
.END
Use the following command to generate an object module file containing the globals defined in the program:
$MACRO GLOBALS+SYS$LIBRARY:LIB/LIBRARY /OBJECT=GLOBALS.STB
Examples
SDA>  READ SDA$READ_DIR:SYSDEF.STB/LOG
%SDA-I-READSYM, 10010 symbols read from SYS$COMMON:[SYSEXE]SYSDEF.STB;1
The READ command causes SDA to add all the global symbols in SDA$READ_DIR:SYSDEF.STB to the SDA symbol table. Such symbols are useful when you are formatting an I/O data structure, such as a unit control block or an I/O request packet.
SDA> SHOW STACK
Process stacks (on CPU 00)
--------------------------
Current operating stack (KERNEL):

        00000000.7FF95CD0  FFFFFFFF.80430CE0  SCH$STATE_TO_COM+00040
        00000000.7FF95CD8  00000000.00000000
        00000000.7FF95CE0  FFFFFFFF.81E9CB04  LNM$SEARCH_ONE_C+000E4
        00000000.7FF95CE8  FFFFFFFF.8007A988  PROCESS_MANAGEMENT_NPRO+0E988
   SP =>00000000.7FF95CF0  00000000.00000000
        00000000.7FF95CF8  00000000.006080C1
        00000000.7FF95D00  FFFFFFFF.80501FDC
        00000000.7FF95D08  FFFFFFFF.81A5B720
   .
   .
   .

SDA>  READ/IMAGE SYS$LOADABLE_IMAGES:PROCESS_MANAGEMENT/LOG
%SDA-I-READSYM, 767 symbols read from SYS$COMMON:[SYS$LDR]PROCESS_MANAGEMENT.STB;1
SDA>  SHOW STACK
Process stacks (on CPU 00)
--------------------------
Current operating stack (KERNEL):

        00000000.7FF95CD0  FFFFFFFF.80430CE0  SCH$FIND_NEXT_PROC
        00000000.7FF95CD8  00000000.00000000
        00000000.7FF95CE0  FFFFFFFF.81E9CB04  LNM$SEARCH_ONE_C+000E4
        00000000.7FF95CE8  FFFFFFFF.8007A988  SCH$INTERRUPT+00068
   SP =>00000000.7FF95CF0  00000000.00000000
        00000000.7FF95CF8  00000000.006080C1
        00000000.7FF95D00  FFFFFFFF.80501FDC
        00000000.7FF95D08  FFFFFFFF.81A5B720
   .
   .
   .
The initial SHOW STACK command contains an address that SDA resolves into an offset from the PROCESS_MANAGEMENT executive image. The READ command loads the corresponding symbols into the SDA symbol table such that the reissue of the SHOW STACK command subsequently identifies the same location as an offset within a specific process management routine.
4.16. REPEAT
Repeats execution of the last command issued. On terminal devices, the KP0 key performs the same function as the REPEAT command with no parameter or qualifier.
Format
REPEAT [count | /UNTIL=condition]
Parameter
- count
Number of times the previous command is to be repeated. The default is a single repeat.
Qualifier
- /UNTIL=condition
Defines a condition that terminates the REPEAT command. By default, there is no terminating condition.
Description
The REPEAT command is useful for stepping through a linked list of data structures, or for examining a sequence of memory locations. When used with ANALYZE/SYSTEM, it allows the changing state of a system location or data structure to be monitored.
You can also use the REPEAT command to provide a convenient method of either displaying a series of data structures in a linked list or examining a sequence of locations. For example:
FORMAT @IOC$GL_DEVLIST   ! Start at first DDB in system
FORMAT @.                ! Skip to next entry in list
<KP0>                    ! Repeat FORMAT @. command
.
.
.
Examples
SDA> SPAWN CREATE SDATEMP.COM
SEARCH  0:3FFFFFFF   12345678
SET PROCESS/NEXT
^Z
SDA>  SET PROCESS NULL
SDA>  @SDATEMP
SDA>  REPEAT/UNTIL = BADPROC
This example demonstrates how to search the address space of each process in a system or dump a given pattern.
SDA> SPAWN CREATE SDATEMP2.COM
FORMAT CPUDB
SET CPU /NEXT
^Z
SDA>  READ SYSDEF
SDA>  SET CPU /FIRST
SDA>  @SDATEMP2
SDA>  REPEAT/UNTIL = BADCPU
This example demonstrates how to format the CPU database for every CPU in a dump.
SDA> SHOW CALL_FRAME
Call Frame Information
----------------------
        Stack Frame Procedure Descriptor
Flags:  Base Register = FP, Jacket, Native
        Procedure Entry: FFFFFFFF.80080CE0           MMG$RETRANGE_C+00180
        Return address on stack = FFFFFFFF.8004CF30  EXCEPTION_NPRO+00F30

Registers saved on stack
------------------------
7FF95E80 FFFFFFFF.FFFFFFFD  Saved R2
7FF95E88 FFFFFFFF.8042DBC0  Saved R3      EXCEPTION_NPRW+03DC0
7FF95E90 FFFFFFFF.80537240  Saved R4
7FF95E98 00000000.00000000  Saved R5
7FF95EA0 FFFFFFFF.80030960  Saved R6      MMG$IMGRESET_C+00200
7FF95EA8 00000000.7FF95EC0  Saved R7
7FF95EB0 FFFFFFFF.80420E68  Saved R13     MMG$ULKGBLWSL E
7FF95EB8 00000000.7FF95F70  Saved R29
.
.
.
SDA> SHOW CALL_FRAME/NEXT_FRAME

Call Frame Information
----------------------
        Stack Frame Procedure Descriptor
Flags:  Base Register = FP, Jacket, Native
        Procedure Entry: FFFFFFFF.80F018D0              IMAGE_MANAGEMENT_PRO+078D0
        Return address on stack = FFFFFFFF.8004CF30     EXCEPTION_NPRO+00F30

Registers saved on stack
------------------------
7FF95F90 FFFFFFFF.FFFFFFFB  Saved R2
7FF95F98 FFFFFFFF.8042DBC0  Saved R3      EXCEPTION_ NPRW+03DC0
7FF95FA0 00000000.00000000  Saved R5
7FF95FA8 00000000.7FF95FC0  Saved R7
7FF95FB0 FFFFFFFF.80EF8D20  Saved R13     ERL$DEVINF O+00C20
7FF95FB8 00000000.7FFA0450  Saved R29
.
.
.
SDA> REPEAT
Call Frame Information
----------------------
        Stack Frame Procedure Descriptor
Flags:  Base Register = FP, Jacket, Native
        Procedure Entry: FFFFFFFF.80F016A0              IMAGE_MANAGEMENT_PRO+076A0
        Return address on stack = 00000000.7FF2451C

Registers saved on stack
------------------------
7FFA0470 00000000.7FEEA890  Saved R13
7FFA0478 00000000.7FFA0480  Saved R29
.
.
.
The first SHOW CALL_FRAME displays the call frame indicated by the current FP value. Because the /NEXT_FRAME qualifier to the instruction displays the call frame indicated by the saved frame in the current call frame, you can use the REPEAT command to repeat the SHOW CALL_FRAME/NEXT_FRAME command and follow a chain of call frames.
4.17. SEARCH
Scans a range of memory locations for all occurrences of a specified value or string.
Format
SEARCH [/qualifier] range [=] {expression | string}
Parameters
- range
Location in memory to be searched. A location can be represented by any valid SDA expression. To search a range of locations, use the following syntax:
m:n Range of locations to be searched, from m to n m;n Range of locations to be searched, starting at m and continuing for n bytes You must use either an equals sign or a blank to separate range from expression or string.
- expression
Value for which SDA is to search. SDA evaluates the expression and searches the specified range of memory for the resulting value. For a description of SDA expressions, see Section 2.6.1, ''Using Expressions and Operators''.
- string
Character sequence for which SDA is to search. If all characters in the sequence are printable characters, the string is enclosed in quotes, for example, "My_String". If the character sequence contains non-printable characters, it must be specified as a comma-separated list composed of quoted strings and hexadecimal numbers; for example,("My_String",0C00,"More") would specify a search for"My_String<NUL><FF>More". Each hexadecimal number can be no more than 8 digits (4 bytes) in length. Non-printable sequences of more than 4 bytes must be split into multiple hexadecimal numbers. The maximum length of a search string is 127 bytes. Note that the quote character itself cannot be included in a quoted string and must be specified as a hexadecimal number.
Qualifiers
- /IGNORE_CASE
Specifies that searches for strings are not to be case-specific. (By default, searches look for an exact match.) This qualifier is ignored for value searches.
- /LENGTH={QUADWORD | LONGWORD | WORD | BYTE}
Specifies the size of the expression value that the SEARCH command uses for matching. If you do not specify the /LENGTH qualifier, the SEARCH command uses a longword length by default. This qualifier is ignored for string searches.
- /MASK=n
Allows the SEARCH command finer granularity in its matches. It compares only the given bits of a byte, word, longword, or quadword. To compare bits when matching, you set the bits in the mask; to ignore bits when matching, you clear the bits in the mask. This qualifier is ignored for string searches.
- /PHYSICAL
Specifies that the addresses used to define the range of locations to be searched are physical addresses.
- /STEPS = {QUADWORD | LONGWORD | WORD | BYTE | value}
Specifies the step factor of the search through the specified memory range. After the SEARCH command has performed the comparison between the value of expression or the given string and memory location, it adds the specified step factor to the address of the memory location. The resulting location is the next location to undergo the comparison. If you do not specify the /STEPS qualifier, the SEARCH command uses a step factor of a longword for value searches, and a step factor of a byte for string searches.
Description
SEARCH displays each location as each value or string is found. If you press Ctrl/T while using the SEARCH command, the system displays how far the search has progressed. The progress display is always output to the terminal even if a SET OUTPUT <file> command has previously been entered.
Examples
SDA> SEARCH GB81F0;500 B41B0000
Searching from FFFFFFFF.800B81F0 to FFFFFFFF.800B86EF in LONGWORD steps for B41B0000...
Match at FFFFFFFF.800B86E4    B41B0000
This SEARCH command finds the value B41B0000 in the longword at FFFFFFFF.800B86E4.
SDA> SEARCH 80000000;200/STEPS=BYTE 82
Searching from FFFFFFFF.80000000 to FFFFFFFF.800001FF in BYTE steps for 00000082...
Match at FFFFFFFF.8000012C    00000082
This SEARCH command finds the value 00000082 in the longword at FFFFFFFF.8000012C.
SDA> SEARCH/LENGTH=WORD 80000000;100 10
Match at FFFFFFFF.80000030    0010
Match at FFFFFFFF.80000040    0010
Match at FFFFFFFF.80000090    0010
Match at FFFFFFFF.800000A0    0010
Match at FFFFFFFF.800000C0    0010
5 matches found
This SEARCH command finds the value 0010 in the words at FFFFFFFF.80000030, FFFFFFFF.80000040, FFFFFFFF.80000090, FFFFFFFF.800000A0, FFFFFFFF.800000C0.
SDA> SEARCH/MASK=FF000000 80000000;40 20000000
Searching from FFFFFFFF.80000000 to FFFFFFFF.8000003F in LONGWORD steps for 20000000...
(Using search mask of FF000000)
Match at FFFFFFFF.80000000    201F0104
Match at FFFFFFFF.80000010    201F0001
2 matches found
This SEARCH command finds the value 20 in the upper byte of the longwords at FFFFFFFF.80000000 and FFFFFFFF.80000010, regardless of the contents of the lower 3 bytes.
SDA> SEARCH g:i ("test",01020304,"this",05060708,"again")
 Searching from FFFFFFFF.80000000 to FFFFFFFF.FFFFFFFF in byte steps for "test....this....again"...
 (74,65,73,74,04,03,02,01,74,68 ,69,73,08,07,06,05,61,67,61,69,6E)
 No matches found
This example combines quoted strings and hexadecimal values to form a character sequence to be used in a search. Note the order in which the bytes within each hexadecimal number are inserted into the search sequence: the least significant byte of the hexadecimal number is the first byte added to the search sequence.
4.18. SET CPU
When analyzing a system dump, selects a processor to become the current
CPU for SDA. When invoked under ANALYZE/SYSTEM, SET CPU lists the database
address for the specified CPU before exiting with the message:
%SDA-E-CMDNOTVLD command not valid on the running
                    system
Format
SET CPU {cpu-id | /FIRST | /NEXT | /PRIMARY }
                    [/NOLOG]
Parameter
- cpu-id
Numeric value indicating the identity of the processor to be made the current CPU. If you specify the cpu-id of a processor that was not active at the time of the system failure, SDA displays the following message:
%SDA-E-CPUNOTVLD, CPU not booted or CPU number out of range
Qualifiers
- /FIRST
The lowest numbered CPU (not necessarily the primary CPU) is set as the current CPU.
- /NEXT
The next higher numbered CPU is set as the current CPU. SDA skips CPUs not in the configuration at the time of the system failure. If there are no further CPUs, SDA returns an error.
- /NOLOG
Use the /NOLOG qualifier to inhibit output of the database address for the CPU being set.
- /PRIMARY
The primary CPU is set as the current CPU.
Description
When you invoke SDA to examine a system dump, the current CPU context for SDA defaults to that of the processor that caused the system to fail. When analyzing a system failure from a multiprocessing system, you may find it useful to examine the context of another processor in the configuration.
The SET CPU command changes the current CPU context for SDA to that of the processor indicated by cpu-id. The CPU specified by this command becomes the current CPU for SDA until you either exit from SDA or change the CPU context for SDA by issuing one of the following commands:
SET CPU cpu-id
SET CPU /FIRST
SET CPU /NEXT
SET CPU /PRIMARY
SHOW CPU cpu-id
SHOW CPU /FIRST
SHOW CPU /NEXT
SHOW CPU /PRIMARY
SHOW CRASH
SHOW MACHINE_CHECK cpu-id
Changing CPU context can cause an implicit change in process context under the following circumstances:
If there is a current process on the CPU made current, SDA changes its process context to that of that CPU's current process.
If there is no current process on the CPU made current, the SDA process context is undefined and no process-specific information is available until you set the SDA process context to that of a specific process.
The following commands also change the CPU context for SDA to that of the CPU on which the process was most recently current:
SET PROCESS process-name
SET PROCESS/ADDRESS=pcb-address
SET PROCESS/INDEX=nn
SET PROCESS/NEXT
SHOW PROCESS process-name
SHOW PROCESS/ADDRESS=pcb-address
SHOW PROCESS/INDEX=nn
SHOW PROCESS/NEXT
VALIDATE PROCESS/POOL process-name
VALIDATE PROCESS/POOL/ADDRESS=pcb-address
VALIDATE PROCESS/POOL/INDEX=nn
VALIDATE PROCESS/POOL/NEXT
See Section 2.5, ''SDA Context'' for further discussion of the way in which SDA maintains its context information.
See the description of the REPEAT command for an example of the use of SET CPU/NEXT command.
4.19. SET ERASE_SCREEN
Enables or disables the automatic clearing of the screen before each new page of SDA output.
Format
SET ERASE_SCREEN {ON | OFF}
Parameters
- ON
Enables the screen to be erased before SDA outputs a new heading. This setting is the default.
- OFF
Disables the erasing of the screen.
Description
SDA's usual behavior is to erase the screen and then show the data. By setting the OFF parameter, the clear screen action is replaced by a blank line. This action does not affect what is written to a file when the SET LOG or SET OUTPUT commands are used.
Examples
SDA> SET ERASE_SCREEN ON
The clear screen action is now enabled.
SDA> SET ERASE_SCREEN OFF
The clear screen action is disabled.
4.20. SET FETCH
Sets the default size and access method of address data used when SDA evaluates an expression that includes the @ unary operator.
Format
SET FETCH [{QUADWORD | LONGWORD | WORD | BYTE}]
[, {PHYSICAL | VIRTUAL} ]
Parameters
- QUADWORD
Sets the default size to 8 bytes.
- LONGWORD
Sets the default size to 4 bytes.
- WORD
Sets the default size to 2 bytes.
- BYTE
Sets the default size to 1 byte.
- PHYSICAL
Sets the default access method to physical addresses.
- VIRTUAL
Sets the default access method to virtual addresses.
You can specify only one parameter out of each group. If you are changing both size and access method, separate the two parameters by spaces or a comma. Include a comma only if you are specifying a parameter from both groups. See Example 6.
Qualifiers
None.
Description
Sets the default size and/or default access method of address data used by the @ unary operator in commands such as EXAMINE and EVALUATE. SDA uses the current default size unless it is overridden by the ^Q, ^L, ^W, or ^B qualifier on the @ unary operator in an expression. SDA uses the current default access method unless it is overridden by the ^P or ^V qualifier on the @ unary operator in an expression.
Examples
SDA>  EXAMINE MMG$GQ_SHARED_VA_PTES
MMG$GQ_SHARED_VA_PTES:  FFFFFFFD.FF7FE000   ".`a....."
This example shows the location's contents of a 64-bit virtual address.
SDA> SET FETCH LONG
SDA> EXAMINE @MMG$GQ_SHARED_VA_PTES
%SDA-E-NOTINPHYS, FFFFFFFF.FF7FE000 : virtual data not in physical memory
This example shows a failure because the SET FETCH LONG causes SDA to assume that it should take the lower 32 bits of the location's contents as a longword value, sign-extend them, and use that value as an address.
SDA> EXAMINE @^QMMG$GQ_SHARED_VA_PTES
FFFFFFFD.FF7FE000:  000001D0.40001119   "...@..."
This example shows the correct results by overriding the SET FETCH LONG with the ^Q qualifier on the @ operator. SDA takes the full 64 bits of the location's contents and uses that value as an address.
SDA> SET FETCH QUAD
SDA> EXAMINE @MMG$GQ_SHARED_VA_PTES
FFFFFFFD.FF7FE000:  000001D0.40001119   "...@..."
This example shows the correct results by changing the default fetch size to a quadword.
SDA> SET FETCH PHYSICAL
SDA> EXAMINE /PHYSICAL @0
This command uses the contents of the physical location 0 as the physical address of the location to be examined.
SDA> SET FETCH QUADWORD, PHYSICAL
This command sets the default fetch size and default access method at the same time.
4.21. SET LOG
Initiates or discontinues the recording of an SDA session in a text file.
Format
SET [NO]LOG filespec
Parameter
- filespec
Name of the file in which you want SDA to log your commands and their output. The default filespec is SYS$DISK:[default_dir]filename.LOG, where SYS$DISK and [default-dir] represent the disk and directory specified in your last DCL command
SET DEFAULT. If you specifySET LOGwithout a filespec or specifySET NOLOG, SDA stops recording the session and directs all output to SYS$OUTPUT.
Qualifier
None.
Description
The SET LOG command echoes the commands and output of an SDA session to a log file. The SET NOLOG command terminates this behavior.
The following differences exist between the SET LOG command and the SET OUTPUT command:
When logging is in effect, your commands and their results are still displayed on your terminal. The SET OUTPUT command causes the displays to be redirected to the output file and they no longer appear on the screen.
If an SDA command requires that you press Return to produce successive screens of display, the log file produced by SET LOG will record only those screens that are actually displayed. SET OUTPUT, however, sends the entire output of any SDA commands to its listing file.
The SET LOG command produces a log file with a default file type of .LOG; the SET OUTPUT command produces a listing file whose default file type is .LIS.
The SET OUTPUT command can generate a table of contents, each item of which refers to a display written to its listing file. SET OUTPUT also produces running heads for each page of output. The SET LOG command does not produce these items in its log file.
If you use the SET OUTPUT command to redirect output to a listing file, a SET LOG command to direct the same output to a log file is ineffective until output is restored to the terminal.
4.22. SET OUTPUT
Redirects output from SDA to the specified file or device.
Format
SET OUTPUT [/[NO]INDEX | /[NO]HEADER | /PERMANENT | /SINGLE_COMMAND]
                        filespec
Parameter
- filespec
Name of the file to which SDA is to send the output generated by its commands. The default filespec is SYS$DISK:[default_dir]filename.LIS, where SYS$DISK and [default-dir] represent the disk and directory specified in your last DCL command
SET DEFAULT. You must specify a filespec unless/PERMANENTis specified.
Qualifiers
- /INDEX
/NOINDEX The /INDEX qualifier causes SDA to include an index page at the beginning of the output file. This is the default unless you specify /NOHEADER or modify the default with a SET OUTPUT/PERMANENT command. The /NOINDEX qualifier causes SDA to omit the index page from the output file.
- /HEADER
/NOHEADER The /HEADER qualifier causes SDA to include a heading at the top of each page of the output file. This is the default unless you modify it with a SET OUTPUT/PERMANENT command. The /NOHEADER qualifier causes SDA to omit the page headings. Use of /NOHEADER implies /NOINDEX.
- /PERMANENT
Modifies the defaults for /[NO]HEADER and /[NO]INDEX. Specify either or both qualifiers with or without a NO prefix to set new defaults. Setting the default to /NOHEADER implies a default of /NOINDEX. The new defaults remain in effect until another SET OUTPUT/PERMANENT command is entered or the SDA session is ended.
You cannot combine /PERMANENT and /SINGLE_COMMAND in one command, and you cannot provide a filespec with /PERMANENT.
- /SINGLE_COMMAND
Indicates to SDA that the output for a single command is to be written to the specified file and that subsequent output should be written to the terminal. /SINGLE_COMMAND cannot be combined with /PERMANENT.
Description
When you use the SET OUTPUT command to send the SDA output to a file or device, SDA continues displaying the SDA commands that you enter but sends the output generated by those commands to the file or device you specify. (See the description of the SET LOG command for a list of differences between the SET LOG and SET OUTPUT commands.)
When you finish directing SDA commands to an output file and want to return to interactive display, issue the following command:
SDA> SET OUTPUT SYS$OUTPUT
You do not need this command when you specify the /SINGLE_COMMAND qualifier on the original SET OUTPUT command.
If you use the SET OUTPUT command to send the SDA output to a listing file and do not specify /NOINDEX or /NOHEADER, SDA builds a table of contents that identifies the displays you selected and places the table of contents at the beginning of the output file. The SET OUTPUT command formats the output into pages and produces a running head at the top of each page, unless you specify /NOHEADER.
If the table of contents does not fit on a single index page at the beginning of the listing file, SDA will insert additional index pages as necessary. These are inserted into the listing file immediately preceding the pages that are listed in each index page. Each index page includes the page number for the adjacent index pages.
Note
See the description of the DUMP command for use of SET OUTPUT/NOHEADER.
4.23. SET PROCESS
Selects a process to become the SDA current process.
Format
SET PROCESS {/ADDRESS=pcb-address | process-name | /ID=nn | /INDEX=nn
                        | /NEXT | /SYSTEM}
Parameter
- process-name
Name of the process to become the SDA current process. The process-name can contain up to 15 uppercase letters, numerals, the underscore (_), dollar sign ($), colon (:), and some other printable characters. If it contains any other characters (including lowercase letters), you may need to enclose the process-name in quotation marks (" ").
Qualifiers
- /ADDRESS = pcb-address
Specifies the process control block (PCB) address of a process in order to display information about the process.
- /ID=nn
- /INDEX=nn
- Specifies the process for which information is to be displayed either by its index into the system's list of software process control blocks (PCBs), or by its process identification. /ID and /INDEX are functionally equivalent. You can supply the following values for nn:
The process index itself.
The process identification (PID) or extended PID longword, from which SDA extracts the correct index. The PID or extended PID of any thread of a process with multiple kernel threads may be specified. Any thread-specific data displayed by further commands will be for the given thread.
To obtain these values for any given process, issue the SDA command SHOW SUMMARY/THREADS. The /ID=nn and /INDEX=nn qualifiers can be used interchangeably.
- /NEXT
Causes SDA to locate the next valid process in the process list and select that process. If there are no further valid processes in the process list, SDA returns an error.
- /SYSTEM
Specifies the new current process by the system process control block (PCB). The system PCB and process header (PHD) parallel the data structures that describe processes. They contain the system working set list, global section table, and other systemwide data.
Description
When you issue an SDA command such as EXAMINE, SDA displays the contents of memory locations in its current process. To display any information about another process, you must change the current process with the SET PROCESS command.
When you invoke SDA to analyze a crash dump, the process context defaults to that of the process that was current at the time of the system failure. If the failure occurred on a multiprocessing system, SDA sets the CPU context to that of the processor that caused the system to fail. The process context is set to that of the process that was current on that processor.
When you invoke SDA to analyze a running system, its process context defaults to that of the current process, that is, the one executing SDA.
The SET PROCESS command changes the current SDA process context to that of the process indicated by process-name, pcb-address, or /INDEX=nn. The process specified by this command becomes the current process for SDA until you either exit from SDA or change SDA process context by issuing one of the following commands:
SET PROCESS process-name
SET PROCESS/ADDRESS=pcb-address
SET PROCESS/INDEX=nn
SET PROCESS/NEXT
SET PROCESS/SYSTEM
SHOW PROCESS process-name
SHOW PROCESS/ADDRESS=pcb-address
SHOW PROCESS/INDEX=nn
SHOW PROCESS/NEXT
SHOW PROCESS/SYSTEM
VALIDATE PROCESS/POOL process-name
VALIDATE PROCESS/POOL/ADDRESS=pcb-address
VALIDATE PROCESS/POOL/INDEX=nn
VALIDATE PROCESS/POOL/NEXT
VALIDATE PROCESS/POOL/SYSTEM
When you analyze a crash dump from a multiprocessing system, changing process context causes a switch of CPU context as well. When you issue a SET PROCESS command, SDA automatically changes its CPU context to that of the CPU on which that process was most recently current.
The following commands will also switch process context when analyzing a system dump, if there was a current process on the target CPU at the time of the crash:
SET CPU cpu-id
SET CPU /FIRST
SET CPU /NEXT
SET CPU /PRIMARY
SHOW CPU cpu-id
SHOW CPU /FIRST
SHOW CPU /NEXT
SHOW CPU /PRIMARY
SHOW CRASH
SHOW MACHINE_CHECK cpu-id
See Section 2.5, ''SDA Context'' for further discussion of the way in which SDA maintains its context information.
Examples
SDA> SET PROCESS/ADDRESS=80D772C0
SDA> SHOW PROCESS
Process index: 0012   Name: ERRFMT   Extended PID: 00000052
-----------------------------------------------------------
Process status:  02040001   RES,PHDRES,INTER
        status2: 00000001   QUANTUM_RESCHED

PCB address              80D772CO    JIB address              80556600
PHD address              80477200    Swapfile disk address    01000F01
KTB vector address       80D775AC    HWPCB address            81260080
Callback vector address  00000000    Termination mailbox          0000
Master internal PID      00010004    Subprocess count                0
Creator extended PID     00000000    Creator internal PID     00000000
Previous CPU Id          00000000    Current CPU Id           00000000
Previous ASNSEQ  0000000000000001    Previous ASN     000000000000002E
Initial process priority        4    Delete pending count            0
# open files allowed left     100    Direct I/O count/limit        150/150
UIC                [00001,000004]    Buffered I/O count/limit      149/150
Abs time of last event   0069D34E    BUFIO byte count/limit      99424/99808
ASTs remaining                247    # of threads                    1
Swapped copy of LEFC0    00000000    Timer entries allowed left     63
Swapped copy of LEFC1    00000000    Active page table count         4
Global cluster 2 pointer 00000000    Process WS page count          32
Global cluster 3 pointer 00000000    Global WS page count           31
The SET PROCESS command switches SDA's current process context to the process whose PCB is at address 80D772C0. The SHOW PROCESS command shows that the process is ERRFMT, and displays information from its PCB and job information block (JIB).
See the description of the REPEAT command for an example of the use of the SET PROCESS/NEXT command.
4.24. SET RMS
Changes the options shown by the SHOW PROCESS/RMS command.
Format
SET RMS = (option[,...])
Parameter
- option
Data structure or other information to be displayed by the SHOW PROCESS/RMS command. The table below lists those keywords that can be used as options.
Table 4.2. SET RMS Command Keywords for Displaying Process RMS Information Keyword Meaning [NO]ALL[: ifi] 1 All control blocks (default) [NO]ASB Asynchronous save block [NO]BDB Buffer descriptor block [NO]BDBSUM BDB summary page [NO]BLB Buffer lock block [NO]BLBSUM Buffer lock summary page [NO]CCB Channel control block [NO]DRC Directory cache [NO]FAB File access block [NO]FCB File control block NO]FSB File statistics block [NO]FWA File work area [NO]GBD Global buffer descriptor [NO]GBDSUM GBD summary page [NO]GBH Global buffer header [NO]GBHSH Global buffer hash table [NO]GBSB Global buffer synchronization block [NO]IDX Index descriptor [NO]IFAB[: ifi] 1 Internal FAB. The optional parameter ifi is an internal file identifier. The default ifi (ALL) is all the files the current process has opened. [NO]IFB[: ifi] 1 Internal FAB [NO]IRAB Internal RAB [NO]IRB Internal RAB [NO]JFB Journaling file block [NO]KLTB Key-less-than block [NO]NAM Name block [NO]NWA Network work area [NO]PIO Image I/O (NOPIO), the default, or process I/O (PIO) [NO]RAB Record access block [NO]RLB Record lock block [NO]RU Recovery unit structures, including the recovery unit block (RUB), recovery unit stream block (RUSB), and recovery unit file block (RUFB) [NO]SFSB Shared file synchronization block [NO]WCB Window control block [NO]XAB Extended attribute block [NO]* Current list of options displayed by the SHOW RMS command The default option is (ALL,NOPIO), which designates that the SHOW PROCESS/RMS command display all structures for all files related to the process image I/O.
If only a single option is specified, you can omit the parentheses. You can add a given data structure to those displayed by ensuring that the list of keywords begins with the asterisk (*) symbol. You can delete a given data structure from the current display by preceding its keyword with NO.
Qualifier
None.
Description
The SET RMS command determines the data structures to be displayed by the SHOW PROCESS/RMS command. (See the examples included in the discussion of the SHOW PROCESS command for information provided by various displays.) You can examine the options that are currently selected by issuing a SHOW RMS command.
Examples
SDA>  SHOW RMS
RMS Display Options:  IFB,IRB,IDX,BDB,BDBSUM,ASB,CCB,WCB,FCB,FAB,RAB,NAM,XAB,RLB,
BLB,BLBSUM,GBD,GBH,FWA,GBDSUM,JFB,NWA,RU,DRC,SFSB,GBSB

Display RMS structures for all IFI values.

SDA>  SET RMS=IFB
SDA>  SHOW RMS

RMS Display Options:  IFB

Display RMS structures for all IFI values.
The first SHOW RMS command shows the default selection of data structures that are displayed in response to a SHOW PROCESS/RMS command. The SET RMS command selects only the IFB to be displayed by subsequent SET/PROCESS commands.
SDA>  SET RMS=(*,BLB,BLBSUM,RLB)
SDA>  SHOW RMS

RMS Display Options:  IFB,RLB,BLB,BLBSUM

Display RMS structures for all IFI values.
The SET RMS command adds the BLB, BLBSUM, and RLB to the list of data structures currently displayed by the SHOW PROCESS/RMS command.
SDA>  SET RMS=(*,NORLB,IFB:05)
SDA>  SHOW RMS

RMS Display Options:  IFB,BLB,BLBSUM
Display RMS structures only for IFI=5.
The SET RMS command removes the RLB from those data structures displayed by the SHOW PROCESS/RMS command and causes only information about the file with the ifi of 5 to be displayed.
SDA> SET RMS=(*,PIO)
The SET RMS command indicates that the data structures designated for display by SHOW PROCESS/RMS be associated with process-permanent I/O instead of image I/O.
4.25. SET SIGN_EXTEND
Enables or disables the sign extension of 32-bit addresses.
Format
SET SIGN_EXTEND {ON | OFF}
Parameters
- ON
Enables automatic sign extension of 32-bit addresses with bit 31 set. This is the default.
- OFF
Disables automatic sign extension of 32-bit addresses with bit 31 set.
Qualifiers
None.
Description
The 32-bit S0/S1 addresses need to be sign-extended to access 64-bit S0/S1 space. To do this, specify explicitly sign-extended addresses, or set the sign-extend command to ON, which is the default.
However, to access addresses in P2 space, addresses must not be sign-extended. To do this, specify a zero in front of the address, or set the sign-extend command to OFF.
Examples
SDA> SET SIGN_EXTEND ON
SDA>  examine 80400000
FFFFFFFF.80400000: 23DEFF90.4A607621
This shows the SET SIGN_EXTEND command as ON.
SDA> SET SIGN_EXTEND OFF
SDA>  EXAMINE 80400000
%SDA-E-NOTINPHYS, 00000000.80400000: virtual data not in physical memory
This shows the SET SIGN_EXTEND command as OFF.
4.26. SET SYMBOLIZE
Enables or disables symbolization of addresses in the display from an EXAMINE command.
Format
SET SYMBOLIZE {ON | OFF}
Parameters
- ON
Enables symbolization of addresses.
- OFF
Disables symbolization of addresses.
Qualifier
None.
Examples
SDA> SET SYMBOLIZE ON
        SDA> examine g1234
        SYS$PUBLIC_VECTORS+01234:  47DF041C   "..ßG"
SDA> SET SYMBOLIZE OFF SDA> examine g1234 FFFFFFFF.80001234: 47DF041C "..ßG"
These examples show the effect of enabling (default) or disabling symbolization of addresses.
4.27. SHOW ACPI (IA-64 Only)
Displays the contents of Advanced Configuration and Power Interface (ACPI) tables and namespace structures.
Format
SHOW ACPI {/NAMESPACE |/TABLE} [/ADDRESS = address | /ALL | /CHILDREN] [ident]
Parameter
- ident
The name of the table or the namespace structure to be displayed. If an ident is given, /ADDRESS cannot be specified.
Qualifiers
- /ADDRESS = address
The physical address of the table entry or virtual address of a namespace structure to be displayed. If /ADDRESS is used, no ident may be specified.
- /ALL
Specifies that detailed information on each entity is to be displayed. By default, only a brief summary of each entity is given, except when a specific table is displayed.
- /CHILDREN
Specifies that all the child namespace structures for a specified namespace entry are to be displayed. /CHILDREN cannot be used with /TABLES.
- /NAMESPACE
Specifies that ACPI namespace structures are to be displayed. Either /NAMESPACE or /TABLES must be specified.
- /TABLES
Specifies that ACPI tables are to be displayed. Either /NAMESPACE or /TABLES must be specified.
Description
The SHOW ACPI command displays the Advanced Configuration and Power Interface (ACPI) Tables and Namespace structures, either as a one line summary for each entity or in detail. The amount of detail varies for each structure. The structures most interesting to OpenVMS are formatted; others are output as a hexadecimal dump.
Examples
SDA> SHOW ACPI /TABLES
ACPI Tables
-----------
                                                        OEM       ASL
Signature   Physical Address     Length    OEM Id   Table Id   Vendor Id   Rev
---------   -----------------   --------   ------   --------   ---------   ---
RSDP        00000000.3FB2E000   00000028   HP       -          -           02
XSDT        00000000.3FB2E02C   0000007C   HP       zx2000     HP          01
FACP        00000000.3FB373E0   000000F4   HP       zx2000     HP          03
SPCR        00000000.3FB37518   00000050   HP       zx2000     HP          01
DBGP        00000000.3FB37568   00000034   HP       zx2000     HP          01
APIC        00000000.3FB37628   00000084   HP       zx2000     HP          01
SPMI        00000000.3FB375A0   00000050   HP       zx2000     HP          04
CPEP        00000000.3FB375F0   00000034   HP       zx2000     HP          01
SSDT        00000000.3FB33870   00000A14   HP       zx2000     INTL        01
SSDT        00000000.3FB34290   000022E2   HP       zx2000     INTL        01
SSDT        00000000.3FB36580   00000342   HP       zx2000     INTL        01
SSDT        00000000.3FB368D0   00000A16   HP       zx2000     INTL        01
SSDT        00000000.3FB372F0   000000EB   HP       zx2000     INTL        01
FACS        00000000.3FB374D8   00000040   -        -          -           01
DSDT        00000000.3FB2E0E0   00005781   HP       zx2000     INTL        01
HCDP        00000000.3FB2C000   00000088   HP       zx1        HP          00
This example shows the default display for the ACPI tables.
SDA> SHOW ACPI /TABLES RSDP

ACPI Tables
-----------
RSDP

      Physical Address:      00000000.3FB2E000   Length:                  00000028
    OEM Identification:                 "HP"   XSDT PA:        00000000.3FB2E02C
   Revision:                             02
This example shows the contents of the Root System Description Pointer (RSDP) table.
SDA> SHOW ACPI /NAMESPACE
ACPI Namespace
--------------
      Node              ACPI      Owner   Object           Operand
     Address            Name       Id      Type            Object          Flags
----------------- ---------------- -- --------------- ----------------- -----------
FFFFFFFF.88253028 \___             00 Device          FFFFFFFF.89523158 End_Of_Peer_List Subtree_Has_Ini
FFFFFFFF.89521BD8   _GPE           00 Local_Scope     00000000.00000000
FFFFFFFF.89523F58     _L14         01 Method          FFFFFFFF.89523F98 End_Of_Peer_List
FFFFFFFF.89521C18   _PR_           00 Local_Scope     00000000.00000000
FFFFFFFF.89521C58   _SB_           00 Device          00000000.00000000 Subtree_Has_Ini
FFFFFFFF.89529098     SBA0         01 Device          00000000.00000000 Subtree_Has_Ini
FFFFFFFF.895290D8       _HID       01 Method          FFFFFFFF.89529118
FFFFFFFF.89529198       _CID       01 Integer         FFFFFFFF.8952AD18
This example shows the default display for the ACPI namespace structures.
SDA> SHOW ACPI/NAMESPACE/CHILDREN _GPE
ACPI Namespace
--------------
      Node              ACPI      Owner   Object           Operand
     Address            Name       Id      Type            Object          Flags
----------------- ---------------- -- --------------- ----------------- -----------
FFFFFFFF.89521BD8 \_GPE            00 Local_Scope     00000000.00000000
FFFFFFFF.89523F58 \_GPE._L14       01 Method          FFFFFFFF.89523F98 End_Of_Peer_List
This example shows the summary display for the _GPE (General Purpose Event) package in the ACPI namespace, plus its child node.
4.28. SHOW ADDRESS
Displays the page table related information about a memory address.
Format
SHOW ADDRESS address [/PHYSICAL]
Parameter
- address
The requested address.
Qualifier
- /PHYSICAL
Indicates that a physical address has been given. The SHOW ADDRESS command displays the virtual address that maps to the given physical address.
Description
The SHOW ADDRESS command displays the region of memory that contains the memory address. It also shows all the page table entries (PTEs) that map the page and can show the range of addresses mapped by the given address if it is the address of a PTE. If the virtual address is in physical memory, the corresponding physical address is displayed.
When the /PHYSICAL qualifier is given, the SHOW ADDRESS command displays the virtual address that maps to the given physical address. This provides you with a way to use SDA commands that do not have a /PHYSICAL qualifier when only the physical address of a memory location is known.
Examples
SDA> SHOW ADDRESS 80000000
FFFFFFFF.80000000 is an S0/S1 address
Mapped by Level-3 PTE at: FFFFFFFD.FFE00000
Mapped by Level-2 PTE at: FFFFFFFD.FF7FF800
Mapped by Level-1 PTE at: FFFFFFFD.FF7FDFF8
Mapped by Selfmap PTE at: FFFFFFFD.FF7FDFF0
Also mapped in SPT window at: FFFFFFFF.FFDF0000
Mapped to physical address 00000000.00400000
The SHOW ADDRESS command in this example shows where the address 80000000 is mapped at different page table entry levels.
SDA> SHOW ADDRESS 0
00000000.00000000 is a P0 address
Mapped by Level-3 PTE at: FFFFFFFC.00000000
Mapped by Level-2 PTE at: FFFFFFFD.FF000000
Mapped by Level-1 PTE at: FFFFFFFD.FF7FC000
Mapped by Selfmap PTE at: FFFFFFFD.FF7FDFF0
Not mapped to a physical address
The SHOW ADDRESS command in this example shows where the address 0 is mapped at different page table entry levels.
SDA> SHOW ADDRESS FFFFFFFD.FF000000
FFFFFFFD.FF000000 is the address of a process-private Level-2 PTE
Mapped by Level-1 PTE at: FFFFFFFD.FF7FC000
Mapped by Selfmap PTE at: FFFFFFFD.FF7FDFF0
Range mapped at level 2: FFFFFFFC.00000000 to FFFFFFFC.00001FFF (1 page)
Range mapped at level 3: 00000000.00000000 to 00000000.007FFFFF (1024 pages)
Mapped to physical address 00000000.01230000
The SHOW ADDRESS command in this example shows where the address FFFFFFFD.FF7FC000 is mapped at page table entry and the range mapped by the PTE at this address.
SDA> SHOW ADDRESS/PHYSICAL 0
Physical address 00000000.00000000 is mapped to system-space address FFFFFFFF.828FC000
The SHOW ADDRESS command in this example shows physical address 00000000.00000000 mapped to system-space address FFFFFFFF.828FC000.
SDA> SHOW ADDRESS/PHYSICAL 029A6000
Physical address 00000000.029A6000 is mapped to process-space address 00000000.00030000
(process index 0024)
The SHOW ADDRESS command in this example shows physical address 00000000.029A6000 mapped to process-space address 00000000.00030000 (process index 0024).
4.29. SHOW BUGCHECK
Displays the value, name, and text associated with one or all bugcheck codes.
Format
SHOW BUGCHECK {/ALL (d) | name | number}
Parameters
- name
The name of the requested bugcheck code.
- number
The value of the requested bugcheck code. The severity bits in the value are ignored.
The parameters name and number and the qualifier /ALL are all mutually exclusive.
Qualifier
- /ALL
Displays complete list of all the bugcheck codes, giving their value, name, and text. It is the default.
Description
The SHOW BUGCHECK command displays the value, name, and text associated with bugcheck codes.
Examples
SDA> SHOW BUGCHECK 104
0100  DIRENTRY       ACP failed to find same directory entry
The SHOW BUGCHECK command in this example shows the requested bugcheck by number, ignoring the severity (FATAL).
SDA> SHOW BUGCHECK DECNET
08D0  DECNET         DECnet detected a fatal error
The SHOW BUGCHECK command in this example shows the requested bugcheck by name.
SDA> SHOW BUGCHECK
BUGCHECK codes and texts
------------------------
0008  ACPMBFAIL      ACP failure to read mailbox
0010  ACPVAFAIL      ACP failure to return virtual address space
0018  ALCPHD         Allocate process header error
0020  ALCSMBCLR      ACP tried to allocate space already allocated
   .
   .
   .
The SHOW BUGCHECK command in this example shows the requested bugcheck by displaying all codes.
4.30. SHOW CALL_FRAME
Displays the locations and contents of the quadwords representing a procedure call frame.
Format
SHOW CALL_FRAME { [starting-address]
| /EXCEPTION_FRAME = intstk-address
| /NEXT_FRAME | /SUMMARY | /ALL}
Parameter
- starting-address
For Alpha, an expression representing the starting address of the procedure call frame to be displayed. If no starting-address is given, the default starting address is the contents of the frame pointer (FP) register of the SDA current process. For a process that uses pthreads, the following SDA command can be used to display the starting addresses for all pthreads:
SDA> pthread thread -o u
For IA-64, the starting address is an expression representing one of the following:
The invocation context handle of a frame.
The address of an exception frame. This is equivalent to the following SDA command:
SDA> SHOW CALL_FRAME /EXCEPTION_FRAME=intstk-address
The address of a Thread Environment Block (TEB).
For a list of all TEBs for the process, use the following SDA command:
SDA> pthread thread -o u
If no starting address is given, the default starting address is the invocation context handle of the current procedure in the SDA current process.
Qualifier
- /ALL
Displays details of all call frames beginning at the current frame and continuing until bottom of stack (equivalent to SHOW CALL and repeated execution of a SHOW CALL/NEXT command).
- /EXCEPTION_FRAME=intstk-address
(IA-64 only) Provides an alternate starting address for SHOW CALL_FRAME. intstk-address is the address of an exception frame from which SDA creates an initial invocation context and displays the procedure call frame.
- /NEXT_FRAME
Displays the procedure call frame starting at the address stored in the frame longword of the last call frame displayed by this command. You must have issued a SHOW CALL_FRAME command previously in the current SDA session in order to use the /NEXT_FRAME qualifier to the command.
- /SUMMARY
Provides a one-line summary for each call frame, including exception frames, system-service entry frames, ASTs, KPBs, and so on, until reaching the bottom of the stack.
Description
Whenever a procedure is called, information is stored on the stack of the calling routine in the form of a procedure call frame. The SHOW CALL_FRAME command displays the locations and contents of the call frame. The starting address of the call frame is determined from the specified starting address, the /NEXT_FRAME qualifier, or the address contained in the SDA current process frame register (the default action).
When using the SHOW CALL_FRAME/NEXT_FRAME command to follow a chain of call frames, SDA signals the end of the chain by the following message:
Cannot display further call frames (bottom of stack)
This message indicates that the saved frame in the previous call frame has a zero value (for Alpha) or that the current frame is marked Bottom of Stack (for IA-64).
Examples
SDA> SHOW CALL_FRAME
Call Frame Information
----------------------
        Stack Frame Procedure Descriptor
Flags:  Base Register = FP, No Jacket, Native
        Procedure Entry: FFFFFFFF.837E9F10              EXCEPTION_PRO+01F10
        Return address on stack = FFFFFFFF.837E8A1C     EXE$CONTSIGNAL_C+0019C
Registers saved on stack
------------------------
7FF95F98  FFFFFFFF.FFFFFFFB  Saved R2
7FF95FA0  FFFFFFFF.8042AEA0  Saved R3     EXCEPTION_NPRW+040A0
7FF95FA8  00000000.00000002  Saved R5
7FF95FB0  FFFFFFFF.804344A0  Saved R13    SCH$CLREF+00188
7FF95FB8  00000000.7FF9FC00  Saved R29
.
.
.
SDA> SHOW CALL_FRAME/NEXT_FRAME
Call Frame Information
----------------------
        Stack Frame Procedure Descriptor
Flags:  Base Register = FP, No Jacket, Native
        Procedure Entry: FFFFFFFF.800FA388              RMS_NPRO+04388
        Return address on stack = FFFFFFFF.80040BFC     EXCEPTION_NPRO+00BFC
Registers saved on stack
------------------------
7FF99F60  FFFFFFFF.FFFFFFFD  Saved R2
7FF99F68  FFFFFFFF.80425BA0  Saved R3     EXCEPTION_NPRW+03DA0
7FF99F70  FFFFFFFF.80422020  Saved R4     EXCEPTION_NPRW+00220
7FF99F78  00000000.00000000  Saved R5
7FF99F80  FFFFFFFF.835C24A8  Saved R6     RMS_PRO+004A8
7FF99F88  00000000.7FF99FC0  Saved R7
7FF99F90  00000000.7FF9FDE8  Saved R8
7FF99F98  00000000.7FF9FDF0  Saved R9
7FF99FA0  00000000.7FF9FE78  Saved R10
7FF99FA8  00000000.7FF9FEBC  Saved R11
7FF99FB0  FFFFFFFF.837626E0  Saved R13    EXE$OPEN_MESSAGE+00088
7FF99FB8  00000000.7FF9FD70  Saved R29
.
.
.
SDA> SHOW CALL_FRAME/NEXT_FRAME
Call Frame Information
----------------------
        Stack Frame Procedure Descriptor
Flags:  Base Register = FP, No Jacket, Native
        Procedure Entry: FFFFFFFF.835C2438              RMS_PRO+00438
        Return address on stack = FFFFFFFF.83766020     EXE$OPEN_MESSAGE_C+00740
Registers saved on stack
------------------------
7FF9FD88  00000000.7FF9FDA4  Saved R2
7FF9FD90  00000000.7FF9FF00  Saved R3
7FF9FD98  00000000.7FFA0050  Saved R29
The SHOW CALL_FRAME commands in this SDA session follow a chain of call frames from that specified in the frame of the SDA current process.
SDA> SHOW CALL/SUMMARY
Call Frame Summary
------------------

     Frame Type           Handle           Current PC
-------------------- -----------------  -----------------
Exception Dispatcher 00000000.7FF43EB0  FFFFFFFF.8049E160  EXCEPTION_MON+5E360
Register Stack Frame 00000000.7FF12180  00000000.000122C0  KP_SAMPLE+122C0
Memory Stack Frame   00000000.7FF43ED0  FFFFFFFF.8066B440  EXE$CMKRNL_C+00330
Memory Stack Frame   00000000.7FF43F20  FFFFFFFF.80194890  EXE$SS_DISP_C+00400
SS Dispatcher        00000000.3FFFDFC0  FFFFFFFF.8018D240  SWIS$ENTER_KERNEL_SERVICE_C+003E0
Register Stack Frame 000007FD.BFF58000  00000000.000124C0  KP_SAMPLE+124C0
KP Start Frame       00000000.7AC95A20  FFFFFFFF.80161670  EXE$KP_START_C+003C0
Memory Stack Frame   00000000.7AC95B50  00000000.00012CE0  KP_SAMPLE+12CE0
Memory Stack Frame   00000000.7AC95BC0  00000000.000126F0  KP_SAMPLE+126F0
Base Frame           00000000.7AC95BE0  00000000.7ADE0BB0  DCL+82BB0
Bottom of stack
This example of SHOW CALL/SUMMARY on an IA-64 system shows the call frame summary of a process that has triggered an exception. The exception occurred while running a program called KP_SAMPLE which has invoked the $CMKRNL system service.
4.31. SHOW CBB
Displays contents of a Common Bitmask Block.
Format
SHOW CBB address
Parameter
- address
The address of the Common Bitmask Block. This is required.
Qualifiers
None.
Description
The contents of the specified common bitmask block are displayed: the number of valid bits, the interlock state, the unit size and count, and the current settings for the bits in the bitmask.
Example
SDA>  SHOW CBB SMP$GS_CBB_ACTIVE_SET
Common Bitmask Block at FFFFFFFF.8180CA00
-----------------------------------------

  Valid bits:                     00000040   State:          00000000.00000000
  Unit count:                         0001   Unit size:               QUADWORD

  Unit bitmask:
       ........ ........ 00000000 00000001   00000000
This example shows the active-CPU common bitmask block for a single-CPU system.
4.32. SHOW CEB
Displays information about Common Event flag Blocks, also known as Common Event flag clusters.
Format
SHOW CEB [address | /ALL]
Parameter
- address
The address of a common event flag block. Detailed information is displayed for the specified common event flag block.
Qualifier
- /ALL
Specifies that detailed information is to be displayed for each common event flag block. By default, a one-line summary is output for each common event flag block.
Description
The contents of one or all common event flag blocks is displayed. In one-line summary format, the address, name, creator process, reference count, current settings for the 32 event flags in the cluster, and the UIC of the cluster are displayed. In detailed format, the address of the cluster's Object Rights Block (ORB) and the count of waiting threads are also displayed, with lists of all associated processes and waiting threads.
You cannot specify both an address and /ALL; they are mutually exclusive.
SHOW COMMON_EVENT_BLOCK is a synonym for SHOW CEB.
Examples
SDA> SHOW CEB
Common Event Flags
------------------

Address       Name              Creator       RefCount  EvtFlags       UIC        Flags
-------- -------------- --------------------- --------  --------  --------------  -----
81E1D340 clus6          0000009B Test1        00000001  00000000     [11,1]       Permanent
81E294C0 clus5          0000009B Test2        00000001  00000000     [11,1]       Permanent
8213A280 IPCACP_FLAGS   00000086 IPCACP       00000001  00000000      [1,*]
This example shows the one-line summary of all common event flag blocks.
SDA> SHOW CEB 81E294C0
Common Event Flags
------------------

CEB Address:                      81E294C0   Name:                       clus5
Creator process EPID:             0000009B   Name:                       Test2
Event flag vector:                00000000   Reference count:         00000001
ORB address:                      829F75B0   Wait count:              00000001
UIC:                                [11,1]   Flags:                   00000002  Permanent

              Associated Processes               Waiting Threads
       -----------------------------------   ------------------------
         PCB       EPID         Name           KTB     Indx  WaitMask
       --------  --------  ---------------   --------  ----  --------
       81E1C740  000000A4  BISHOP_47         81E1C740  0000  FFFFFF84
This example shows the details for the CEB at the given address.
4.33. SHOW CLASS
Displays information about scheduling classes that are active in the system or dump being analyzed.
Format
SHOW CLASS [class-name | /ALL]
Parameter
- class-name
Name of the class to be displayed.
Qualifier
- /ALL
Indicates that details of all active classes are to be displayed.
Description
SDA displays information about active scheduling classes in the system. By default, a summary of the classes is displayed.
Examples
SDA> SHOW CLASS
Scheduling Classes
------------------

                  Original  Current     Time    Process
   Class Name     Quantum   Quantum   Restrict   Count
----------------  --------  --------  --------  --------
BISH              000000C6  000000C6  00FE0000  00000001
This example shows the summary display of the SHOW CLASS command.
SDA> SHOW CLASS bish
Class name:                       "BISH"
Original quantum:                 000000C6 (99%)
Current quantum:                  000000C6 (99%)
Time restrictions:                00FE0000 (until 23:59)

Processes currently in class:

            PCB         EPID           Name
          --------    --------    ---------------
          83617D40    00000225    Milord_RTA1:
This example shows the detailed display of the SHOW CLASS command.
4.34. SHOW CLUSTER
Displays connection manager and system communications services (SCS) information for all nodes in a cluster.
Format
SHOW CLUSTER { [{/ADDRESS=n |
                            /CIRCUIT=pb-addr | /CSID=csid
                        | /NODE=name}] | /SCS }
Parameters
None
Qualifier
- /ADDRESS=n
Displays only the OpenVMS Cluster system information for a specific OpenVMS Cluster member node, given the address of the cluster system block (CSB) for the node. This is mutually exclusive with the /CIRCUIT=pb-addr, /CSID=csid, and /NODE=name qualifiers.
- /CIRCUIT=pb-addr
Displays only the OpenVMS Cluster system information for a specific path, where pb-addr is the address of its path block. This qualifier is mutually exclusive with the /ADDRESS=n, /CSID=csid, and /NODE=name qualifiers.
- /CSID=csid
Displays only the OpenVMS Cluster system information for a specific OpenVMS Cluster member node. The value csid is the cluster system identification number (CSID) of the node to be displayed. You can find the CSID for a specific node in a cluster by examining the CSB list display of the SHOW CLUSTER command. Other SDA displays refer to a system's CSID. For instance, the SHOW LOCKS command indicates where a lock is mastered or held by CSID. This is mutually exclusive with the /ADDRESS=n, /CIRCUIT=pb-addr, and /NODE=name qualifiers.
- /NODE=name
Displays only the OpenVMS Cluster system information for a specific OpenVMS Cluster member node, given its SCS node name. This is mutually exclusive with the /ADDRESS=n, /CIRCUIT=pb-addr, and /CSID=csid qualifiers.
- /SCS
Displays a view of the cluster as seen by SCS.
Description
The SHOW CLUSTER command provides a view of the OpenVMS Cluster system from either the perspective of the connection manager (the default behavior), or from the perspective of the port driver or drivers (if the /SCS qualifier is used).
OpenVMS Cluster as Seen by the Connection Manager
The SHOW CLUSTER command provides a series of displays.
The OpenVMS Cluster summary display supplies the following information:
Number of votes required for a quorum
Number of votes currently available
Number of votes allocated to the quorum disk
Status summary indicating whether or not a quorum is present
The CSB list displays information about the OpenVMS Cluster system blocks (CSBs) currently in operation; one CSB is assigned to each node of the cluster. For each CSB, the CSB list displays the following information:
Address of the CSB
Name of the OpenVMS Cluster node it describes
CSID associated with the node
Number of votes (if any) provided by the node
State of the CSB
Status of the CSB
For information about the state and status of nodes, see the description of the ADD CLUSTER command of the SHOW CLUSTER utility in the VSI OpenVMS System Management Utilities Reference Manual.
The cluster block display includes information recorded in the cluster block (CLUB), including a list of activated flags, a summary of quorum and vote information, and other data that applies to the cluster from the perspective of the node for which the SDA is being run.
The cluster failover control block display provides detailed information concerning the cluster failover control block (CLUFCB). The cluster quorum disk control block display provides detailed information from the cluster quorum disk control block (CLUDCB).
Subsequent displays provide information for each CSB listed previously in the CSB list display. Each display shows the state and flags of a CSB, as well as other specific node information. (See the ADD MEMBER command of the SHOW CLUSTER utility in the VSI OpenVMS System Management Utilities Reference Manual for information about the flags for OpenVMS Cluster nodes.)
If any of the qualifiers /ADDRESS=n, /CSID=csid, or /NODE=name are specified, then the SHOW CLUSTER command displays only the information from the CSB of the specified node.
OpenVMS Cluster as Seen by the Port Driver
The SHOW CLUSTER/SCS command provides a series of displays.
The SCS listening process directory lists those processes that are listening for incoming SCS connect requests. For each of these processes, this display records the following information:
Address of its directory entry
Connection ID
Name
Explanatory information, if available
The SCS systems summary display provides the system block (SB) address, node name, system type, system ID, and the number of connection paths for each SCS system. An SCS system can be a OpenVMS Cluster member, storage controller, or other such device.
Subsequent displays provide detailed information for each of the system blocks and the associated path blocks. The system block displays include the maximum message and datagram sizes, local hardware and software data, and SCS poller information. Path block displays include information that describes the connection, including remote functions and other path-related data.
If the qualifier /CIRCUIT=pb-addr is specified, the SHOW CLUSTER command displays only the information from the specified path block.
Examples
SDA> SHOW CLUSTER
OpenVMS Cluster data structures
               --- OpenVMS Cluster Summary ---
     Quorum   Votes   Quorum Disk Votes   Status Summary
     ------   -----   -----------------   --------------
        2       2            1            qf_dynvote,qf_vote,quorum
                    --- CSB list ---
Address   Node    CSID      Votes   State     Status
-------   ----    ----      -----   -----     ------
805FA780  FLAM5   00010006    0     local   member,qf_same,qf_noaccess
8062C400  ROMRDR  000100ED    1     open    member,qf_same,qf_watcher,qf_active
8062C780  VANDQ1  000100EF    0     open    member,qf_same,qf_noaccess
             --- Cluster Block (CLUB) 805FA380 ---
Flags: 16080005 cluster,qf_dynvote,init,qf_vote,qf_newvote,quorum
Quorum/Votes                  2/2    Last transaction code          02
Quorum Disk Votes               1    Last trans. number            596
Nodes                           3    Last coordinator CSID    000100EF
Quorum Disk               $1$DIA0    Last time stamp       31-DEC-1992
Found Node SYSID     00000000FC03                             17:26:35
Founding Time          3-JAN-1993    Largest trans. id        00000254
                         21:04:21    Resource Alloc. retry           0
Index of next CSID           0007    Figure of Merit          00000000
Quorum Disk Cntrl Block  805FADC0    Member State Seq. Num        0203
Timer Entry Address      00000000    Foreign Cluster          00000000
CSP Queue                   empty
     --- Cluster Failover Control Block (CLUFCB) 805FA4C0 ---
Flags: 00000000
Failover Step Index      00000037    CSB of Synchr. System    8062C780
Failover Instance ID     00000254
     --- Cluster Quorum Disk Control Block (CLUDCB) 805FADC0 ---
State     : 0002 qs_rem_act
Flags     : 0100 qf_noaccess
CSP Flags : 0000
Iteration Counter               0             UCB address     00000000
Activity Counter                0             TQE address     805FAE00
Quorum file LBN          00000000             IRP address     00000000
                                              Watcher CSID    000100ED
     --- FLAM5 Cluster System Block (CSB) 805FA780 ---
State:  0B local
Flags:  070260AA member,qf_same,qf_noaccess,selected,local,status_rcvd,send_status
Cpblty: 00000000
SWVers: 7.0
HWName: DEC 3000 Model 400
Quorum/Votes       1/0    Next seq. number    0000    Send queue      00000000
Quor. Disk Vote      1    Last seq num rcvd   0000    Resend queue    00000000
CSID          00010006    Last ack. seq num   0000    Block xfer Q.   805FA7D8
Eco/Version       0/23    Unacked messages       0    CDT address     00000000
Reconn. time  00000000    Ack limit              0    PDT address     00000000
Ref. count           2    Incarnation   1-JAN-1993    TQE address     00000000
Ref. time  31-AUG-1992                    00:00:00    SB address      80421580
              17:26:35    Lock mgr dir wgt       0    Current CDRP    00000001
     --- ROMRDR Cluster System Block (CSB) 8062C400 ---
State:  01 open
Flags:  0202039A member,qf_same,cluster,qf_active,selected,status_rcvd
Cpblty: 00000000
SWVers: 7.0
HWName: DEC 3000 Model 400

Quorum/Votes       2/1    Next seq. number    B350    Send queue      00000000
Quor. Disk Vote      1    Last seq num rcvd   E786    Resend queue    00000000
CSID          000100ED    Last ack. seq num   B350    Block xfer Q.   8062C458
Eco/Version       0/22    Unacked messages       1    CDT address     805E8870
Reconn. time  00000000    Ack limit              3    PDT address     80618400
Ref. count           2    Incarnation  19-AUG-1992    TQE address     00000000
Ref. time  19-AUG-1992                    16:15:00    SB address      8062C140
              16:17:08    Lock mgr dir wgt       0    Current CDRP    00000000
     --- VANDQ1 Cluster System Block (CSB) 8062C780 ---
State:  01 open
Flags:  020261AA member,qf_same,qf_noaccess,cluster,selected,status_rcvd
Cpblty: 00000000
SWVers: 7.0
HWName: DEC 3000 Model 400
Quorum/Votes       1/0    Next seq. number    32B6    Send queue      00000000
Quor. Disk Vote      1    Last seq num rcvd   A908    Resend queue    00000000
CSID          000100EF    Last ack. seq num   32B6    Block xfer Q.   8062C7D8
Eco/Version       0/23    Unacked messages       1    CDT address     805E8710
Reconn. time  00000000    Ack limit              3    PDT address     80618400
Ref. count           2    Incarnation  17-AUG-1992    TQE address     00000000
Ref. time  19-AUG-1992                    15:37:06    SB address      8062BCC0
              16:21:22    Lock mgr dir wgt       0    Current CDRP    00000000
         --- SWPCTX Cluster System Block (CSB) 80D3B1C0 ---
State:  0B local
Flags:  030A60AA member,qf_same,qf_noaccess,selected,send_ext_status,local,status_rcvd
Cpblty: 00000037 rm8sec,vcc,dts,cwcreprc,threads
SWVers: V7.0
HWName: DEC 3000 Model 400
Quorum/Votes       1/1    Next seq. number    0000    Send queue      00000000
Quor. Disk Vote      1    Last seq num rcvd   0000    Resend queue    00000000
CSID          00010001    Last ack. seq num   0000    Block xfer Q.   80D3B218
Eco/Version       0/26    Unacked messages       0    CDT address     00000000
Reconn. time  00000000    Ack limit              0    PDT address     00000000
Ref. count           2    Incarnation  12-JUL-1996    TQE address     00000000
Ref. time  16-JUL-1996                    15:36:17    SB address      80C50800
              16:15:48    Lock mgr dir wgt       0    Current CDRP    00000001
This example illustrates the default output of the SHOW CLUSTER command.
SDA> SHOW CLUSTER/SCS
OpenVMS Cluster data structures
--------------------------

                --- SCS Listening Process Directory ---

Entry Address     Connection ID     Process Name           Information
-------------     -------------     ------------           -----------

  80C71EC0          74D20000        SCS$DIRECTORY          Directory Server
  80C72100          74D20001        MSCP$TAPE              NOT PRESENT HERE
  80E16940          74D20002        MSCP$DISK              MSCP$DISK
  80E23B40          74D20003        VMS$SDA_AXP            Remote SDA
  80E23B40          74D20003        VMS$SDA_AXP            Remote SDA
  80E25540          74D20004        VMS$VAXcluster         ................
  80E29E80          74D20005        SCA$TRANSPORT
  813020C0          74D20053        PATHWORKScluster       .....TurboServer

                   --- SCS Systems Summary ---

  SB Address     Node      Type       System ID         Paths
  ----------     ----      ----       ---------         -----

  8493BC00      ARUSHA     VMS       000000004CA1         2
  80E23800      HSJ201     HSJ       4200101A1B20         1
  80E3FF40      ORNOT      VMS       000000004CA7         2
  80E43F40      LOADQ      VMS       000000004C31         2
  80E473C0      HSJ300     HSJ       420010051D20         1
  80E47CC0      HSJ101     HSJ       420010081720         1
  80E47D40      HSJ100     HSJ       4200100B1520         1
  80E478C0      HSJ600     HSJ       420010070920         1
  80E49180      HSJ401     HSJ       4200100D0320         1
  80E47DC0      HSJ301     HSJ       420010091F20         1
  80E47E40      HSJ601     HSJ       4200100A0B20         1
  80E49500      HSJ400     HSJ       4200100C0120         1
  80E5BF80      CHOBE      VMS       000000004CD6         2
  80E5F080      ETOSHA     VMS       000000004CF3         2
  80E5FC00      VMS        VMS       000000004C7A         2
  80E4FF80      HSJ501     HSJ       4200101C0720         1
  80E5FD80      HSJ200     HSJ       420010191920         1
  80E5FE80      HSJ500     HSJ       4200101B0520         1
  80E5FE00      IPL31      VMS       000000004F52         2
  80E59F80      ZAPNOT     VMS       000000004CBB         2
  80E61F80      ALTOS      VMS       000000004D0F         2
  80E72000      TSAVO      VMS       000000004CFE         2
  80ED5D00      SLYTHE     VMS       000000004DD1         1
  80EDDD00      AZSUN      VMS       000000004D56         1
  80EDDE00      CALSUN     VMS       000000004EA4         1
  80EDFC00      4X4TRK     VMS       00000000FF26         1
  80EE93C0      GNRS       VMS       00000000FC2B         1
  80EE94C0      IXIVIV     VMS       000000004E56         1
  80EF1A80      CLAIR      VMS       000000004CDF         1
  80EF1C00      INT4       VMS       00000000FD70         1
  80EFDF80      SCOP       VMS       00000000FC87         1
  80EFFAC0      MOCKUP     VMS       00000000FCD5         1

                    --- ARUSHA System Block (SB) 8493BC00 ---

System ID            000000004CA1    Local software type          VMS
Max message size              216    Local software vers.         V7.2
Max datagram size             576    Local software incarn.   DF4AC300
Local hardware type          ALPH                             009F7570
Local hardware vers. 000000000003    SCS poller timeout           5AD3
                     040400000000    SCS poller enable mask         27
Status:  00000000

                    --- Path Block (PB) 80E55F80 ---

                Status:  0020  credit

Remote sta. addr.    000000000016    Remote port type          00000010
Remote state                 ENAB    Number of data paths             2
Remote hardware rev.     00000008    Cables state            A-OK B-OK
Remote func. mask        ABFF0D00    Local state                   OPEN
Reseting port                  16    Port dev. name               PNA0
Handshake retry cnt.            2    SCS MSGBUF address        80E4C528
Msg. buf. wait queue     80E55FB8    PDT address               80E2A180

                    --- Path Block (PB) 80ED0900 ---

                Status:  0020  credit

Remote sta. addr.    0000000000DF    Remote port type                NI
Remote state                 ENAB    Number of data paths             2
Remote hardware rev.     00000104    Cables state            A-OK B-OK
Remote func. mask        83FF0180    Local state                   OPEN
Reseting port                  00    Port dev. name               PEA0
Handshake retry cnt.            3    SCS MSGBUF address        80ED19A0
Msg. buf. wait queue     80ED0938    PDT address               80EC3C70

   .
   .
   .
This example illustrates the output of the SHOW CLUSTER /SCS command.
4.35. SHOW CONNECTIONS
Displays information about all active connections between System Communications Services (SCS) processes or a single connection.
Format
SHOW CONNECTIONS [ {/ADDRESS=cdt-address | /NODE=name | /SYSAP=name }
                        ]
Parameters
None.
Qualifiers
- /ADDRESS=cdt-address
Displays information contained in the connection descriptor table (CDT) for a specific connection. You can find the cdt-address for any active connection on the system in the CDT summary page display of the SHOW CONNECTIONS command. In addition, CDT addresses are stored in many individual data structures related to SCS connections. These data structures include class driver request packets (CDRPs) and unit control blocks (UCBs) for class drivers that use SCS, and cluster system blocks (CSBs) for the connection manager.
- /NODE=name
Displays all CDTs associated with the specified remote SCS node name.
- /SYSAP=name
Displays all CDTs associated with the specified local SYSAP.
Description
The SHOW CONNECTIONS command provides a series of displays.
The CDT summary page lists information regarding each connection on the local system, including the following:
CDT address
Name of the local process with which the CDT is associated
Connection ID
Current state
Name of the remote node (if any) to which it is currently connected
The CDT summary page concludes with a count of CDTs that are free and available to the system.
SHOW CONNECTIONS next displays a page of detailed information for each active CDT listed previously.
Example
SDA> SHOW CONNECTIONS
              --- CDT Summary Page ---
CDT Address   Local Process     Connection ID     State       Remote Node
-----------   -------------     -------------     -----       -----------
 805E7ED0     SCS$DIRECTORY       FF120000        listen
 805E8030     MSCP$TAPE           FF120001        listen
 805E8190     VMS$VMScluster      FF120002        listen
 805E82F0     MSCP$DISK           FF120003        listen
 805E8450     SCA$TRANSPORT       FF120004        listen
 805E85B0     MSCP$DISK           FF150005        open         VANDQ1
 805E8710     VMS$VMScluster      FF120006        open         VANDQ1
 805E8870     VMS$VMScluster      FF120007        open         ROMRDR
 805E89D0     MSCP$DISK           FF120008        open         ROMRDR
 805E8C90     VMS$DISK_CL_DRVR    FF12000A        open         ROMRDR
 805E8DF0     VMS$DISK_CL_DRVR    FF12000B        open         VANDQ1
 805E8F50     VMS$TAPE_CL_DRVR    FF12000C        open         VANDQ1
Number of free CDT's:  188
          --- Connection Descriptor Table (CDT) 80C44850 ---
State:  0001 listen               Local Process:        MSCP$TAPE
Blocked State:  0000
Local Con. ID   899F0003    Datagrams sent         0    Message queue   80C4488C
Remote Con. ID  00000000    Datagrams rcvd         0    Send Credit Q.  80C44894
Receive Credit         0    Datagram discard       0    PB address      00000000
Send Credit            0    Message Sends          0    PDT address     00000000
Min. Rec. Credit       0    Message Recvs          0    Error Notify    822FFCC0
Pend Rec. Credit       0    Mess Sends NoFP        0    Receive Buffer  00000000
Initial Rec. Credit    0    Mess Recvs NoFP        0    Connect Data    00000000
Rem. Sta.   000000000000    Send Data Init.        0    Aux. Structure  00000000
Rej/Disconn Reason     0    Req Data Init.         0    Fast Recvmsg Rq 00000000
Queued for BDLT        0    Bytes Sent             0    Fast Recvmsg PM 00000000
Queued Send Credit     0    Bytes rcvd             0    Change Affinity 00000000
                            Total bytes map        0
      --- Connection Descriptor Table (CDT) 805E8030 ---
State:  0001 listen           Local Process:        MSCP$TAPE
Blocked State:  0000
Local Con. ID   FF120001    Datagrams sent         0    Message queue   805E8060
Remote Con. ID  00000000    Datagrams rcvd         0    Send Credit Q.  805E8068
Receive Credit         0    Datagram discard       0    PB address      00000000
Send Credit            0    Messages Sent          0    PDT address     00000000
Min. Rec. Credit       0    Messages Rcvd.         0    Error Notify    804540D0
Pend Rec. Credit       0    Send Data Init.        0    Receive Buffer  00000000
Initial Rec. Credit    0    Req Data Init.         0    Connect Data    00000000
Rem. Sta.   000000000000    Bytes Sent             0    Aux. Structure  00000000
Rej/Disconn Reason     0    Bytes rcvd             0
Queued for BDLT        0    Total bytes map        0
Queued Send Credit     0
   .
   .
   .
This example shows the default output of the SHOW CONNECTIONS command.
4.36. SHOW CPU
When analyzing a dump, displays information about the state of a CPU at the time of the system failure. SHOW CPU is only valid when you are analyzing a crash dump. It is not a valid command when you are analyzing the running system, because all the CPU-specific information may not be available. If invoked when you are analyzing a running system, SHOW CPU will only list the CPU database address(es) for the specified CPU or all CPUs.
Format
SHOW CPU [cpu-id | /FIRST | /NEXT | /PRIMARY]
Parameter
- cpu-id
Numeric value indicating the identity of the CPU for which context information is to be displayed. If you specify the cpu-id parameter, the SHOW CPU command performs an implicit SET CPU command, making the CPU indicated by cpu-id the current CPU for subsequent SDA commands.
If you do not specify a cpu-id, the state of the SDA current CPU is displayed.
If you specify the cpu-id of a CPU that was not active at the time of the system failure, SDA displays the following message:
%SDA-E-CPUNOTVLD, CPU not booted or CPU number out of range
See the description of the SET CPU command and Section 2.5, ''SDA Context'' for information on how this can affect the CPU context---and process context---in which SDA commands execute.
Qualifiers
- /FIRST
The state of the lowest numbered CPU (not necessarily the primary CPU) is displayed.
- /NEXT
The state of the next higher numbered CPU is displayed. SDA skips CPUs not in the configuration at the time of system failure. If there are no further CPUs, SDA returns an error.
- /PRIMARY
The state of the primary CPU is displayed.
Description
The SHOW CPU command displays system failure information about the CPU specified by cpu-id or, by default, the SDA current CPU, as defined in Section 2.5, ''SDA Context''.
The SHOW CPU command produces several displays. The first display is a brief description of the system failure and its environment that includes the following:
Reason for the bugcheck.
Name of the currently executing process. If no process has been scheduled on this CPU, SDA displays the following message:
Process currently executing: no processes currently scheduled on the processor
File specification of the image executing within the current process (if there is a current process).
Interrupt priority level (IPL) of the CPU at the time of the system failure.
The CPU database address.
The CPU's capability set.
On IA-64 systems, the Exception Frame Summary.
On Alpha, the register display follows. First the general registers are output, showing the contents of the CPU's integer registers (R0 to R30), and the AI, RA, PV, FP, PC, and PS at the time of the system failure.
The Alpha processor registers display consists of the following parts:
Common processor registers
Processor-specific registers
Stack pointers
The first part of the processor registers display includes registers common to all Alpha processors, which are used by the operating system to maintain the current process virtual address space, system space, or other system functions. This part of the display includes the following registers:
Hardware privileged context block base register (PCBB)
System control block base register (SCBB)
Software interrupt summary register (SISR)
Address space number register (ASN)
AST summary register (ASTSR)
AST enable register (ASTEN)
Interrupt priority level register (IPL)
Processor priority level register (PRBR)
Page table base register (PTBR)
Virtual page table base register (VPTB)
Floating-point control register (FPCR)
Machine check error summary register (MCES)
On IA-64 systems, the register display is in the form of the contents of the exception frame generated by the bugcheck. See SHOW CRASH for more details.
The last part of the display includes the four stack pointers: the pointers of the kernel, executive, supervisor, and user stacks (KSP, ESP, SSP, and USP, respectively). In addition, on IA-64, the four register stack pointers are displayed: KBSP, EBSP, SBSP, UBSP.
The SHOW CPU command concludes with a listing of the spinlocks, if any, owned by the CPU at the time of the system failure, reproducing some of the information given by the SHOW SPINLOCKS command. The spinlock display includes the following information:
Name of the spinlock.
Address of the spinlock data structure (SPL).
The owning CPU's CPU ID.
IPL of the spinlock.
Indication of the depth of this CPU's ownership of the spinlock. A number greater than 1 indicates that this CPU has nested acquisitions of the spinlock.
Rank of the spinlock.
Timeout interval for spinlock acquisition (in terms of 10 milliseconds).
Shared array (shared spinlock context block pointers)
Examples
SDA> SHOW CPU 0
CPU 00 Processor crash information
----------------------------------
CPU 00 reason for Bugcheck: CPUEXIT, Shutdown requested by another CPU

Process currently executing on this CPU:   None

Current IPL: 31  (decimal)

CPU database address:  81414000

CPUs Capabilities:    PRIMARY,QUORUM,RUN

General registers:

R0   = FFFFFFFF.81414000  R1   = FFFFFFFF.81414000  R2   = 00000000.00000000
R3   = FFFFFFFF.810AD960  R4   = 00000000.01668E90  R5   = 00000000.00000001
R6   = 66666666.66666666  R7   = 77777777.77777777  R8   = FFFFFFFF.814FB040
R9   = 99999999.99999999  R10  = FFFFFFFF.814FB0C0  R11  = BBBBBBBB.BBBBBBBB
R12  = CCCCCCCC.CCCCCCCC  R13  = FFFFFFFF.810AD960  R14  = FFFFFFFF.81414018
R15  = 00000000.00000004  R16  = 00000000.000006AC  R17  = 00000000.00000047
R18  = 00000000.00000000  R19  = 00000000.00000000  R20  = FFFFFFFF.8051A494
R21  = 00000000.00000000  R22  = 00000000.00000001  R23  = 00000000.00000010
R24  = FFFFFFFF.81414000  AI   = FFFFFFFF.81414000  RA   = FFFFFFFF.81006000
PV   = 00000001.FFFFFFFF  R28  = 00000000.00000000  FP   = FFFFFFFF.88ABDFD0
PC   = FFFFFFFF.8009C95C  PS   = 18000000.00001F04

Processor Internal Registers:

ASN  = 00000000.00000000                     ASTSR/ASTEN =          00000000
IPL  =          0000001F  PCBB = 00000000.01014080  PRBR = FFFFFFFF.81414000
PTBR = 00000000.0000FFBF  SCBB = 00000000.000001E8  SISR = 00000000.00000100
VPTB = FFFFFEFC.00000000  FPCR = 00000000.00000000  MCES = 00000000.00000000

        KSP    = FFFFFFFF.88ABDCD8
        ESP    = FFFFFFFF.88ABF000
        SSP    = FFFFFFFF.88AB9000
        USP    = FFFFFFFF.88AB9000

                Spinlocks currently owned by CPU 00

SCS                                    Address        810AF300
Owner CPU ID       00000000            IPL            00000008
Ownership Depth    00000000            Rank           0000001A
Timeout Interval   002DC6C0            Share Array    00000000
This example shows the default output of the SHOW CPU command on an Alpha system.
4.37. SHOW CRASH
Provides system information identifying a running system, or displays information about the state of the system at the time of a system failure.
Format
SHOW CRASH [/ALL | /CPU=n]
Parameters
None.
Qualifiers
- /ALL
Displays exception data for all CPUs. By default, the registers (on Alpha) or exception frame contents (on IA-64) are omitted from the display for any CPUs with CPUEXIT or DBGCPUEXIT bugchecks.
- /CPU=n
Allows exception data to be displayed from CPUs other than the one considered as the crash CPU when more than one CPU crashes simultaneously.
Description
The SHOW CRASH command has two different functions, depending on whether you use it to analyze a running system or a system failure.
When used during the analysis of a running system, the SHOW CRASH command produces a display that describes the system and the version of OpenVMS that it is running. The system crash information display contains the following information:
Name and version number of the operating system
Major and minor IDs of the operating system
Identity of the OpenVMS system, including an indication of its cluster membership
CPU ID of the primary CPU
Address of all CPU databases
When used during the analysis of a system failure, the SHOW CRASH command produces several displays that identify the system and describe its state at the time of the failure.
If the current CPU context for SDA is not that of the processor that signaled the bugcheck, or the CPU specified with the /CPU=n qualifier, the SHOW CRASH command first performs an implicit SET CPU command to make that processor the current CPU for SDA. (See the description of the SET CPU command and Section 2.5, ''SDA Context'' for a discussion of how this can affect the CPU context---and process context---in which SDA commands execute.)
The system crash information display in this context provides the following information:
Date and time of the system failure.
Name and version number of the operating system.
Major and minor IDs of the operating system.
Identity of the system.
CPU IDs of both the primary CPU and the CPU that initiated the bugcheck. In a uniprocessor system, these IDs are identical.
Bitmask of the active and available CPUs in the system.
For each active processor in the system, the address of its CPU database and the name of the bugcheck that caused the system failure. Generally, there will be only one significant bugcheck in the system. All other processors typically display the following as their reason for taking a bugcheck:
CPUEXIT, Shutdown requested by another CPU
Subsequent screens of the SHOW CRASH command display information about the state of each active processor on the system at the time of the system failure. The information in these screens is identical to that produced by the SHOW CPU command, including the registers (on Alpha), exception frame (on IA-64), stack pointers, and records of spinlock ownership. The first such screen presents information about the processor that caused the failure; others follow according to the numeric order of their CPU IDs. For the processor that caused the failure, if an exception bugcheck (INVEXCEPTN, SSRVEXCEPT, FATALEXCEPT, UNXSIGNAL) or, for IA-64 only, also a KRNLSTAKNV or DEBUGCRASH bugcheck has occurred, SHOW CRASH first displays the exception frame from the original exception. If /ALL is not specified, the registers (on Alpha) or exception frame contents (on IA-64) are omitted from the display for any CPUs with CPUEXIT or DBGCPUEXIT bugchecks.
SHOW CRASH displays the original exception in process dumps.
Examples
SDA> SHOW CRASH
Version of system: OpenVMS (TM) Alpha Operating System, Version X901-SSB

System Version Major ID/Minor ID: 3/0

VMScluster node: VMSTS6, a

Crash CPU ID/Primary CPU ID:  00/00

Bitmask of CPUs active/available:  00000001/00000001

CPU bugcheck codes:
        CPU 00 -- INVEXCEPTN, Exception while above ASTDEL

System State at Time of Exception
---------------------------------
Exception Frame:
----------------
        R2  = FFFFFFFF.810416C0  SCS$GA_LOCALSB+005C0
        R3  = FFFFFFFF.81007E60  EXE$GPL_HWRPB_L
        R4  = FFFFFFFF.850AEB80
        R5  = FFFFFFFF.81041330  SCS$GA_LOCALSB+00230
        R6  = FFFFFFFF.81038868  CON$INITLINE
        R7  = FFFFFFFF.81041330  SCS$GA_LOCALSB+00230
        PC  = FFFFFFFF.803EF81C  SYS$TTDRIVER+0F81C
        PS  = 30000000.00001F04

         FFFFFFFF.803EF80C:     STL             R24,#X0060(R5)
         FFFFFFFF.803EF810:     LDL             R28,#X0138(R5)
         FFFFFFFF.803EF814:     BIC             R28,R27,R28
         FFFFFFFF.803EF818:    00000138
   PC => FFFFFFFF.803EF81C:     HALT
         FFFFFFFF.803EF820:     HALT
         FFFFFFFF.803EF824:     BR              R31,#XFF0000
         FFFFFFFF.803EF828:     LDL             R24,#X0138(R5)
         FFFFFFFF.803EF82C:     BIC             R24,#X40,R24

   PS =>
         MBZ SPAL      MBZ    IPL VMM MBZ CURMOD INT PRVMOD de
           0   30   00000000000 1F  0   0   KERN   1   KERN

Signal Array
------------
        Length = 00000003
        Type   = 0000043C
        Arg    = FFFFFFFF.803EF81C  SYS$TTDRIVER+0F81C
        Arg    = 30000000.00001F04
%SYSTEM-F-OPCDEC, opcode reserved to Digital fault at PC=FFFFFFFF803EF81C, PS=00001F04

Saved Scratch Registers in Mechanism Array
------------------------------------------
R0   = 00000000.00000000  R1   = FFFFFFFF.811998B8  R16  = 00000000.00001000
R17  = FFFFFFFF.8119B1F0  R18  = 00000000.00000010  R19  = FFFFFFFF.810194F0
R20  = 00000000.00000000  R21  = 0000000F.00000000  R22  = 00000000.00000000
R23  = 00000000.00004000  R24  = 00000000.00001000  R25  = 00000000.00000000
R26  = FFFFFFFF.81041474  R27  = 00000000.00004000  R28  = 00000000.00001000

   .
   .
   .
                           (CPU-specific display omitted)
   .
   .
   .
This long display reflects the output of the SHOW CRASH command within the analysis of a system failure on an OpenVMS Alpha system.
SDA> SHOW CRASH
System crash information
------------------------
Time of system crash: 12-OCT-2000 11:27:58.02

Version of system: OpenVMS (TM) Alpha Operating System, Version X74B-FT2

System Version Major ID/Minor ID: 3/0

System type: DEC 3000 Model 400

Crash CPU ID/Primary CPU ID:  00/00

Bitmask of CPUs active/available:  00000001/00000001

CPU bugcheck codes:
        CPU 00 -- PGFIPLHI, Pagefault with IPL too high

System State at Time of Page Fault:
-----------------------------------

Page fault for address 00000000.00046000 occurred at IPL: 8
Memory management flags: 00000000.00000001 (instruction fetch)

Exception Frame:
----------------
        R2  = 00000000.00000003
        R3  = FFFFFFFF.810B9280  EXCEPTION_MON+39C80
        R4  = FFFFFFFF.81564540  PCB
        R5  = 00000000.00000088
        R6  = 00000000.000458B0
        R7  = 00000000.7FFA1FC0
        PC  = 00000000.00046000
        PS  = 20000000.00000803

         00000000.00045FF0:     LDQ             R2,#X0050(FP)
         00000000.00045FF4:     LDQ             R12,#X0058(FP)
         00000000.00045FF8:     LDQ             R13,#X0060(FP)
         00000000.00045FFC:     LDQ             R14,#X0068(FP)
   PC => 00000000.00046000:     BIS             R1,R17,R1
         00000000.00046004:     BIS             R31,#X01,R25
         00000000.00046008:     STQ_U           R1,#X0002(R10)
         00000000.0004600C:     BSR             R26,#X00738C
         00000000.00046010:     LDQ_U           R16,#X0002(R10)

   PS =>
         MBZ SPAL      MBZ    IPL VMM MBZ CURMOD INT PRVMOD de
          0   20   00000000000 08  0   0   KERN   0   USER

   .
   .
   .
                                        (CPU-specific display omitted)
   .
   .
   .
This display reflects the output of a SHOW CRASH command within the analysis of a PGFIPLHI bugcheck on an OpenVMS Alpha system.
SDA> SHOW CRASH /ALL
System crash information
------------------------

Time of system crash:  1-DEC-2003 13:31:10.50


Version of system: OpenVMS I64 Operating System, Version XA2T-J2S

System Version Major ID/Minor ID: 3/0


System type: HP rx2600  (900MHz/1.5MB)

Crash CPU ID/Primary CPU ID:  01/00

Bitmask of CPUs active/available:  00000003/00000003


CPU bugcheck codes:
        CPU 01 -- database address 8396DD80 -- SSRVEXCEPT, Unexpected system se

        1 other -- CPUEXIT, Shutdown requested by another CPU
                CPU 00 -- database address 83864000


System State at Time of Original Exception
------------------------------------------

Exception Frame at 00000000.7FF43BD0
------------------------------------

 IPL             =                 00
 TRAP_TYPE       =           00000008 Access control violation fault
 IVT_OFFSET      =           00000800 Data TLB Fault
 IIP             =  00000000.00020120 SYS$K_VERSION_08+00100
 IIPA            =  00000000.00020110 SYS$K_VERSION_08+000F0
 IFA             =  00000000.00000000

 IPSR            =  00001010.0A0A6010

                    RT  TB  LP  DB  SI  DI  PP  SP  DFH DFL DT  PK  I   IC  MFH MFL AC  BE  UP
                    1   0   1   0   0   0   0   0   1   0   1   0   1   1   0   1   0   0   0
                    IA  BN  ED  RI  SS  DD  DA  ID  IT  MC  IS  CPL
                    0   1   0   0   0   0   0   0   1   0   0   0

 PREVSTACK       =                 00
 BSP             =  00000000.7FF12240
 BSPSTORE        =  00000000.7FF120C0
 BSPBASE         =  00000000.7FF120C0
 RNAT            =  00000000.00000000

 RSC             =  00000000.00000003 LOADRS   BE   PL   MODE
                                      0000     0    0    Eager

 PFS             =  00000000.00000B9F

                    PPL    PEC    RRB.PR   RRB.FR   RRB.GR     SOR       SOL           SOF
                    0       0.       0.       0.       0.       0.    23. (32-54)   31. (32-62)

 FLAGS           =                 00
 STKALIGN        =           000002D0
 PREDS           =  00000000.FF562AA3
 IHA             =  FFFFFFFF.7FF3E120
 INTERRUPT_DEPTH =                 00

 ISR             =  00000804.00000000


                    ED  EI  SO  NI  IR  RS  SP  NA  R   W   X   CODE
                    1   0   0   0   0   0   0   0   1   0   0   0000


 ITIR            =  00000000.FFFF0934 KEY       PS
                                      FFFF09    0D

 IFS             =  80000000.00000593


                    Valid         RRB.PR   RRB.FR   RRB.GR     SOR       SOL           SOF
                    1                0.       0.       0.       0.    11. (32-42)   19. (32-50)


 B0              =  FFFFFFFF.80241AE0 AMAC$EMUL_CALL_NATIVE_C+00340
 B1              =  80000000.FFD643B0
 B2              =  00000000.00000000
 B3              =  00000000.00000000
 B4              =  00000000.00000000
 B5              =  00000000.7FF43E38
 B6              =  00000000.00020110 SYS$K_VERSION_08+000F0
 B7              =  FFFFFFFF.80A28170 NSA$CHECK_PRIVILEGE_C

 GP              =  00000000.00240000
 R2              =  FFFFFFFF.839B8098 PSB+00058
 R3              =  E0000000.00000068
 R4              =  FFFFFFFF.839731C0 PCB
 R5              =  00000000.00000008
 R6              =  00000000.7FF43F40
 R7              =  00000000.00000002
 R8              =  00000000.00010000 SYS$K_VERSION_07
 R9              =  00000000.00000020
 R10             =  00000000.0000003E
 R11             =  00000000.00000001

 KSP             =  00000000.7FF43EA0

 R13             =  00000000.00000000
 R14             =  00000000.00040008 UCB$M_SUPMVMSG+00008
 R15             =  00000000.00020110 SYS$K_VERSION_08+000F0
 R16             =  FFFFFFFF.802417A0 AMAC$EMUL_CALL_NATIVE_C
 R17             =  00000000.00010004 UCB$M_DELETEUCB+00004
 R18             =  00000000.00040000 UCB$M_CHAN_TEAR_DOWN
 R19             =  00000000.00040000 UCB$M_CHAN_TEAR_DOWN
 R20             =  00000000.7FF43F38
 R21             =  00000000.7FF43F80
 R22             =  00000000.00040000 UCB$M_CHAN_TEAR_DOWN
 R23             =  00000000.00000000
 R24             =  00000000.00000000
 R25             =  00000000.00000000
 R26             =  00000000.00000000
 R27             =  00000000.FF565663
 R28             =  00000000.00000003
 R29             =  00000000.7FF43EA0
 R30             =  000007FD.C0000300
 R31             =  FFFFFFFF.806549D0 PROCESS_MANAGEMENT_MON+677D0

 R32             =  00000000.7AC9DBC0
 R33             =  00000000.00000001
 R34             =  00000000.7FFCF88C MMG$IMGHDRBUF+0008C
 R35             =  FFFFFFFF.83973528 ARB+00230
 R36             =  00000000.00000000
 R37             =  00000000.00000000
 R38             =  FFFFFFFF.80A28410 NSA$CHECK_PRIVILEGE_C+002A0
 R39             =  00000000.00000915
 R40             =  FFFFFFFF.82D01640 SYSTEM_PRIMITIVES+00221440
 R41             =  00000000.00000B9F
 R42             =  00000000.7FF43EA0

 R43/OUT0        =  00000000.7FFCF87C MMG$IMGHDRBUF+0007C
 R44/OUT1        =  E0000000.00000068
 R45/OUT2        =  00000000.00000000
 R46/OUT3        =  00000000.FF561663
 R47/OUT4        =  00000000.7FFCDA68 CTL$AG_CLIDATA
 R48/OUT5        =  00000000.7FFCDBE8 CTL$AG_CLIDATA+00180
 R49/OUT6        =  00000000.00000003
 R50/OUT7        =  FFFFFFFF.839731C0 PCB

 NATMASK         =               003A
 NATS            =  00000000.00000000
 CSD             =  CFFFFFFF.00000000
 SSD             =  CCCC0BAD.BAD0CCCC
 LC              =  00000000.00000000
 EC              =  00000000.00000000

 FPSR            =  0009804C.0270033F SF3    SF2    SF1    SF0    TRAPS
                                      004C   004C   004E   000C   3F

 F6              =  0FFC9.C0000000.00000000
 F7              =  1003E.00000000.00000018
 F8              =  1000B.FF000000.00000000
 F9              =  10007.A8000000.00000000
 F10             =  10003.C2492492.49249249
 F11             =  0FFF6.C30C30C3.0C30C30C

 PPREVMODE        =                 03

Instruction Stream:
-------------------
                                    { .mfb
         SYS$K_VERSION_08+000E0:                nop.m       000000
                                                nop.f       000000
                                                br.ret.sptk.many b0 ;;
                                    }
                                    { .mii
         SYS$K_VERSION_08+000F0:                alloc       r41 = ar.pfs,  0B, 08, 00
                                                mov         r29 = r12
                                                mov         r42 = r12
                                    }
                                    { .mmi
   PC => SYS$K_VERSION_08+00100:                ld4         r24 = [r0] ;;
                                                nop.m       000000
                                                sxt4        r24 = r24 ;;
                                    }
                                    { .mii
         SYS$K_VERSION_08+00110:                nop.m       000000

                                                sxt4        r14 = r24 ;;
                                                cmp.eq      p6, p7 = r14, r0
                                    }
                                    { .mfb
         SYS$K_VERSION_08+00120:                nop.m       000000
                                                nop.f       000000
                                           (p6) br.cond.dpnt.few 0000060
                                    }

Signal Array
------------
        Length = 00000005
        Type   = 0000000C
        Arg    = 00000000.00000000
        Arg    = 00000000.00000000
        Arg    = 00000000.00020120
        Arg    = 00000000.00000003
%SYSTEM-F-ACCVIO, access violation, reason mask=00, virtual address=0000000000000000,
                                                    PC=0000000000020120, PS=00000003


CPU 01 Processor state at time of SSRVEXCEPT bugcheck
-----------------------------------------------------


CPU 01 reason for Bugcheck: SSRVEXCEPT, Unexpected system service exception


Process currently executing on this CPU: SYSTEM


Current image file: IPFEX3$DKB200:[SYS0.][SYSMGR]X.EXE;2


Current IPL: 0  (decimal)


CPU database address: 8396DD80


CPUs Capabilities:    QUORUM,RUN


Exception Frame at 00000000.7FF435B0
------------------------------------

    IPL              =                 00
    TRAP_TYPE        =           00000041      Bugcheck Breakpoint Trap
    IVT_OFFSET       =           00002C00      Break Instruction
    IIP              =  FFFFFFFF.80491E90      EXCEPTION_MON+5E690
    IIPA             =  FFFFFFFF.80491E80      EXCEPTION_MON+5E680
    IFA              =  00000000.00030000      SYS$K_VERSION_01

.
.
.

    IIM              =  00000000.00100002      BREAK$C_SYS_BUGCHECK

    PPREVMODE        =                 00

    KR0              =  00000000.00000000
    KR1              =  00000000.00000000
    KR2              =  00000000.00000000
    KR3              =  00000000.00000003
    KR4              =  00000000.00000000
    KR5 (Next Timer) =  000000BC.DEA95C24
    KR6 (CPUdb VA)   =  FFFFFFFF.8396DD80
    KR7 (Slot VA)    =  FFFFFFFF.86910000

    KSP              =  00000000.7FF43880
    ESP              =  00000000.7FF68000
    SSP              =  00000000.7FFAC000
    USP              =  00000000.7AC9DB60

                No spinlocks currently owned by CPU 01


CPU 00 Processor state at time of CPUEXIT bugcheck
--------------------------------------------------


CPU 00 reason for Bugcheck: CPUEXIT, Shutdown requested by another CPU


Process currently executing on this CPU:   None

Current IPL: 31  (decimal)


CPU database address: 83864000


CPUs Capabilities:    PRIMARY,QUORUM,RUN


Exception Frame at FFFFFFFF.8696F9F0
------------------------------------

    IPL              =                 1F
    TRAP_TYPE        =           00000041      Bugcheck Breakpoint Trap
    IVT_OFFSET       =           00002C00      Break Instruction
    IIP              =  FFFFFFFF.802F62F0      SYSTEM_SYNCHRONIZATION+43BF0
    IIPA             =  FFFFFFFF.802F62F0      SYSTEM_SYNCHRONIZATION+43BF0
    IFA              =  FFFFFFFF.86A280C0

.
.
.

    IIM              =  00000000.00100002      BREAK$C_SYS_BUGCHECK

    PPREVMODE        =                 00

    KR0              =  00000000.203D0000
    KR1              =  00000000.60000000
    KR2              =  00000000.00000000
    KR3              =  00000000.0001001F
    KR4              =  00000000.00000000
    KR5 (Next Timer) =  000000C4.FDFE03C8
    KR6 (CPUdb VA)   =  FFFFFFFF.83864000
    KR7 (Slot VA)    =  FFFFFFFF.8690F000

    KSP              =  FFFFFFFF.8696FCC0
    ESP              =  FFFFFFFF.86971000
    SSP              =  FFFFFFFF.86957000
    USP              =  FFFFFFFF.86957000

                No spinlocks currently owned by CPU 00
This example from an OpenVMS IA-64 system shows summary information on the crash: the time it occurred, its OpenVMS version, hardware type, and bugcheck codes. This is followed by the exception frame from the exception that triggered the crash, the instruction stream active at the time of the exception, and the signal array that describes the exception. The exception frame from the bugcheck triggered by the original exception is then displayed (that is, the bugcheck on the crash CPU) followed by the bugcheck exception frame for the other CPU in the system.
4.38. SHOW DEVICE
Displays a list of all devices in the system and their associated data structures, or displays the data structures associated with a given device or devices.
Format
SHOW DEVICE [ device-name[:] | /ADDRESS=ucb-address | /BITMAP |
                        /CDT=cdt_address | /CHANNELS | /HOMEPAGE | /PDT |
                        /UCB=ucb-address]
Parameters
- device-name
Device or devices for which data structures are to be displayed. The following table lists several uses of the device-name parameter:
To display the structures for: Take the following action: All devices in the system Do not specify a device-name (for example, SHOW DEVICE). A single device Specify an entire device-name (for example, SHOW DEVICE VTA20). All devices of a certain type on a single controller Specify only the device type and controller designation (for example, SHOW DEVICE RTA or SHOW DEVICE RTB). All devices of a certain type on any controller Specify only the devicetype (for example, SHOW DEVICE RT). All devices whose names begin with a certain character or character string Specify the character or character string (for example, SHOW DEVICE D). All devices on a single node or HSC Specify only the node name or HSC name (for example, SHOW DEVICE GREEN$). All devices with a certain allocation class Specify the allocation class including leading and trailing $, for example, SHOW DEVICE $63$. A colon (:) at the end of a device name is optional.
Note
All qualifiers specific to Memory Channel (CHANNELS, HOMEPAGE, and PDT) are disabled for OpenVMS IA-64 systems.
Qualifiers
- /ADDRESS=ucb-address
Indicates the device for which data structure information is to be displayed by the address of its unit control block (UCB). The /ADDRESS qualifier is an alternate method of supplying a device name to the SHOW DEVICE command. If both the device-name parameter and the /ADDRESS qualifier appear in a single SHOW DEVICE command, SDA responds only to the parameter or qualifier that appears first. /ADDRESS is functionally equivalent to /UCB.
- /BITMAP
Displays information about data structures related to Write Bitmap (WBM). Bitmaps are used by Host-Base Volume Shadowing (HBVS) for the implementation of Mini Copy and Host-Based Minimerge (HBMM). If the /BITMAP qualifier is specified with a device that is not an HBVS virtual unit, the error NOSUCHDEV is returned
A device name must be specified. If SHOW DEVICE/BITMAP DSis entered, bitmaps for all HBVS virtual units are displayed.
- /CDT=cdt_address
Identifies the device by the address of its Connector Descriptor Table (CDT). This applies to cluster port devices only.
- /CHANNELS
Displays information on active Memory Channel channel blocks. This qualifier is ignored for devices other than Memory Channel.
- /HOMEPAGE
Displays fields from the Memory Channel Home Page. This qualifier is ignored for devices other than Memory Channel.
- /PDT
Displays the Memory Channel Port Descriptor Table. This qualifier is ignored for devices other than Memory Channel.
- /UCB=ucb-address
See the description of /ADDRESS, which is functionally equivalent to /UCB.
Description
The SHOW DEVICE command produces several displays taken from system data structures that describe the devices in the system configuration.
If you use the SHOW DEVICE command to display information for more than one device or one or more controllers, it initially produces the device data block (DDB) list to provide a brief summary of the devices for which it renders information in subsequent screens.
Information in the DDB list appears in five columns, the contents of which are as follows:
Address of the device data block (DDB)
Controller name
Name of the ancillary control process (ACP) associated with the device
Name of the device driver
Address of the driver prologue table (DPT)
The SHOW DEVICE command then produces a display of information pertinent to the device controller. This display includes information gathered from the following structures:
Device data block (DDB)
Primary channel request block (CRB)
Interrupt dispatch block (IDB)
Driver dispatch table (DDT)
If the controller is an HSC controller, SHOW DEVICE also displays information from its system block (SB) and each path block (PB).
Many of these structures contain pointers to other structures and driver routines. Most notably, the DDT display points to various routines located within driver code, such as the start I/O routine, unit initialization routine, and cancel I/O routine.
For each device unit subject to the SHOW DEVICE command, SDA displays information taken from its unit control block, including a list of all I/O request packets (IRPs) in its I/O request queue. For certain mass storage devices, SHOW DEVICE also displays information from the primary class driver data block (CDDB), the volume control block (VCB), and the ACP queue block (AQB). For units that are part of a shadow set, SDA displays a summary of shadow set membership.
As it displays information for a given device unit, SHOW DEVICE defines the symbols of the table below as appropriate:
| Symbol | Meaning |
|---|---|
| UCB | Address of unit control block |
| SB | Address of system block |
| ORB | Address of object rights block |
| DDB | Address of device data block |
| DDT | Address of driver dispatch table |
| CRB | Address of channel request block |
| SUD | Address of supplementary VCB data |
| SHAD | Address of host-based shadowing data structure |
| AMB | Associated mailbox UCB pointer |
| IRP | Address of I/O request packet |
| 2P_UCB | Address of alternate UCB for dual-pathed device |
| LNM | Address of logical name block for mailbox |
| PDT | Address of port descriptor table |
| CDDB | Address of class driver descriptor block for MSCP served device |
| 2P_CDDB | Address of alternate CDDB for MSCP served device |
| RWAITCNT | Resource wait count for MSCP served device |
| VCB | Address of volume control block for mounted device |
| 2P_DDB | Address of secondary DDB |
| VP_IRP | Address of volume processing IRP |
| MMB | Address of merge management block |
| CPYLOCK | ID of copier lock |
| VU_TO | Virtual Unit Timeout (seconds) |
| VU_UCB | UCB address of Virtual Unit |
| MPDEV | Address of multipath data structure |
| PRIMARY_UCB | UCB address for primary path |
| CURRENT_UCB | UCB address for current path |
If you are examining a driver-related system failure, you may find it helpful to issue a SHOW STACK command after the appropriate SHOW DEVICE command, to examine the stack for any of these symbols. Note, however, that although the SHOW DEVICE command defines those symbols relevant to the last device unit it has displayed, and redefines symbols relevant to any subsequently displayed device unit, it does not undefine symbols. (For instance, SHOW DEVICE DUA0 defines the symbol PDT, but SHOW DEVICE MBA0 does not undefine it, even though the PDT structure is not associated with a mailbox device.) To maintain the accuracy of such symbols that appear in the stack listing, use the DEFINE command to modify the symbol name. For example:
SDA> DEFINE DUA0_PDT PDT
SDA> DEFINE MBA0_UCB UCB
See the descriptions of the READ and FORMAT commands for additional information on defining and examining the contents of device data structures.
Examples
SDA> SHOW DEVICE/ADDRESS=8041E540
OPA0                                   VT300_Series       UCB address    8041E540

Device status:   00000010 online
Characteristics: 0C040007 rec,ccl,trm,avl,idv,odv
                 00000200 nnm
Owner UIC [000001 ,000004]  Operation count        160    ORB address    8041E4E8
      PID         00010008  Error count              0    DDB address    8041E3F8
Class/Type           42/70  Reference count          2    DDT address    8041E438
Def. buf. size          80  BOFF              00000001    CRB address    8041E740
DEVDEPEND         180093A0  Byte count        0000012C    I/O wait queue 8041E5AC
DEVDEPND2         FB101000  SVAPTE            80537B80
DEVDEPND3         00000000  DEVSTS            00000001
FLCK index              3A
DLCK address      8041E880
*** I/O request queue is empty ***
This example reproduces the SHOW DEVICE display for a single device unit, OPA0. Whereas this display lists information from the UCB for OPA0, including some addresses of key data structures and a list of pending I/O requests for the unit, it does not display information about the controller or its device driver. To display the latter information, specify the device-name as OPA (for example, SHOW DEVICE OPA).
SDA>  SHOW DEVICE DU
I/O data structures
-------------------
                            DDB list
                            --------

       Address    Controller     ACP         Driver               DPT
       -------    ----------   --------   ------------            ---

      80D0B3C0    BLUES$DUA     F11XQP    SYS$DKDRIVER          807735B0
      8000B2B8    RED$DUA       F11XQP    SYS$DKDRIVER          807735B0
      80D08BA0    BIGTOP$DUA    F11XQP    SYS$DKDRIVER          807735B0
      80D08AE0    TIMEIN$DUA    F11XQP    SYS$DKDRIVER          807735B0
   .
   .
   .
Press RETURN for more.
   .
   .
   .
This excerpt from the output of the SHOW DEVICE DU command illustrates the format of the DDB list. In this case, the DDB list concerns itself with those devices whose device type begins with DU. It displays devices of these types attached to various HSCs (RED$ and BLUES$) and systems in a cluster (BIGTOP$ and TIMEIN$).
4.39. SHOW DUMP
Displays formatted information from the header, error log buffers, logical memory blocks (LMBs), memory map, compression data, and a summary of the dump. Also displays hexadecimal information of individual blocks.
Format
SHOW DUMP [/ALL
| /BLOCK[=m [{:|;}n] ]
| /COLLECTION [= {ALL|n} ]
| /COMPRESSION_MAP [=m [:n[:p[{:|;}q]]]]
| /ERROR_LOGS
| /FILE = {COLLECTION | DUMP [=n]}
| /HEADER
| /LMB [= {ALL|n} ]
| /MEMORY_MAP
| /SUMMARY]
Parameters
None.
Qualifiers
- /ALL
Displays the equivalent to specifying all the /SUMMARY, /HEADER, /ERROR_LOGS, /COMPRESSION_MAP, /LMB=ALL, /MEMORY_MAP, and /COLLECTION qualifiers.
- /BLOCK [=m [{:|;}n] ]
- Displays a hexadecimal dump of one or more blocks. You can specify ranges by using the following syntax:
no value Displays next block m Displays single block m:n Displays a range of blocks from m to n, inclusive m;n Displays a range of blocks starting at m and continuing for n blocks - /COLLECTION [= {ALL|n} ]
Displays the contents of the file identification or unwind data collection (on IA-64 only) appended to a copy of the dump using COPY/COLLECT or written to a separate collection file using COLLECT/SAVE. By default, a summary of the collection is displayed. You can specify that the details of a single entry or all entries are to be displayed. n is the start block number of the collection entry, as displayed in the collection summary.
- /COMPRESSION_MAP [=m [:n[:p[{:|;}q]]] ]
In a compressed dump, displays details of the compression data. You can specify levels of detail by using the following syntax, where m,n,p,q may each be wildcarded (*):
no value Displays a summary of all compression map blocks. m Displays contents of a single compression map block. m:n Displays details of single compression map entry. m:n:p Displays compressed and raw data for the specified compression section (item p in section m:n). Note that m:n:p may contain wildcards (*). m:n:p:q Displays compressed and raw data for the specified range of compression sections (items p to q inclusive in section m:n). m:n:p;q Displays compressed and raw data for the specified range of compression sections ( q items starting from item p in section m:n). - /ERROR_LOGS
Displays a summary of the error log buffers.
- /FILE = {COLLECTION | DUMP [=n]}
If analyzing multiple dump files from a partial dump copy, or if a separate collection file is in use, the /FILE qualifier indicates whether the SHOW DUMP command applies to one of the dump files or to the collection file.
If /FILE is not specified, by default, the SHOW DUMP/SUMMARY, SHOW DUMP/HEADER, SHOW DUMP/COLLECTION, and SHOW DUMP/ALL commands apply to all open files, and the SHOW DUMP/LMB=ALL and SHOW DUMP/COMPRESSION commands apply to all open dump files. If /FILE=DUMP is specified without a file number, then these commands apply to the primary dump file.
By default, SHOW DUMP/BLOCK applies to the primary dump file. By default, SHOW DUMP/LMB=n and SHOW DUMP/COMPRESSION=n apply to the primary dump file or to the dump file for which the command was last used.
All other qualifiers are applicable only to the primary dump file.
- /HEADER
Displays the formatted contents of the dump header.
- /LMB[= {ALL|n} ]
In a selective dump, displays the formatted contents of logical memory block (LMB) headers and the virtual address (VA) ranges within the LMB. You can specify the LMBs to be displayed by using the following syntax:
no value Displays next LMB n Displays LMB at block n of the dump ALL Displays all LMBs - /MEMORY_MAP
In a full dump, displays the contents of the memory map.
- /SUMMARY
Displays a summary of the dump. This is the default.
Description
The SHOW DUMP command displays information about the structure of the dump file. It displays the header, the error log buffers, and, if appropriate, the compression map, the logical memory block (LMB) headers, the memory map, the file identification collection, and the unwind data collection (on IA-64 systems only). Use this command when troubleshooting dump analysis problems.
Examples
SDA> SHOW DUMP/SUMMARY
Summary of dump file DKA300:[SYS0.SYSEXE]SYSDUMP.DMP;8
------------------------------------------------------
Dump type:                   Compressed selective
Size of dump file:           000203A0/000203A0 (132000./132000.)
Highest VBN written:         0000D407          (54279.)
Uncompressed equivalent:     0001AF1C          (110364.)
Compression ratio:           2.03:1            (49.2%)


                                                                     Uncomp    Uncomp
                      Dump file section             VBN     Blocks     VBN     blocks
----------------------------------------------  ---------- --------  -------  --------
Dump header                                       00000001 00000002
Error log buffers                                 00000003 00000020
Compression map                                   00000023 00000010
LMB 0000 (PT space)                               00000033 00000038  00000033 000000D2
LMB 0001 (S0/S1 space)                            0000006B 0000621B  00000105 000095A5
LMB 0002 (S2 space)                               00006286 000001A3  000096AA 00000352
LMB 0003 (Page tables of key process "SYSTEM")    00006429 00000005  000099FC 00000062
LMB 0004 (Memory of key process "SYSTEM")         0000642E 00000071  00009A5E 00000342
   .
   .
   .
LMB 0003 (Page tables of key process "NETACP")    0000697B 00000009  0000AE14 00000052
LMB 0004 (Memory of key process "NETACP")         00006984 000013F7  0000AE66 00001F42
LMB 0005 (Key global pages)                       00007D7B 000002BA  0000CDA8 00000312
LMB 0006 (Page tables of process "DTWM")          00008035 00000013  0000D0BA 00000082
LMB 0007 (Memory of process "DTWM")               00008048 000013A3  0000D13C 000022E4
   .
   .
   .
LMB 0006 (Page tables of process "Milord_FTA1:")  0000C5E3 00000005  00019A44 00000062
LMB 0007 (Memory of process "Milord_FTA1:")       0000C5E8 00000074  00019AA6 00000222
LMB 0008 (Remaining global pages)                 0000C65C 00000DAC  00019CC8 00001255
This example of the SHOW DUMP/SUMMARY command gives a summary of a selective dump.
SDA> SHOW DUMP/HEADER
Dump header
-----------
    Header field                      Meaning                        Value
--------------------  ---------------------------------------  -----------------
DMP$W_FLAGS           Flags                                                 0FC1
                       DMP$V_OLDDUMP:    Dump has been analyzed
                       DMP$V_WRITECOMP:  Dump write was completed
                       DMP$V_ERRLOGCOMP: Error log buffers written
                       DMP$V_DUMP_STYLE: Selective dump
                                         Verbose messages
                                         Dump off system disk
                                         Compressed
DMP$B_FLAGS2          Additional flags                                        09
                       DMP$V_COMPRESSED: Dump is compressed
                       DMP$V_ALPHADUMP:  This is an OpenVMS Alpha dump
DMP$Q_SYSIDENT        System version                                  "X69G-FT1"
DMP$Q_LINKTIME        Base image link date/time        " 8-JUN-1996 02:07:27.31"
DMP$L_SYSVER          Base image version                                03000000
DMP$W_DUMPVER         Dump version                                          0704
DMP$L_DUMPBLOCKCNT    Count of blocks dumped for memory                 0000D3D5
DMP$L_NOCOMPBLOCKCNT  Uncompressed blocks dumped for memory             0001AEEA
DMP$L_SAVEPRCCNT      Number of processes saved                         00000014
   .
   .
   .
EMB$Q_CR_TIME         Crash date/time                  " 3-JUL-1996 09:30:13.36"
EMB$L_CR_CODE         Bugcheck code                                 "SSRVEXCEPT"
EMB$B_CR_SCS_NAME     Node name                                       "SWPCTX  "
EMB$T_CR_HW_NAME      Model name                            "DEC 3000 Model 400"
EMB$T_CR_LNAME        Process name                                      "SYSTEM"
DMP$L_CHECKSUM        Dump header checksum                              439E5E91
This example of the SHOW DUMP/HEADER command shows the information in the header.
SDA> SHOW DUMP/COLLECTION

File and unwind data collection
-------------------------------

Collection start VBN:     0002155B
Collection end VBN:       00022071
Collection block count:   00000B17

  VBN       Blocks        Contents
--------   --------   ------------------------------
0002155B   000000C1   Unwind data segment 00000001 of _$30$DKB200:[VMS$COMMON.SYSEXE]DCL.EXE;1
0002161C   00000001   Unwind data segment 00000001 of _$30$DKB200:[VMS$COMMON.SYSEXE]USB$UC...
0002161D   0000000C   Unwind data segment 00000008 of _$30$DKB200:[VMS$COMMON.SYSEXE]USB$UC...
.
.
.
0002200F   0000001F   Unwind data segment 00000007 of _$30$DKB200:[VMS$COMMON.SYSEXE]LATACP...
0002202E   00000006   Unwind data segment 0000000B of _$30$DKB200:[VMS$COMMON.SYSEXE]LATACP...
00022034   00000001   Unwind data segment 00000002 of _$30$DKB200:[BISHOP]CMEXEC_LOOP.EXE;1
00022035   00000001   File data for _$30$DKA0:
00022036   0000003B   File data for _$30$DKB200:
00022071   00000001   Disk data
This example of the SHOW DUMP/COLLECTION command shows the contents of the file identification and unwind data collection appended to a system dump when it was copied using the SDA command COPY/COLLECT. Note that unwind data segments are found only in system dumps taken on OpenVMS IA-64 systems.
4.40. SHOW EFI (IA-64 Only)
Displays information from the Extensible Firmware Interface (EFI) data structures. Currently, the only display provided by SDA is the EFI memory map.
Format
SHOW EFI /MEMMAP [=ALL] [range]
Parameters
- range
The entry or range of entries to be displayed, expressed using the following syntax:
m Displays entry m m:n Displays the entries from m to n m;n Displays n entries starting at m You cannot specify a range with /MEMMAP=ALL.
Qualifiers
- /MEMMAP [=ALL]
Displays the EFI memory map. This qualifier is required. By default, only entries in the EFI memory map with the RUNTIME attribute are displayed. If /MEMMAP=ALL is specified, all entries are displayed.
You cannot specify /MEMMAP=ALL and also supply a range of entries to be displayed.
Description
SDA locates the EFI memory map in the system or dump and displays the contents. If no range is given, SDA also displays information about the location and size of the memory map.
Examples
SDA> SHOW EFI/MEMMAP

EFI Memory Map
--------------

Memory map address:            FFFFF802.06402000
Entry count:                            00000025
Size of entry:                          00000030

Entry        Memory Type       Physical Address    Virtual Address      Pages (4KB)        Attributes
-----  ----------------------  -----------------  -----------------  -----------------  -----------------
 0003  Runtime_Services_Code   00000000.000C0000  FFFFF802.00000000  00000000.00000040  80000000.00000001  UC  Runtime
 0016  Runtime_Services_Data   00000000.3F048000  FFFFF802.00040000  00000000.00000304  80000000.00000008  UCE Runtime
 0017  Runtime_Services_Code   00000000.3F34C000  FFFFF802.00344000  00000000.0000003C  80000000.00000008  UCE Runtime
 0019  Runtime_Services_Data   00000000.3F3E2000  FFFFF802.00380000  00000000.00000012  80000000.00000008  UCE Runtime
 001A  Runtime_Services_Code   00000000.3F3F4000  FFFFF802.00392000  00000000.0000006E  80000000.00000008  UCE Runtime
 001B  Runtime_Services_Data   00000000.3F462000  FFFFF802.00400000  00000000.00000182  80000000.00000008  UCE Runtime
 001C  Runtime_Services_Code   00000000.3F5E4000  FFFFF802.00582000  00000000.000004DC  80000000.00000008  UCE Runtime
 001D  PAL_Code                00000000.3FAC0000  FFFFF802.00A80000  00000000.00000040  80000000.00000008  UCE Runtime
 0020  Runtime_Services_Data   00000000.3FB38000  FFFFF802.00AC0000  00000000.000004C8  80000000.00000008  UCE Runtime
 0022  Memory_Mapped_IO        00000000.FED00000  FFFFF802.01000000  00000000.00001300  80000000.00000001  UC  Runtime
 0024  Mem_Map_IO_Port_Space   0003FFFF.FC000000  FFFFF802.02400000  00000000.00004000  80000000.00000001  UC  Runtime
This example shows a typical display from the SHOW EFI/MEMMAP command.
4.41. SHOW EXCEPTION_FRAME
Displays the contents of the exception frame at the given address or searches to display a one-line summary of all exception frames found on all applicable stacks.
Format
SHOW EXCEPTION_FRAME {address | [/SUMMARY] [range]}
Parameter
- address
Address of the exception frame.
- range
Range of addresses specifiable as start:end or start;length.
Qualifier
- /SUMMARY (D)
The /SUMMARY qualifier is the default.
SHOW EXCEPTION and SHOW EXCEPTION range imply /SUMMARY.
If a range, either start:end or start;length, is given, then that range is searched instead of the stacks.
Description
Displays the contents of the exception frame at the given address (which is rounded down to an octaword-aligned address), or searches to display a one-line summary of all exception frames found on all applicable stacks.
Under some circumstances, the exception frame of the actual bugcheck is copied (by BUGCHECK) to the system stack for the CPU. Since this stack is also searched, multiple hits may occur for this exception frame.
On Alpha, the search for exception frames relies on valid processor status (PS) values in the PS offset from each possible 64-byte-aligned start address for an exception frame. Since only some of the bits in the PS can be validated, there may be frames displayed that are not exception frames (false positives). Do not assume that each frame displayed is actually an exception frame without further investigation.
On IA-64, the search for exception frames is focused on the type/subtype offsets from each possible octaword-aligned start address for an exception frame. Thus, it is likely that frames displayed are exception frames.
Examples
SDA>  SHOW EXCEPTION
Exception Frame Summary
-----------------------
 Exception Frame  Type            Stack   IIP / Ret_Addr   Trap_Type / Service_Number
----------------- ----            -----  ----------------- --------------------------
00000000.7FF43540 ORIGINAL_INTSTK Kernel FFFFFFFF.8048DB70 00000041 Bugcheck Breakpoint Trap
00000000.7FF43BA0 INTSTK          Kernel 00000000.00020200 00000008 Access control violation fault
00000000.7FF43F40 SSENTRY         Kernel 00000000.00020090 01000019 SYS$CMKRNL
The SHOW EXCEPTION_FRAME command example displays the summary.
Examples of the display of the contents of an exception frame are available in the SHOW CRASH description.
4.42. SHOW EXECUTIVE
Displays the location and size of each loadable image that makes up the executive.
Format
SHOW EXECUTIVE [execlet-name | /ALL | /SUMMARY (D)]
Parameter
- execlet-name
Displays detailed data for the specified loadable image only. If you use wildcards in execlet-name, SDA displays detailed data for all matching loadable images.
If the command is specified with no parameter or qualifier, the default is to display one line of data for each loadable image.
Qualifiers
- /ALL
Displays detailed data for all loadable images.
- /SUMMARY
Displays a single line of data for all loadable images. This is the default.
Description
The executive consists of two base images and a number of other executive images.
The base image called SYS$BASE_IMAGE.EXE contains:
Symbol vectors for universal executive routines and data cells
Procedure descriptors for universal executive routines
Globally referenced data cells
The base image called SYS$PUBLIC_VECTORS.EXE contains:
Symbol vectors for system service procedures
Procedure descriptors for system services
Transfer routines for system services
The base images are the pathways to routines and system service procedures in the other executive images.
The SHOW EXECUTIVE command lists the location and size of each executive image with other information such as link date and time. It can enable you to determine whether a given memory address falls within the range occupied by a particular image. (Table 4.1, ''Modules Defining Global Locations Within Executive Images'' describes the contents of each executive image.)
SHOW EXECUTIVE also displays the base address and length for each nonzero length image section.
On OpenVMS Alpha the execlets can be sliced; on OpenVMS IA-64 all execlets are sliced. This means each different image section can be relocated in system memory so that the sections are no longer contiguous. The SHOW EXECUTIVE display contains information on where each image section resides.
The difference between a sliced image and a non-sliced image in the display is that the base, the end, and the length of a sliced image are blank. Only the image section base, end, and length are valid.
On Alpha, there are six different image section types: nonpaged read only, nonpaged read-write, paged read only, paged read-write, init, and fixup. Each section type can occur only once. Only the image sections loaded into system memory are displayed.
On IA-64, there are six different image section types: code, short data, read-only data, read-write data, init, and fixup. Some section types can occur more than once. Only the image sections loaded into system memory are displayed.
The MAP command makes it easier to find out in which execlet an address resides. See the description of the MAP command for details.
By default, SDA displays each location within an executive image as an offset from the beginning of the image, for instance, EXCEPTION+00282. Similarly, those symbols that represent system services point to the transfer routine in SYS$PUBLIC_VECTORS.EXE and not to the actual system service procedure. When tracing the course of a system failure through the listings of modules contained within a given executive image, you may find it useful to load into the SDA symbol table all global symbols and global entry points defined within one or all executive images. See the description of the READ command for additional information.
The SHOW EXECUTIVE command usually shows all components of the executive, as illustrated in the following example. In rare circumstances, you may obtain a partial listing. For instance, after it has loaded the EXCEPTION module (in the INIT phase of system initialization), the system can successfully post a bugcheck exception and save a crash dump before loading all the executive images that are normally loaded.
Examples
SDA> SHOW EXECUTIVE
VMS Executive layout summary
----------------------------


Image           LDRIMG   SeqNum        Base               End             Length        SymVec
-------------- -------- -------- ----------------- ----------------- ----------------- --------
SYS$MADDRIVER  8161BCC0 00000094 FFFFFFFF.837C2000 FFFFFFFF.837DDFFF 00000000.0001C000
SYS$DADDRIVER  8161AB80 00000092 FFFFFFFF.82238000 FFFFFFFF.82247FFF 00000000.00010000
SYS$LASTDRIVER 81617540 00000090 FFFFFFFF.813DA000 FFFFFFFF.813F5FFF 00000000.0001C000
SYS$LTDRIVER   81611B40 0000008E FFFFFFFF.813A2000 FFFFFFFF.813D9FFF 00000000.00038000
LAT$RATING     81611440 0000008C FFFFFFFF.8139A000 FFFFFFFF.813A1FFF 00000000.00008000
PWIPDRIVER     8160B440 0000008A FFFFFFFF.81386000 FFFFFFFF.81399FFF 00000000.00014000
  .
  .
  .
ERRORLOG               814195C0 00000014 --< sliced >--
SYSTEM_SYNCHRONIZATION 81418840 00000012 --< sliced >--
SYSTEM_PRIMITIVES      81417AC0 00000010 --< sliced >--
SYSTEM_DEBUG           81416D40 0000000E FFFFFFFF.83382000 FFFFFFFF.833E5FFF 00000000.00064000
SYS$OPDRIVER           81415FC0 0000000C --< sliced >--
SYS$ESBTDRIVER         81415240 0000000A --< sliced >--
The SHOW EXECUTIVE command displays a summary list of the executive images. The display has been moved left to fit within the page boundaries of the manual.
SDA> SHOW EXECUTIVE EX*
VMS Executive layout
--------------------


Image                     Base               End             Length       ImageOff  SymVec
------------------  ----------------- ----------------- ----------------- -------- --------
EXCEPTION_MON
 Data (read/write)  FFFFFFFF.841BAC00 FFFFFFFF.841BAC13 00000000.00000014 00010000
 Data (read/write)  FFFFFFFF.841BAE00 FFFFFFFF.841BAE03 00000000.00000004 00014000
 Code               FFFFFFFF.8041E600 FFFFFFFF.80508D5F 00000000.000EA760 00018000
 Data (read only)   FFFFFFFF.841BB000 FFFFFFFF.841C278F 00000000.00007790 00104000
 Data (read/write)  FFFFFFFF.841C2800 FFFFFFFF.841D049F 00000000.0000DCA0 0010C000
 Data (read/write)  FFFFFFFF.841D0600 FFFFFFFF.841D0613 00000000.00000014 0011C000
 Data (read only)   FFFFFFFF.841D0800 FFFFFFFF.841D7D93 00000000.00007594 00120000
 Short data         FFFFFFFF.841D7E00 FFFFFFFF.841DF247 00000000.00007448 00130000
  Linked  2-APR-2004 13:08  LDRIMG 84891900   SeqNum 00000022       GP FFFFFFFF.843D7E00

EXEC_INIT
 Code               FFFFFFFF.80327700 FFFFFFFF.803B304F 00000000.0008B950 00010000
 Data (read only)   FFFFFFFF.84196C00 FFFFFFFF.8419D62F 00000000.00006A30 0009C000
 Data (read/write)  FFFFFFFF.8419D800 FFFFFFFF.841A7987 00000000.0000A188 000A4000
 Short data         FFFFFFFF.841A7A00 FFFFFFFF.841AA2DF 00000000.000028E0 000B0000
  Linked 23-MAR-2004 15:02   LDRIMG 84889040   SeqNum 0000001E       GP FFFFFFFF.843A7A00
This example from IA-64 displays the use of the wildcard with the SHOW EXECUTIVE command. The display has been moved left to fit within the page boundaries of the manual.
4.43. SHOW GALAXY
Displays a brief one-page summary of the state of the Galaxy and all the instances in the Galaxy.
Format
SHOW GALAXY
Parameters
None.
Qualifiers
None.
Examples
SDA> SHOW GALAXY
Galaxy summary
--------------
  GMDB address        Creator node ID  Revision       Creation time
-----------------     ---------------  --------  -----------------------  -----
FFFFFFFF.7F234000         00000001        1.0    31-MAR-1999 13:15:08.08      O

Node ID     NODEB address      Name    Version        Join time
--------  -----------------  --------  --------  -----------------------  -----
00000000  FFFFFFFF.7F236000  ANDA1A       1.0    31-MAR-1999 14:11:09.08
00000001  FFFFFFFF.7F236200  ANDA2A       1.0    31-MAR-1999 14:10:49.06
00000002  FFFFFFFF.7F236400  ANDA3A       1.0    31-MAR-1999 14:13:26.16
00000003  FFFFFFFF.7F236600                      - Node block is empty -
This SHOW GALAXY example shows the summary of the state of the Galaxy.
4.44. SHOW GCT
Displays the contents of the Galaxy configuration tree either in summary (hierarchical format) or in detail, node by node.
Format
SHOW GCT [/ADDRESS=n | /ALL | /HANDLE | /OWNER=n
| /SUMMARY (D) | /TYPE=type ]
[/CHILDREN] | [/FULL]
Parameters
None.
Qualifiers
- /ADDRESS=n
Displays the Galaxy configuration tree (GCT) node at the given address.
- /ALL
Provides a detailed display of all nodes in the tree.
- /CHILDREN
When used with /ADDRESS=n or /HANDLE=n, the /CHILDREN qualifier causes SDA to display all nodes in the configuration tree that are children of the specified node.
- /FULL
When used with /CHILDREN, /OWNER=n, or /TYPE=type, the /FULL qualifier causes SDA to provide a detailed display of each node.
- /HANDLE=n
Provides a detailed display of the Galaxy configuration tree (GCT) node with the given handle.
- /OWNER=n
Displays all nodes in the tree currently owned by the node with the given handle.
- /SUMMARY
Provides a summary display of the Galaxy configuration tree (GCT) in hierarchical form. This qualifier is the default.
- /TYPE=type
Displays all nodes in the tree of the given type, which can be one of the following:
BUS CAB COMMUNITY CORE CPU CPU_MODULE EXP_CHASSIS FRU_DESC FRU_ROOT HARD_PARTITION HOSE HW_ROOT IO_CTRL IOP MEMORY_CTRL MEMORY_DESC MEMORY_SUB PARTITION POWER_ENVIR PSEUDO RISER ROOT SBB SLOT SMB SOC SOCKET SW_ROOT SYS_CHASSIS SYS_INTER_SWITCH TEMPLATE_ROOT THREAD The type given may be an exact match, in which case just that type is displayed (for example, a CPU); or a partial match, in which case all matching types are displayed (for example, /TYPE=CP displays both CPU and CPU_MODULE nodes).
Description
Examples
SDA> SHOW GCT
Galaxy Configuration Tree summary
---------------------------------
Base address of Config Tree: FFFFFFFF.83694040 (2 pages)
Initial Current Name/Min PA/ OS type/Max PA/
Handle Hierarchy Id Owner Owner Base PA Size (bytes) Flags
-------- ------------------- ----------------- -------- -------- ----------------- ----------------- ------------------------
00000000 Root 00000000.00000000 414C4147-5958-0030-0000-......
|
00000240 |_HW_Root 00000000.00000000
00000280 | |_IOP 00000000.00000006 00001800 000000A0.00000000 000000AF.FFFFFFFF
00000300 | |_IOP 00000000.00000007 00001700 000000B0.00000000 000000BF.FFFFFFFF
00000380 | |_IOP 00000000.00000008 00001600 000000C0.00000000 000000CF.FFFFFFFF
00000400 | |_CPU_Module 00000000.00000000 00001580
00000440 | | |_CPU 00000000.09000000 00001600 Primary
00000480 | | |_CPU 00000000.1B000001 00001600 00001800
000004C0 | |_CPU_Module 00000000.00000001 00001580
00000500 | | |_CPU 00000000.1B000002 00001600 00001800
00000540 | | |_CPU 00000000.10000003 00001600 00001700
00000580 | |_CPU_Module 00000000.00000002 00001580
000005C0 | | |_CPU 00000000.07000004 00001700 Primary
00000600 | | |_CPU 00000000.0A000005 00001700 00001800
00000640 | |_CPU_Module 00000000.00000003 00001580
00000680 | | |_CPU 00000000.07000006 00001800 Primary
000006C0 | | |_CPU 00000000.0C000007 00001800 00001600
00000700 | |_Memory_Sub 00000000.00000000 00001580 00000000.00000000 00000000.FFFFFFFF
00000780 | |_Memory_Ctrl 00000000.00000005 00001600
000007C0 | |_Memory_Desc 00000000.00000000 00001600 00000000.00000000 00000000.40000000
| | |_Fragment 00001600 00000000.00000000 00000000.00200000 Console Private Base
| | |_Fragment 00001600 00000000.00200000 00000000.3FD7E000 Private Base
| | |_Fragment 00001600 00000000.3FF7E000 00000000.00082000 Console Private Base
00000A40 | |_Memory_Desc 00000000.40000000 00001700 00000000.40000000 00000000.40000000
| | |_Fragment 00001700 00000000.40000000 00000000.00200000 Console Private Base
| | |_Fragment 00001700 00000000.40200000 00000000.3FD7E000 Private Base
| | |_Fragment 00001700 00000000.7FF7E000 00000000.00082000 Console Private Base
00000CC0 | |_Memory_Desc 00000000.80000000 00001800 00000000.80000000 00000000.40000000
| | |_Fragment 00001800 00000000.80000000 00000000.00200000 Console Private Base
| | |_Fragment 00001800 00000000.80200000 00000000.3FD7E000 Private Base
| | |_Fragment 00001800 00000000.BFF7E000 00000000.00082000 Console Private Base
00000F40 | |_Memory_Desc 00000000.C0000000 00001580 00000000.C0000000 00000000.40000000
| |_Fragment 00001580 00000000.C0000000 00000000.40000000 Shared
|
000011C0 |_SW_Root 00000000.00000000
00001580 | |_Community 00000000.00000000 000011C0
00001600 | |_Partition 00000000.00000000 00001580 ANDA1A OpenVMS Alpha
00001700 | |_Partition 00000000.00000001 00001580 ANDA2A OpenVMS Alpha
00001800 | |_Partition 00000000.00000002 00001580 ANDA3A OpenVMS Alpha
|
00001200 |_Template_Root 00000000.00000000
00001240 |_IOP 00000000.00000000
000012C0 |_CPU 00000000.00000000
00001300 |_Memory_Desc 00000000.00000000 00000000.02000000
This command shows the summary (hierarchical) display of the configuration tree.
SDA> SHOW GCT/HANDLE=00000700

Galaxy Configuration Tree
-------------------------

Handle:                           00000700   Address:        FFFFFFFF.83694740
Node type:                      Memory_Sub   Size:                        0080
Id:                      00000000.00000000   Flags:          00000000.00000001 Hardware


Related nodes:

    Node relationship     Handle             Type                   Id
  ---------------------  --------    ---------------------   -----------------
  Initial owner          00001580    Community               00000000.00000000
  Current owner          -<Same>-
  Parent                 00000240    HW_Root                 00000000.00000000
  Previous sibling       00000640    CPU_Module              00000000.00000003
  Next sibling           -<None>-
  Child                  00000780    Memory_Ctrl             00000000.00000005
  Configuration binding  00000240    HW_Root                 00000000.00000000
  Affinity binding       00000240    HW_Root                 00000000.00000000

Min. physical address:   00000000.00000000
Max. physical address:   00000000.FFFFFFFF
This command shows the detailed display of the specified node.
4.45. SHOW GLOBAL_SECTION_TABLE
Displays information contained in the global section table, including pageable sections of loadable images. Functionally equivalent to SHOW GST.
Format
SHOW GLOBAL_SECTION_TABLE [/SECTION_INDEX=n]
SHOW GST [/SECTION_INDEX=n]
Parameters
None.
Qualifiers
- /SECTION_INDEX=n
Displays only the global section table entry for the specified section.
Description
Displays the entire contents of the global section table, unless you specify the qualifier /SECTION_INDEX. This command is equivalent to SHOW PROCESS/PROCESS_SECTION_TABLE/SYSTEM. SDA displays the information in the table below for each GST entry.
| Part | Definition |
|---|---|
| INDEX | Index number of the entry. Entries in the global section table begin at the highest location in the table, and the table expands toward lower addresses. |
| ADDRESS | Address of the global section table entry. |
| SECT/GPTE | Virtual address that marks the beginning of the first page of the section described by this entry, if a loadable image; or the virtual address of the global page table entry for the first page, if a global section. |
| GSD | Address of the corresponding Global Section Descriptor. This field is zero for loadable images. |
| PAGELETS | Length of the global section. This is in units of pagelets, except for a PFN-mapped section in which the units are pages. |
| VBN | Virtual block number. The number of the file's virtual block that is mapped into the section's first page. |
| WINDOW | Address of the window control block on which the section file is open. |
| REFCNT | Number of pages of this section that are currently mapped. |
| FLINK | Forward link. The pointer to the next entry in the GST list. |
| BLINK | Backward link. The pointer to the previous entry in the GST list. |
| FLAGS | Flags that describe the access that the system and processes have to the global section. |
Examples
SDA> SHOW GST
Global Section Table
--------------------
Global section table information
--------------------------------
Last entry allocated 00000238
First free entry 00000000
Global section table
--------------------
 Index Address Sect/GPTE Addr CCB/GSD Pagelets VBN Window Refcnt Flink Blink Flags
 -------- -------- ----------------- -------- -------- -------- -------- -------- ----- ----- --------------------
00000001 81409FD8 FFFFFFFF.83384000 00000000 00000025 00000003 81419E40 00000003 0000 0000 AMOD=KRNL
00000002 81409FB0 FFFFFFFF.833AE000 00000000 00000064 00000220 8141A040 00000007 0000 0000 AMOD=KRNL
00000003 81409F88 FFFFFFFF.83312000 00000000 00000001 0000063A 81450BC0 00000001 0000 0000 CRF WRT AMOD=KRNL
00000004 81409F60 FFFFFFFF.833C0000 00000000 00000003 00000003 814233C0 00000001 0000 0000 AMOD=KRNL
00000005 81409F38 FFFFFEFE.00058890 82065C70 00000002 0000000D 814F9AC0 00000003 0005 0005 WRTMOD=EXEC AMOD=USER PERM
Name = INS$82065BC0_003 SYSGBL
File = DISK$X97D_R2Y:[VMS$COMMON.SYSLIB]DECW$TRANSPORT_COMMON.EXE;1
00000006 81409F10 FFFFFFFF.833E6000 00000000 00000011 00000023 8142E480 00000002 0000 0000 AMOD=KRNL
00000007 81409EE8 FFFFFEFE.00052010 82025CA0 0000000C 00000004 814C0600 00000000 0007 0007 WRTMOD=EXEC AMOD=USER PERM
File = DISK$X97D_R2Y:[VMS$COMMON.SYSLIB]SYS$SSISHR.EXE;1 SYSGBL
00000008 81409EC0 FFFFFFFF.83400000 00000000 000000B4 00000003 81446340 0000000C 0000 0000 AMOD=KRNL
00000009 81409E98 FFFFFFFF.83418000 00000000 00000038 000000B7 81446340 00000001 0000 0000 CRF WRT AMOD=KRNL
0000000A 81409E70 FFFFFEFE.00052028 820261B0 00000027 00000019 814C0AC0 00000003 000A 000A WRTMOD=EXEC AMOD=USER PERM
Name = INS$82026130_006 SYSGBL
File = DISK$X97D_R2Y:[VMS$COMMON.SYSLIB]DISMNTSHR.EXE;1
0000000B 81409E48 FFFFFEFE.00052050 82026630 0000007A 00000004 814C0D00 00000008 000B 000B WRTMOD=EXEC AMOD=USER PERM
Name = INS$82026540_002 SYSGBL
File = DISK$X97D_R2Y:[VMS$COMMON.SYSLIB]DTI$SHARE.EXE;1
.
.
.
4.46. SHOW GLOCK
Displays the Galaxy locks for the Galaxy Management Database (GMDB), process tables, and/or system tables.
Format
SHOW GLOCK [/ADDRESS=n [/PHYSICAL]
| /ALL
| /GMDB_TABLE
| /HANDLE=n [/LINKED]
| /PROCESS_TABLE [=n ]
| /SYSTEM_TABLE [=n ]]
[/BRIEF]
Parameters
None.
Qualifiers
- /ALL
Displays information provided by the /GMDB_TABLE, /PROCESS_TABLE, and /SYSTEM_TABLE qualifiers. The /ALL qualifier also displays information from the base GMDB Galaxy lock.
- /BRIEF
Displays a single line for each Galaxy lock, regardless of any other qualifiers.
- /GMDB_TABLE
Displays the Galaxy lock table for the Galaxy Management Database (GMDB) including the embedded and attached Galaxy locks.
- /PROCESS_TABLE [=n]
Displays all the process Galaxy lock tables with the embedded and attached Galaxy locks, as well as a summary table. The /PROCESS_TABLE=n qualifier displays the single Galaxy lock table without a summary page.
- /SYSTEM_TABLE [=n]
Displays all the system Galaxy lock tables with the embedded and attached Galaxy locks, as well as a summary table. The /SYSTEM_TABLE=n qualifier displays the single Galaxy lock table without a summary page.
- /ADDRESS=n [/PHYSICAL]
Displays the single Galaxy lock at address n. Because process Galaxy locks are located by their physical address, you must use the /PHYSICAL qualifier to enter such an address.
- /HANDLE=n [/LINKED]
Displays the single Galaxy lock whose handle is n. The optional qualifier /LINKED causes SDA to display all Galaxy locks linked to the one specified.
Examples
SDA> SHOW GLOCK
Galaxy Lock Database
--------------------

Base address of GLock segment of GMDB:       FFFFFFFF.7F238000
Length:                                      00000000.00082000

  Nodes:                 00000000.00000007   Flags:          00000000.00000000

Process tables:          00000000.00000400   System tables:  00000000.00000400
  First free:                     00000002                            00000001
  First used:                     00000001                            00000000

Embedded GLocks:

GLock address:           FFFFFFFF.7F238020   Handle:         80000000.00000805

  GLock name:            GMDB_GLOCK_LOCK     Flags:                         00
  Owner count:                          00   Owner node:                    00
  Node sequence:                      0000   Owner:                     000000
  IPL:                                  08   Previous IPL:                  00
  Wait bitmask:          00000000.00000000   Timeout:                 00000000
  Thread ID:             00000000.00000000

GLock address:           FFFFFFFF.7F238190   Handle:         80000000.00000833

  GLock name:            PRC_LCKTBL_LOCK     Flags:                         00
  Owner count:                          00   Owner node:                    00
  Node sequence:                      0000   Owner:                     000000
  IPL:                                  08   Previous IPL:                  00
  Wait bitmask:          00000000.00000000   Timeout:                 00000000
  Thread ID:             00000000.00000000

GLock address:           FFFFFFFF.7F2381D0   Handle:         80000000.0000083B

  GLock name:            SYS_LCKTBL_LOCK     Flags:                         00
  Owner count:                          00   Owner node:                    00
  Node sequence:                      0000   Owner:                     000000
  IPL:                                  08   Previous IPL:                  00
  Wait bitmask:          00000000.00000000   Timeout:                 00000000
  Thread ID:             00000000.00000000
This example shows the summary of the Galaxy lock database.
SDA> SHOW GLOCK/PROCESS_TABLE
Galaxy Lock Database: Process Lock Table #0001
----------------------------------------------

Base address of Process Lock Table #0001:    FFFFFFFF.7F23A000

  Lock size:                          0040   Flags:                         01  VALID
  Region Index/Sequence:     0008/00000001   Access mode:                   03
  Region physical size:  00000000.00002000   Virtual size:   00000000.00002000
  Number of locks:       00000000.00000080   Nodes:          00000000.00000007

Per-node reference counts:

    Node   Count
    ----   -----
    0000    0001
    0001    0001
    0002    0001

Embedded GLock:

GLock address:           FFFFFFFF.7F23A040   Handle:         80000000.00000C09

  GLock name:            PLCKTBL_LOCK001     Flags:                         00
  Owner count:                          00   Owner node:                    00
  Node sequence:                      0000   Owner:                     000000
  IPL:                                  00   Previous IPL:                  00
  Wait bitmask:          00000000.00000000   Timeout:                 00000000
  Thread ID:             00000000.00000000

Attached GLocks:

GLock address:          P00000000.C05EC7C0   Handle:         00000001.000000F9

  GLock name:            CPU_BAL_LOCK        Flags:                         00
  Owner count:                          00   Owner node:                    00
  Node sequence:                      0000   Owner:                     000000
  IPL:                                  00   Previous IPL:                  00
  Wait bitmask:          00000000.00000000   Timeout:                 00000000
  Thread ID:             00000000.00000000

   .
   .
   .

GLock address:          P00000000.C05EC000   Handle:         00000001.00000001

  GLock name:            CPU_BAL_LOCK        Flags:                         00
  Owner count:                          00   Owner node:                    00
  Node sequence:                      0000   Owner:                     000000
  IPL:                                  00   Previous IPL:                  00
  Wait bitmask:          00000000.00000000   Timeout:                 00000000
  Thread ID:             00000000.00000000

Used GLock count = 0020

Free GLock count = 0060

Galaxy Lock Database: Process Lock Table Summary
------------------------------------------------

Total used Process Lock Tables:              00000001
Total free Process Lock Tables:              000003FF
This example shows the Galaxy locks for all processes.
4.47. SHOW GMDB
Displays the contents of the Galaxy Management Database (GMDB) and/or the node blocks of the instances in the Galaxy system.
Format
SHOW GMDB [/ALL]
[/NODE [=name | =n | /ADDRESS=n ] [/SUMMARY]
Parameters
None.
Qualifiers
- /ADDRESS
Specifies the address of a single node block to be displayed when used with the /NODE qualifier. See the description of the /NODE qualifier.
- /ALL
Displays the contents of the Galaxy Management Database and all node blocks that have ever been used (contents nonzero).
- /NODE [=name | =n | /ADDRESS=n]
Displays the contents of the specified node block, given by either the name of the instance, the partition number, or the address of the node block. If you specify only the /NODE qualifier, the node block for the current instance is displayed.
- /SUMMARY
Displays a one-page summary of the GMDB and all node blocks.
Note
The default action displays the contents of the Galaxy Management Database.
Examples
SDA> SHOW GMDB

Galaxy Management Database
-------------------------

Base address of GMDB:                        FFFFFFFF.7F234000
Base address of NODEB for this instance:     FFFFFFFF.7F236000

  Revision:                            1.0   Maximum node ID:         00000003
  Creation time:   31-MAR-1999 13:15:08.08   Incarnation:    00000000.00000003
  State:                       OPERATIONAL   Creator node:            00000001
  Base size:             00000000.00004000   Total size:     00000000.000A6000
  Last joiner ID:                 00000002   Remover node ID:         FFFFFFFF
  Last leaver ID:                 00000002   Node timeout (msec)          5000.
  Lock owner                      00000002   Lock flags:                  0000
  Break owner:                    FFFFFFFF   Breaker ID:              FFFFFFFF

Version Information:

  Min Version Operational              1.0   Min Version Allowed           1.0
  Max Version Operational              1.0

Membership bitmask:      FFFFFFFF.7F236800

  Valid bits:                     00000004   State:          00000000.0000001E  AUTO_LOCK TIMEOUT_CRASH....
  Unit count:                         0001   Unit size:               QUADWORD
  Lock IPL:                             16   Saved IPL:               00000008
  Count of bits set:              00000003
  Timeout count:                  000186A0
  Summary bitmask:       00000000.00000001

  Unit bitmask:
       ........ ........ ........ .......7   00000000

Remove node bitmask:     FFFFFFFF.7F236880

  Valid bits:                     00000004   State:          00000000.00000018  SUMMARY_BITS SET_COUNT
  Unit count:                         0001   Unit size:               QUADWORD
  Count of bits set:              00000000
  Summary bitmask:       00000000.00000000

  Unit bitmask:
       ........ ........ ........ .......0   00000000

Subfacility validation flags:     00000000

  Galaxy locks segment:  FFFFFFFF.7F238000   Length:         00000000.00082000
  Shared memory segment: FFFFFFFF.7F2BA000   Length:         00000000.0000A000
  CPU comms segment:     FFFFFFFF.7F2C4000   Length:         00000000.00014000
  CPU info segment:      FFFFFFFF.7F2D8000   Length:         00000000.00002000
  Membership segment:    FFFFFFFF.7F2DA000   Length:         (empty)

MMAP address:            FFFFFFFF.7F234200

  Level count:                        0000   Flags:                       0001  VALID
  Top page count:                 00000053   Virtual size:   00000000.000A6000
  PFN list page count:            00000000   First PFN:               00060000
  Data page count:                00000053
This example shows the overall summary of the Galaxy Management Database.
SDA> SHOW GMDB/NODE=0

GMDB: Node ID 00000000 (current instance)
-----------------------------------------

Base address of node block:                  FFFFFFFF.7F236000

  Version:                             1.0   Node name:                 ANDA1A
  Join time:       31-MAR-1999 14:11:09.08   Incarnation:    00000000.00000005
  State:                            MEMBER   Crash_all acknowledge:   00000000
  Validation done:                00000000   Reform done:             00000000

  IP interrupt mask:     00000000.00000000

Little brother:                   00000002   Heartbeat:      00000000.0019EAD1
Big brother:                      00000001   Last watched_node:       00000000

  Watched_node #0:       FFFFFFFF.7F236078   Node watched:            00000002
  Last heartbeat:        00000000.0017C1AD   Miss count:              00000000
This example shows Galaxy Management Database information for the specified instance.
4.48. SHOW GSD
Displays information contained in the global section descriptors.
Format
SHOW GSD [/ADDRESS=n | /ALL | /DELETED | /GLXGRP
| /GLXSYS | /GROUP | /SYSTEM]
Parameters
None.
Qualifiers
- /ADDRESS=n
Displays a specific global section descriptor entry, given its address.
- /ALL
Displays information in all the global section descriptors, that is, the system, group, and deleted global section descriptors, plus the Galaxy group and Galaxy system global section descriptors, if the system or dump being analyzed is a member of an OpenVMS Galaxy system. This qualifier is the default.
- /DELETED
Displays information in the deleted (that is, delete pending) global section descriptors.
- /GLXGRP
Displays information in the group global section descriptors of a Galaxy system.
- /GLXSYS
Displays information in the system global section descriptors of a Galaxy system.
- /GROUP
Displays information in the group global section descriptors.
- /SYSTEM
Displays information in the system global section descriptors.
Description
The SHOW GSD command displays information that resides in the global section descriptors. The table below shows the fields and their meaning.
| Field | Meaning |
|---|---|
| ADDRESS | Gives the address of the global section descriptor. |
| NAME | Gives the name of the global section. |
| GSTX | Gives the global section table index. |
| FLAGS | Gives the settings of flags for specified global section, as a hexadecimal number; also displays key flag bits by name. |
| BASEPFN 1 | Gives physical page frame number at which the section starts. This field applies only to PFN mapped global sections. |
| PAGES 1 | Gives number of pages (not pagelets) in section. This field applies only to PFN mapped global sections. |
| REFCNT 1 | Gives number of times this global section is mapped. This field applies only to PFN mapped global sections. |
Examples
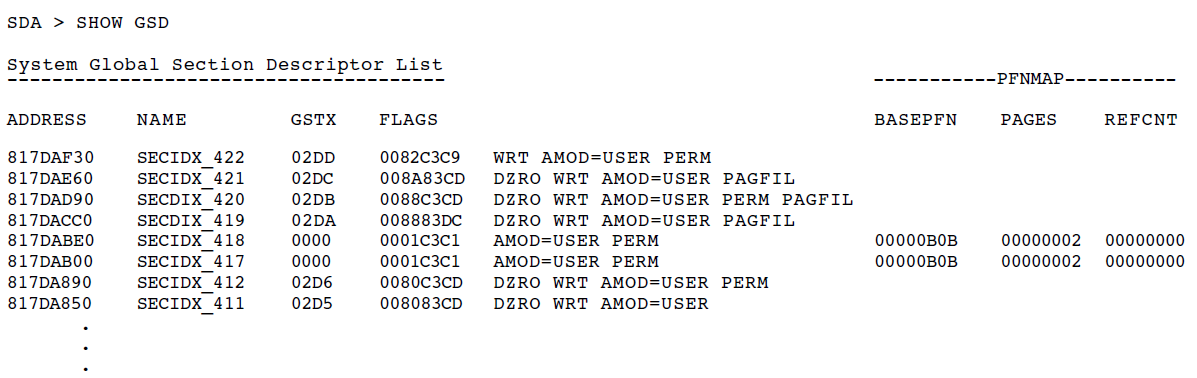
4.49. SHOW GST
See SHOW GLOBAL_SECTION_TABLE.
4.50. SHOW HEADER
Displays the header of the dump file.
Format
SHOW HEADER
Parameters
None.
Qualifiers
None.
Description
The SHOW HEADER command produces a 10-column display, each line of which displays both the hexadecimal and ASCII representation of the contents of the dump file header in 32-byte intervals. Thus, the first eight columns, when read right to left, represent the hexadecimal contents of 32 bytes of the header; the ninth column, when read left to right, records the ASCII equivalent of the contents. (The period [.] in this column indicates an ASCII character that cannot be displayed.)
After it displays the contents of the header blocks, the SHOW HEADER command displays the hexadecimal contents of the saved error log buffers.
See the OpenVMS AXP Internals and Data Structures manual for a discussion of the information contained in the dump file header. See also the SHOW DUMP and CLUE ERRLOG commands, which you can use to obtain formatted displays of the dump header and error log buffers.
See also the SHOW DUMP command, which will output a formatted display of the contents of the dump header.
Examples
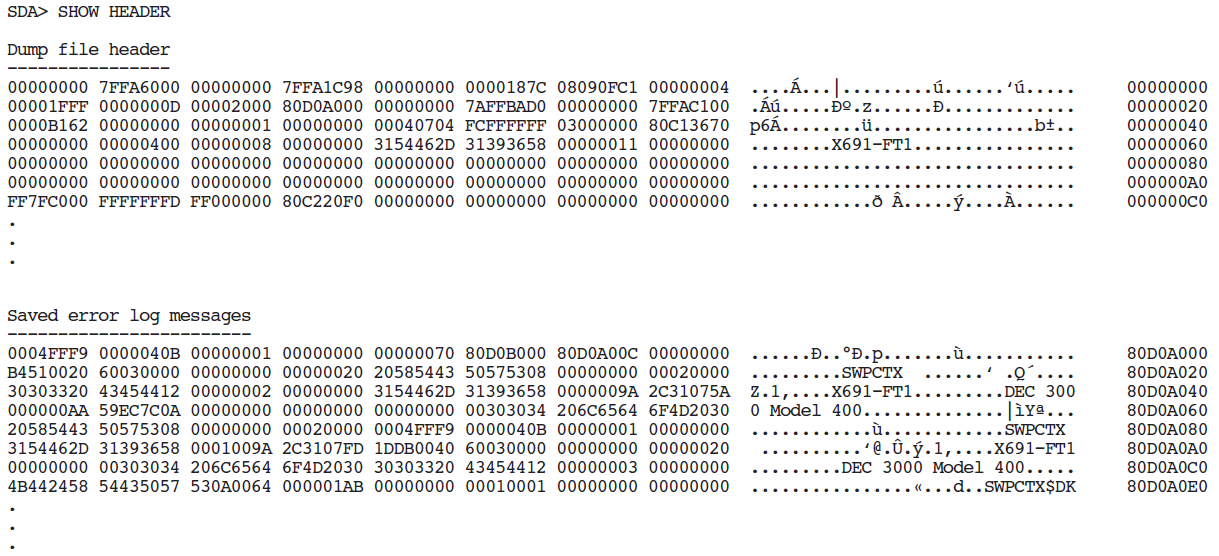
4.51. SHOW IMAGE
Displays information about an image, regardless of the type of image (executive, activated, or installed).
Format
SHOW IMAGE image-name
Parameters
- image-name
Name of the image to be displayed. This is a required parameter that may include wildcards.
Qualifiers
None.
Description
Searches the executive image list for the image name, and, if a match is found, displays the loaded image information. Next, searches the activated image list for the process (if SDA has a current process context). If a match is found, displays the activated image information. Finally, searches the installed image lists, directory by directory. If a match is found, displays the installed image (known file entry) information.
SHOW IMAGE x is equivalent to SHOW EXECUTIVE x followed by SHOW PROCESS/IMAGE=x followed by SHOW KFE x .
Examples
SDA> show image sys$public_vectors

Image SYS$PUBLIC_VECTORS
------------------------

                            VMS Executive image layout
                            --------------------------

Image                                   Base               End             Length       ImageOff  SymVec
--------------------------------- ----------------- ----------------- ----------------- -------- --------
SYS$PUBLIC_VECTORS                                                                               81804B18
    Nonpaged read only            FFFFFFFF.80000000 FFFFFFFF.800025FF 00000000.00002600 00000000
    Nonpaged read/write           FFFFFFFF.81800000 FFFFFFFF.81807FFF 00000000.00008000 00004000
        Linked 30-AUG-2004 09:36  LDRIMG 81C17480   SeqNum 00000000 --< sliced >--


                            Process activated images
                            ------------------------

   Image Name/Link Time/Section Type     Start     End    Type/File Id
--------------------------------------- -------- -------- ------------
SYS$PUBLIC_VECTORS                      81804B18 818071B7 GLBL

                        IMCB   Sym Vect Maj,Minor ID   Base     End    ImageOff
                      -------- -------- ------------ -------- -------- --------
                      7FF6A250 81804B18 113,16596271


                            Known File Entries
                            ------------------

KFD Device/Directory/Type: $31$DKB100:<SYS0.SYSCOMMON.SYSLIB>.EXE
-----------------------------------------------------------------

    KFE                   Image Name/                KFERES Address/       File ID/      Flags/
  Address                 Section Type                     Base              End        ImageOff
  --------  --------------------------------------- ----------------- ----------------- --------
  82984C50  SYS$PUBLIC_VECTORS;1                                      (3923,194,0)
This example shows the output from SHOW IMAGE for SYS$PUBLIC_VECTORS. Part of the example has been moved left to stay within page boundaries of the manual.
4.52. SHOW KFE
Displays information about known file entries (installed images).
Format
SHOW KFE [image_name | /ADDRESS=kfe_address | /ALL]
SHOW KNOWN_FILE_ENTRY [image_name | /ADDRESS=kfe_address |
            /ALL]
Parameters
- image-name
Name of the image to be displayed. This may include wildcards, but cannot include device or directory information.
Qualifiers
- /ADDRESS=kfe_address
Specifies the address of a single KFE of interest. The details are displayed for this KFE with device/directory information from the corresponding KFD (Known File Directory).
- /ALL
Displays details for all KFEs, including device/directory information from the corresponding KFDs, with the contents of the Known File Pointer Block (KFPB).
Description
The SHOW KFE command displays information about known files (installed images). By default, a summary line without image-section information is given for each image. Use the /ALL qualifier to obtain detailed information for all images. For a single image, specify the image name or KFE address.
The image_name parameter, the /ADDRESS, and /ALL qualifiers cannot be used together. SHOW KNOWN_FILE_ENTRY is a synonym for SHOW KFE.
Examples
SDA> SHOW KFE
Known File Entries
------------------

KFPB address:                 8292D860
Hash table address:           82975360
Hash table size:                  0080
Entry count:                      016F

KFD Device/Directory/Type: $31$DKB100:<SYS0.SYSCOMMON.CDE$DEFAULTS.SYSTEM.BIN>.EXE
---------------------------------------------------------

  KFD address:                829E8D60
  Reference count:                0002

    KFE     Image Name          KFERES Address    File ID         Flags
  --------  ------------------- ----------------- -------------   --------
  829E8290  DECW$LOGINOUT;1     (7204,49,0)       LIM Open HdrRes Shared
  829E8DB0  DTGREET;1           (5651,19,0)       Open HdrRes     Shared

KFD Device/Directory/Type: $31$DKB100:<SYS0.SYSCOMMON.SYSEXE>.EXE
-----------------------------------------------------------------

  KFD address:                8299C140
  Reference count:                0066

    KFE     Image Name                 KFERES Address       File ID       Flags
  --------  ------------------------ ----------------- ----------------- --------
  8299C210  AUTHORIZE;1                                (72,176,0)        ProcPriv AuthPriv
  829ACE10  BACKUP;1                                   (73,176,0)
  8299C2A0  CDU;1                                      (75,176,0)        ProcPriv Open HdrRes AuthPriv
  8299C660  CIA;1                                      (510,176,0)       ProcPriv AuthPriv
  829ACE90  CONVERT;1                                  (77,176,0)
  829A3AD0  COPY;1                   829A3E70          (78,176,0)        Open HdrRes Shared
  829ACF10  CREATE;1                                   (79,176,0)
  .
  .
  .
This example shows the first page of summary output for all known images.
SDA> show kfe decc*

Known File Entries
------------------

KFD Device/Directory/Type: $31$DKB100:<SYS0.SYSCOMMON.SYSLIB>.EXE
-----------------------------------------------------------------

    KFE          Image Name/               KFERES Address/       File ID/      Flags/
  Address        Section Type                    Base              End        ImageOff
  --------  ----------------------------- ----------------- ----------------- --------
  829900B0  DECC$SHR;1                    82990960          (2431,189,0)      LIM Open HdrRes
                                                                                       Shared ResCode

                Paged read only           FFFFFFFF.80A70000 FFFFFFFF.80C815FF 00000000
                Initialization            00000000.7BEC0000 00000000.7BF00DFF 00220000
                Fixup                     00000000.7BF10000 00000000.7BF1B1FF 00270000
                Nonpaged read/write       00000000.7BF20000 00000000.7BF2FBFF 00280000
                Nonpaged read/write       00000000.7BF30000 00000000.7BF309FF 00290000

                Fixup                     00000000.7BF40000 00000000.7BF401FF 002A0000
                Paged read/write          00000000.7BF50000 00000000.7BF56FFF 002B0000


KFD Device/Directory/Type: $31$DKB100:<SYS0.SYSCOMMON.SYSMSG>.EXE
-----------------------------------------------------------------

    KFE         Image Name/                KFERES Address/     File ID/ Flags/
  Address       Section Type                     Base            End    ImageOff
  --------  --------------------------------------- ------------ --- --------
  829AE4F0  DECC$MSG;1                                    (257,176,0)  LIM Open HdrRes Shared
This example shows the details for all images that match the wildcard DECC*.
4.53. SHOW KNOWN_FILE_ENTRY
See SHOW KFE.
4.54. SHOW LAN
Displays information contained in various local area network (LAN) data structures.
Format
SHOW LAN [/qualifier[,...]]
Parameters
None.
Qualifiers
- /ATM
Specifies that asynchronous transfer mode (ATM) information for the LAN be displayed.
- /CLIENT=name
Specifies that information be displayed for the specified client. Valid client designators are SCA, DECNET, LAT, MOPRC, TCPIP, DIAG, ELN, BIOS, LAST, USER, ARP, MOPDL, LOOP, BRIDGE, DNAME, ENCRY, DTIME, and LTM. The /CLIENT, /DEVICE, and /UNIT qualifiers are synonymous and mutually exclusive.
- /COUNTERS
Specifies that the LAN station block (LSB) and unit control block (UCB) counters be displayed.
- /CSMACD
Specifies that Carrier Sense Multiple Access with Collision Detect (CSMA/CD) information for the LAN be displayed. By default, both CSMA/CD and Fiber Distributed Data Interface (FDDI) information is displayed.
- /DEVICE=name
Specifies that information be displayed for the specified device, unit, or client. For each LAN adapter on the system, there is one device and multiple users of that device called, units or clients. Device designators are specified in the format XXdn, where XX is the type of device, d is the device letter, and n is the unit number. The device letter and unit number are optional. The first unit, which is always present, is the template unit. These are specified as indicated in this example for a DEMNA called EX:
/DEVICE=EX---display all EX devices on the system
/DEVICE=EXA---display the first EX device only
/DEVICE=EXA0---display the first EXA unit
/DEVICE=SCA---display SCA unit
/DEVICE=LAT---display LAT units
Valid client names are listed in the /CLIENT=name qualifier. The /CLIENT, /DEVICE, and /UNIT qualifiers are synonymous and mutually exclusive.
- /ELAN
Specifies information from an Emulated LAN (ELAN) that runs over an asynchronous transfer mode (ATM) network. The /ELAN qualifier displays the LAN Station Block (LSB) address, device state, and the LSB fields pertinent to an ELAN for both the parent ATM device and the ELAN pseudo-device drivers. It also specifies the name, description, parent device, state, and LAN emulation client (LEC) attributes of the ELAN.
The qualifier /ELAN used with the device qualifier (/ELAN/DEVICE=ELA) will only display information for the specified device or pseudo-device.
- /ERRORS
Specifies that the LSB and UCB error counters be displayed.
- /FDDI
Specifies that Fiber Distributed Data Interface (FDDI) information for the LAN be displayed. By default, both CSMA/CD and FDDI information is displayed.
- /FULL
Specifies that all information from the LAN, LSB, and UCB data structures be displayed.
- /INTERNAL
Specifies internal counters of the drivers by displaying the internal counters. If the /INTERNAL qualifier is used with the /DEVICE qualifier, the /INTERNAL specifies the internal counters of a specific driver.
- /QUEUES
Specifies a listing of all queues, whether their status is valid or invalid, and all elements of the queues. If the /QUEUES qualifier is used with the /DEVICE qualifier, the /QUEUES specifies a specific queue.
- /SOURCEROUTING
Specifies that the information in the source routing table maintained by the Token Ring driver be displayed.
- /SUMMARY
Specifies that only a summary of LAN information (a list of flags, LSBs, UCBs, and base addresses) be printed. This is the default.
- /TIMESTAMPS
Specifies that time information (such as start and stop times and error times) from the device and unit data structures be printed. SDA displays the data in chronological order.
- /TR
Specifies that Token Ring information for the LAN be displayed.
- /UNIT=name
Specifies that information be displayed for the specified unit. See the descriptions for /CLIENT=name and /DEVICE=name qualifiers.
- /VCI
Specifies that information be displayed for the VMS Communication Interface Block (VCIB) for each LAN device with an active VCI user. If you use the /VCI qualifier with the /DEVICE qualifier, the VCIB is only displayed for the specified device.
Description
The SHOW LAN command displays information contained in various local area network (LAN) data structures. By default, or when the /SUMMARY qualifier is specified, SHOW LAN displays a list of flags, LSBs, UCBs, and base addresses. When the /FULL qualifier is specified, SHOW LAN displays all information found in the LAN, LSB, and UCB data structures.
Examples
SDA> SHOW LAN/FULL LAN Data Structures ------------------- -- LAN Information Summary 23-MAY-1996 13:07:52 -- LAN flags: 00000004 LAN_INIT LAN block address 80DB7140 Timer DELTA time 10000000 Number of stations 2 DAT sequence number 1 LAN module version 1 First SVAPTE FFDF60F0 LANIDEF version 51 Number of PTEs 3 LANUDEF version 26 SVA of first page 8183C000 First LSB address 80DCA980 -- LAN CSMACD Network Management 23-MAY-1996 13:07:52 -- Creation time None Times created 0 Deletion time None Times deleted 0 Module EAB 00000000 Latest EIB 00000000 Port EAB 00000000 Station EAB 00000000 NM flags: 00000000 -- LAN FDDI Network Management 23-MAY-1996 13:07:52 -- Creation time None Times created 0 Deletion time None Times deleted 0 Module EAB 00000000 Link EAB 00000000 Port EAB 00000000 PHY port EAB 00000000 Station EAB 00000000 Module EIB 00000000 NM flags: 00000000 LAN Data Structures ------------------- -- ESA Device Information 23-MAY-1996 13:07:52 -- LSB address 80DCA980 Driver code address 80CAE838 Driver version 00000001.07010037 Device1 code address 00000000 Device1 version 00000000.00000000 Device2 code address 00000000 Device2 version 00000000.00000000 LAN code address 80CAFA00 LAN version 00000001.07010112 DLL type CSMACD Device name EY_NITC2 MOP name MXE MOP ID 94 HW serial Not supplied HW version 00000000 Promiscuous mode OFF Controller mode NORMAL Promiscuous UCB 00000000 Internal loopback OFF All multicast state OFF Hardware address 08-00-03-DE-00-12 CRC generation mode ON Physical address AA-00-04-00-88-FE Full Duplex Enable OFF Active unit count 1 Full Duplex State OFF Line speed 10 Flags: 00000000 Char: 00000000 Status: 00000003 RUN,INITED LAN Data Structures ------------------- -- ESA Device Information (cont) 23-MAY-1996 13:07:52 -- Put rcv ptr/index 00000000 Get rcv ptr/index 00000015 Put xmt ptr/index 80DCB620 Get xmt ptr/index 80DCB620 Put cmd ptr/index 00000000 Get cmd ptr/index 00000000 Put uns ptr/index 00000000 Get uns ptr/index 00000000 Put smt ptr/index 00000000 Get smt ptr/index 00000000 RBufs owned by dev 0 Rcv packet limit 32 XEnts owned by dev 0 XEnts owned by host 4 CEnts owned by dev 0 Transmit timer 0 UEnts owned by dev 0 Control timer 0 SEnts owned by dev 0 Periodic SYSID timer 599 Current rcv buffers 17 Ring unavail timer 0 Rqst MAX rcv buffers 32 USB timer 26 Rqst MIN rcv buffers 16 Receive alignment 0 Curr MAX rcv buffers 32 Receive buffer size 1518 Curr MIN rcv buffers 16 Min 1st chain segment 0 FILL rcv buffers 16 Min transmit length 0 ADD rcv buffers 32 Dev xmt header size 0 LAN Data Structures ------------------- -- ESA Device Information (cont) 23-MAY-1996 13:07:52 -- Last receive 23-MAY 13:07:51 Last transmit 23-MAY 13:07:50 ADP address 80D4B280 IDB address 80DCA880 DAT stage 00000000 DAT xmt status 0000003C.003C0001 DAT number started 1 DAT xmt complete 23-MAY 13:07:19 DAT number failed 0 DAT rcv found None DAT VCRP 80DCBB80 DAT UCB 00000000 Mailbox enable flag 0 CRAM read comman 00000000 CSR base phys addr 00000000.00000000 CRAM write comma 00000000 Mailboxes in use 0 Media UNDF 2nd LW status flags 00000000 LAN Data Structures ------------------- -- ESA Network Management Information 23-MAY-1996 13:07:52 -- Creation time None Create count 0 Deletion time None Enable count 0 Enabled time None Number of ports 0 Disabled time None Events logged 0 EIB address 00000000 NMgmt assigned addr None LLB address 00000000 Station name itmlst 00000000 LHB address 00000000 Station itmlst len 0 First LPB address 00000000 LAN Data Structures ------------------- -- ESA Fork Information 23-MAY-1996 13:07:52 -- ISR FKB sched 23-MAY 13:07:51 ISR FKB in use flag FREE ISR FKB time 23-MAY 13:07:51 ISR FKB count 200 IPL8 FKB sched 23-MAY 13:07:20 IPL8 FKB in use flag FREE IPL8 FKB time 23-MAY 13:07:20 IPL8 FKB count 1 RESET FKB sched None RESET FKB in use flag FREE RESET FKB time None RESET FKB count 0 NM FKB sched None NM FKB in use flag FREE NM FKB time None NM FKB count 0 Fork status code 0 LAN Data Structures ------------------- -- ESA Queue Information 23-MAY-1996 13:07:52 -- Control hold queue 80DCACF0 Status: Valid, empty Control request queue 80DCACF8 Status: Valid, empty Control pending queue 80DCAD00 Status: Valid, empty Transmit request queue 80DCACE8 Status: Valid, empty Transmit pending queue 80DCAD18 Status: Valid, empty Receive buffer list 80DCAD38 Status: Valid, 17 elements Receive pending queue 80DCAD20 Status: Valid, empty Post process queue 80DCAD08 Status: Valid, empty Delay queue 80DCAD10 Status: Valid, empty Auto restart queue 80DCAD28 Status: Valid, empty Netwrk mgmt hold queue 80DCAD30 Status: Valid, empty -- ESA Multicast Address Information 23-MAY-1996 13:07:52 -- AB-00-00-04-00-00 -- ESA Unit Summary 23-MAY-1996 13:07:52 -- UCB UCB Addr Fmt Value Client State --- -------- --- ----- ------ ----------- ESA0 80D4F6C0 ESA1 80E35400 Eth 60-03 DECNET 0017 STRTN,LEN,UNIQ,STRTD LAN Data Structures ------------------- -- ESA Counters Information 23-MAY-1996 13:07:52 -- Octets received 596 Octets sent 230 PDUs received 8 PDUs sent 5 Mcast octets received 596 Mcast octets sent 138 Mcast PDUs received 8 Mcast PDUs sent 3 Unrec indiv dest PDUs 0 PDUs sent, deferred 0 Unrec mcast dest PDUs 1 PDUs sent, one coll 0 Data overruns 0 PDUs sent, mul coll 0 Unavail station buffs 0 Excessive collisions 0 Unavail user buffers 0 Late collisions 0 CRC errors 0 Carrier check failure 0 Alignment errors 0 Last carrier failure None Rcv data length err 0 Coll detect chk fail 5 Frame size errors 0 Short circuit failure 0 Frames too long 0 Open circuit failure 0 Seconds since zeroed 34 Transmits too long 0 Station failures 0 Send data length err 0 LAN Data Structures ------------------- -- ESA Counters Information (cont) 23-MAY-1996 13:07:52 -- No work transmits 0 Ring avail transitions 0 Buffer_Addr transmits 0 Ring unavail transitions 0 SVAPTE/BOFF transmits 0 Loopback sent 0 Global page transmits 0 System ID sent 0 Bad PTE transmits 0 ReqCounters sent 0 Restart pending counter 0 Internal counters size 40 +00 MCA not enabled 187 +2C Generic (or unused) 00000000 +04 Xmt underflows 0 +30 Generic (or unused) 00000000 +08 Rcv overflows 0 +34 Generic (or unused) 00000000 +0C Memory errors 0 +38 Generic (or unused) 80DCAD18 +10 Babbling errors 0 +3C Generic (or unused) 80DCAD18 +14 Local buffer errors 0 +40 Generic (or unused) 004E0840 +18 LANCE interrupts 202 +44 Generic (or unused) 61616161 +1C Xmt ring <31:0> 00000000 +48 Generic (or unused) 61616161 +20 Xmt ring <63:32> 00000000 +4C Generic (or unused) 61616161 +24 Soft errors handled 0 +50 Generic (or unused) 61616161 +28 Generic (or unused) 00000000 +54 Generic (or unused) 61616161 LAN Data Structures ------------------- -- ESA Error Information 23-MAY-1996 13:07:52 -- Fatal error count 0 Last error CSR 00000000 Fatal error code None Last fatal error None Prev error code None Prev fatal error None Transmit timeouts 0 Last USB time None Control timeouts 0 Last UUB time None Restart failures 0 Last CRC time None Power failures 0 Last CRC srcadr None Bad PTE transmits 0 Last length erro None Loopback failures 0 Last exc collisi None System ID failures 0 Last carrier fai None ReqCounters failures 0 Last late collis None LAN Data Structures ------------------- -- ESA0 Template Unit Information 23-MAY-1996 13:07:52 -- LSB address 80DCA980 Error count 0 VCIB address 00000000 Parameter mask 00000000 Stop IRP address 00000000 Promiscuous mode OFF Restart IRP address 00000000 All multicast mode OFF LAN medium CSMACD Source Routing mode TRANSPARENT Packet format Ethernet Access mode EXCLUSIVE Eth protocol type 00-00 Shared user DES None 802E protocol ID 00-00-00-00-00 Padding mode ON 802.2 SAP 00 Automatic restart DISABLED 802.2 Group SAPs 00,00,00,00 Allow prom client ON Controller mode NORMAL Can change address OFF Internal loopback OFF 802.2 service User CRC generation mode ON Rcv buffers to save 1 Functional Addr mod ON Minimum rcv buffers 4 Hardware address 08-00-03-DE-00-12 User transmit FC/AC ON Physical address FF-FF-FF-FF-FF-FF User receive FC/AC OFF LAN Data Structures ------------------- -- ESA1 60-03 (DECNET) Unit Information 23-MAY-1996 13:07:52 -- LSB address 80DCA980 Error count 0 VCIB address 00000000 Parameter mask 00DA8695 Stop IRP address 80E047C0 Promiscuous mode OFF Restart IRP address 00000000 All multicast mode OFF LAN medium CSMACD Source Routing mode TRANSPARENT Packet format Ethernet Access mode EXCLUSIVE Eth protocol type 60-03 Shared user DES None 802E protocol ID 00-00-00-00-00 Padding mode ON 802.2 SAP 00 Automatic restart DISABLED 802.2 Group SAPs 00,00,00,00 Allow prom client ON Controller mode NORMAL Can change address OFF Internal loopback OFF 802.2 service User CRC generation mode ON Rcv buffers to save 10 Functional Addr mod ON Minimum rcv buffers 4 Hardware address 08-00-03-DE-00-12 User transmit FC/AC ON Physical address AA-00-04-00-88-FE User receive FC/AC OFF LAN Data Structures ------------------- -- ESA1 60-03 (DECNET) Unit Information (cont) 23-MAY-1996 13:07:52 -- Last receive 23-MAY 13:07:47 Starter's PID 0001000F Last transmit 23-MAY 13:07:50 Maximum header size 16 Last start attempt 23-MAY 13:07:20 Maximum buffer size 1498 Last start done 23-MAY 13:07:20 Rcv quota charged 15040 Last start failed None Default FC value 00 MCA match enabled 01 Default AC value 00 Last MCA filtered AB-00-00-04-00-00 Maintenance state ON UCB status: 00000017 STRTN,LEN,UNIQ,STRTD Receive IRP queue 80E356E8 Status: Valid, 1 element Receive pending queue 80E356E0 Status: Valid, empty Multicast address table, embedded: AB-00-00-04-00-00 LAN Data Structures ------------------- -- ESA1 60-03 (DECNET) Counters Information 23-MAY-1996 13:07:52 -- Octets received 483 Octets sent 180 PDUs received 7 PDUs sent 3 Mcast octets received 483 Mcast octets sent 180 Mcast PDUs received 7 Mcast PDUs sent 3 Unavail user buffer 0 Multicast not enabled 0 Last UUB time None User buffer too small 0The SHOW LAN/FULL command displays information for all LAN, LSB, and UCB data structures.
SDA>  SHOW LAN/TIME
               -- LAN History Information 12-FEB-1995 11:08:48 --
12-FEB 11:08:47.92  ESA               Last receive
12-FEB 11:08:47.92  ESA               Last fork scheduled
12-FEB 11:08:47.92  ESA               Last fork time
12-FEB 11:08:47.77  ESA5     LAST     Last receive
12-FEB 11:08:47.72  ESA3     LAT      Last receive
12-FEB 11:08:41.25  ESA               Last transmit
12-FEB 11:08:41.25  ESA5     LAST     Last transmit
12-FEB 11:08:40.02  ESA2     DECnet   Last receive
12-FEB 11:08:39.14  ESA2     DECnet   Last transmit
12-FEB 11:08:37.39  ESA3     LAT      Last transmit
12-FEB 10:19:25.31  ESA               Last unavail user buffer
12-FEB 10:19:25.31  ESA2     DECnet   Last unavail user buffer
11-FEB 14:10:20.09  ESA5     LAST     Last start completed
11-FEB 14:10:02.16  ESA3     LAT      Last start completed
11-FEB 14:09:58.44  ESA2     DECnet   Last start completed
11-FEB 14:09:57.44  ESA               Last DAT transmit
The SHOW LAN/TIME command displays print time information from device and unit data structures.
SDA> SHOW LAN/VCI/DEVICE=ICB
               -- ICB VCI Information 17-APR-1996 14:22:07 --
LSB address  = 80A1D580
Device state = 00000003 RUN,INITED
         -- ICB2 80-41 (LAST) VCI Information 17-APR-1996 14:22:07 --
VCIB address =    8096F238
CLIENT flags:     00000001 RCV_DCB
LAN flags:        00000004 LAN_INIT
DLL flags:        00000005 XMT_CHAIN,PORT_STATUS
UCB status:       00000015 STRTN,UNIQ,STRTD
VCI ID                         LAST    VCI version               00010001
UCB address                80A4C5C0    DP VCRP address           00000000
Hardware address  00-00-93-08-52-CF    LDC address               80A1D720
Physical address  00-00-93-08-52-CF    LAN medium                      TR
Transmit available         80A1D670    Outstanding operations           0
Maximum receives                  0    Outstanding receives             0
Max xmt size                   4444    Header size                     52
Build header rtn           808BF230    Report event rtn          86327130
XMT initiate rtn           808BF200    Transmit complete rtn     86326D80
XMT frame rtn              808BF210    Receive complete rtn      86326A80
      -- ICB2 80-41 (LAST) VCI Information (cont) 17-APR-1996 14:22:07 --
Portmgmt initiate rtn      808BF0C0    Portmgmt complete rtn     86327100
Monitor request rtn        00000000    Monitor transmit rtn      00000000
Monitor flags              00000000    Monitor receive rtn       00000000
Port usable                00000000    Port unusable             00000000
The SHOW LAN/VCI/DEVICE=ICB command displays the VCIB for a Token Ring device (ICB) that has an active VCI user (LAST).
SDA> SHOW LAN/ELAN
        -- HCA Emulated LAN LSB Information 17-APR-1996 14:08:02 --
LSB address = 8098D200
Device state = 00000101 RUN,RING_AVAIL
Driver CM VC setup adr   808986A0    Driver CM VC teardown adr    80898668
NIPG CM handle adr       8096C30C    NIPG CM SVC handle           00000000
NIPG CM agent handle adr 809B364C    NIPG CM mgr lineup handle    809B394C
NIPG CM ILMI IO handle   809B378C    MIB II handle adr            809B94CC
MIB handle adr           809B3ACC    Queue header for EL LSBs     00000000
DEC MIB handle adr       809BBD8C    NIPG current TQEs used       00000000
Count of allocated TQEs  0000000D    NIPG current pool used       0000D2C0
NIPG pool allocations    00075730
        -- ELA Emulated LAN LSB Information 17-APR-1996 14:08:02 --
LSB address = 80AB08C0
Device state = 00000001 RUN
ELAN name = ELAN 1
ELAN description = ATM ELAN
ELAN parent = HCA0
ELAN state = 00000001 ACTIVE
MAX transmit size     MTU_1516          ELAN media type      LAN_802_3
LEC attr buff adr     80AB1FC0          LEC attr buff size    00000328
Event mask            00000000          PVC identifer         00000000
Extended sense        00000000
         -- ELA Emulated LAN LEC Attributes 17-APR-1996 14:08:02 --
LAN type          00000000          LAN MTU              00000001
Proxy flag        00000000          Control timeout      0000000A
Max UF count      00000001          Max UF time          00000001
VCC timeout       000004B0          Max retry count      00000002
LEC id            00000002          Forw delay time      0000000F
Flush timeout     00000004          Path switch delay    00000006
SM state          00000070          Illegal CTRL frames  00000000
CTRL xmt failures 00000000          CTRL frames sent     0000000C
CTRL frames_rcvd  00000012          LEARPs sent          00000000
LEARPS rcvd       00000000          UCASTs sent direct   00000000
UCASTs flooded    00000006          UCASTs discarded     00000001
NUCASTs sent      00000000
Local ESI         00000000.00000000
BUS ATM addr      3999990000000008002BA57E80.AA000302FF12.00
LES ATM addr      3999990000000008002BA57E80.AA000302FF14.00
My ATM addr       3999990000000008002BA57E80.08002B2240A0.00
The SHOW LAN/ELAN command displays information for the parent ATM device (HCA) driver and the ELAN pseudo-device (ELA) driver.
SDA> SHOW LAN/ELAN/DEV=ELA
        -- ELA Emulated LAN LSB Information 17-APR-1996 14:08:22 --
LSB address = 80AB08C0
Device state = 00000001 RUN
ELAN name = ELAN 1
ELAN description = ATM ELAN
ELAN parent = HCA0
ELAN state = 00000001 ACTIVE
MAX transmit size     MTU_1516          ELAN media type      LAN_802_3
LEC attr buff adr     80AB1FC0          LEC attr buff size    00000328
Event mask            00000000          PVC identifer         00000000
Extended sense        00000000
         -- ELA Emulated LAN LEC Attributes 17-APR-1996 14:08:22 --
LAN type             00000000          LAN MTU              00000001
Proxy flag           00000000          Control timeout      0000000A
Max UF count         00000001          Max UF time          00000001
VCC timeout          000004B0          Max retry count      00000002
LEC id               00000002          Forw delay time      0000000F
Flush timeout        00000004          Path switch delay    00000006
SM state             00000070          Illegal CTRL frames  00000000
CTRL xmt failures    00000000          CTRL frames sent     0000000C
CTRL frames_rcvd     00000012          LEARPs sent          00000000
LEARPS rcvd          00000000          UCASTs sent direct   00000000
UCASTs flooded       00000006          UCASTs discarded     00000001
NUCASTs sent         00000000
Local ESI            00000000.00000000
BUS ATM addr         3999990000000008002BA57E80.AA000302FF12.00
LES ATM addr         3999990000000008002BA57E80.AA000302FF14.00
My ATM addr          3999990000000008002BA57E80.08002B2240A0.00
The SHOW LAN/ELAN/DEVICE=ELA command displays information for the ELAN pseudo-device (ELA) driver only.
SDA>  SHOW LAN/ELAN/DEVICE=HCA
       -- HCA Emulated LAN LSB Information 17-APR-1996 14:08:25 --
LSB address = 8098D200
Device state = 00000101 RUN,RING_AVAIL
Driver CM VC setup adr   808986A0    Driver CM VC teardown adr    80898668
NIPG CM handle adr       8096C30C    NIPG CM SVC handle           00000000
NIPG CM agent handle adr 809B364C    NIPG CM mgr lineup handle    809B394C
NIPG CM ILMI IO handle   809B378C    MIB II handle adr            809B94CC
MIB handle adr           809B3ACC    Queue header for EL LSBs     00000000
DEC MIB handle adr       809BBD8C    NIPG current TQEs used       00000000
Count of allocated TQEs  0000000D    NIPG current pool used       0000D2C0
NIPG pool allocations    000757B2
The SHOW LAN/ELAN/DEVICE=HCA command displays information for the ATM device (HCA) driver only.
4.55. SHOW LOCKS
Displays information about all lock management locks in the system, or about a specified lock.
Format
SHOW LOCKS [ lock-id
| /ADDRESS=n
| /ALL (d)
| /BRIEF
| /BLOCKING
| /CACHED
| /CONVERT
| /GRANTED
| /NAME=name
| /STATUS=(keyword[,...])
| /WAITING ] or SHOW LOCKS {/POOL | /SUMMARY}
Parameters
- lock-id
Name of a specific lock.
Qualifiers
- /ADDRESS=n
Displays a specific lock, given the address of the lock block.
- /ALL
Lists all locks that exist in the system. This is the default behavior of the SHOW LOCKS command.
- /BLOCKING
Displays only the locks that have a blocking AST specified or attached.
- /BRIEF
Displays a single line of information for each lock.
- /CACHED
Displays locks that are no longer valid. The memory for these locks is saved so that later requests for locks can use them. Cached locks are not displayed in the other SHOW LOCKS commands.
- /CONVERT
Displays only the locks that are on the conversion queue.
- /GRANTED
Displays only the locks that are on the granted queue.
- /NAME=name
Displays all locks on the specified resource. Name can be the actual name of the resource, if it only contains uppercase letters, numerals, the underscore (_), dollar sign, colon (:), and some other printable characters, as for example, /NAME=MY_LOCK. If it contains other printable characters (including lowercase letters), you may need to enclose the name in quotation marks (""), as for example, /NAME="My_Lock/47". If it contains nonprintable characters, you can specify the name as a comma-separated list comprised of strings and hexadecimal numbers. For example, /NAME=("My_Lock",0C00,"/47") would specify the name "My_Lock<NUL><FF>/47". The hexadecimal number can be no more than 8 digits (4 bytes) in length. Nonprintable sequences of more than 4 bytes must be split into multiple hexadecimal numbers. The maximum length of a resource name is 32 characters.
- /POOL
Displays the lock manager's poolzone information, which contains the lock blocks (LKB) and resource blocks (RSB).
- /STATUS=(keyword[,...])
Displays only the locks that have the specified status bits set in the LKB$L_STATUS field. If you specify only one keyword, you can omit the parentheses. Status keywords are as follows:
Keyword Meaning 2PC_IP Indicates a two-phase operation in progress 2PC_PEND Indicates a two-phase operation pending ASYNC Completes request asynchronously BLKASTFLG Specifies a blocking AST BLKASTQED Indicates a blocking AST is queued BRL Indicates a byte range lock CACHED Indicates a lock block in cache CVTSUBRNG Indicates a sub-range convert request CVTTOSYS Converts back to system-owned lock DBLKAST Delivers a blocking AST DCPLAST Delivers a completion AST DPC Indicates a delete pending cache lock FLOCK Indicates a fork lock GRSUBRNG Grants sub-range lock IP Indicates operation in process MSTCPY Indicates a lock block is a master copy NEWSUBRNG Indicates a new sub-range request NOQUOTA Does not charge quota PCACHED Indicates lock block needs to be cached PROTECT Indicates a protected lock RESEND Resends during failover RM_RBRQD Requires remaster rebuild RNGBLK Specifies a range block RNGCHG Indicates a changing range TIMOUTQ Indicates lock block is on timeout queue VALBLKRD Indicates read access to lock value block VALBLKWRT Indicates write access to lock value block WASSYSOWN Indicates was system-owned lock - /SUMMARY
Displays summary data and performance counters.
- /WAITING
Displays only the waiting locks.
Description
The SHOW LOCKS command displays the information described in the table below for each lock management lock in the system, or for the lock indicated by lock-id, an address or name. (Use the SHOW SPINLOCKS command to display information about spinlocks.) You can obtain a similar display for the locks owned by a specific process by issuing the appropriate SHOW PROCESS/LOCKS command. See the VSI OpenVMS Programming Concepts Manual for additional information.
You can display information about the resource to which a lock is queued by issuing the SHOW RESOURCES command specifying the resource's lock-id.
| Display Element | Description |
|---|---|
| Process Index | Index in the PCB array to a pointer to the process control block (PCB) of the process that owns the lock. This display element is produced only by the SHOW PROCESS/LOCKS command. |
| Name | Name of the process that owns the lock. This display element is produced only by the SHOW PROCESS/LOCKS command. |
| Extended PID | Clusterwide identification of the process that owns the lock. This display element is produced only by the SHOW PROCESS/LOCKS command. |
| Lock ID | Identification of the lock. |
| PID | Systemwide identification of the lock. |
| Flags | Information specified in the request for the lock. |
| Par. ID | Identification of the lock's parent lock. |
| Sublocks | Count of the locks that the lock owns. |
| LKB | Address of the lock block (LKB). If a blocking AST has been enabled for this lock, the notation "BLKAST" appears next to the LKB address. |
| Priority | The lock priority. |
| Granted at | Lock mode at which the lock was granted. |
| RSB | Address of the resource block. |
| Resource | Dump of the resource name. The two leftmost columns of the dump show its contents as hexadecimal values, the least significant byte being represented by the rightmost two digits. The rightmost column represents its contents as ASCII text, the least significant byte being represented by the leftmost character. |
| Status | Status of the lock, information used internally by the lock manager. |
| Length | Length of the resource name. |
| Mode | Processor access mode of the namespace in which the resource block (RSB) associated with the lock resides. |
| Owner | Owner of the resource. Certain resources owned by the operating system list "System" as the owner. Resources owned by a group have the number (in octal) of the owning group in this field. |
| Copy | Indication of whether the lock is mastered on the local system or is a process copy. |
Examples
SDA>  SHOW LOCKS
Lock Database
-------------

Lock id:  3E000002            PID:    00000000   Flags: CONVERT NOQUEUE SYNCSTS
Par. id:  00000000            SUBLCKs:       0          NOQUOTA CVTSYS
LKB:      FFFFFFFF.7DF48150   BLKAST: 81107278
Priority:     0000

Granted at    CR   00000000-FFFFFFFF

RSB:               FFFFFFFF.7DF68D50
Resource:          494D6224 42313146  F11B$bMI  Status: NOQUOTA VALBLKR VALBLKW
 Length   18       4D55445F 5944414C  LADY_DUM
 Kernel mode       00000000 00005350  PS......
 System            00000000 00000000  ........

Local copy

Lock Database
-------------

Lock id:  3F000003            PID:    00000000   Flags: VALBLK  CONVERT SYNCSTS
Par. id:  0100007A            SUBLCKs:       0          CVTSYS
LKB:      FFFFFFFF.7DF48250   BLKAST: 00000000
Priority:     0000

Granted at    NL   00000000-FFFFFFFF

RSB:               FFFFFFFF.7DF51D50
Resource:          01F77324 42313146  F11B$s÷.  Status: NOQUOTA VALBLKR VALBLKW
 Length   10       00000000 00000000  ........
 Kernel mode       00000000 00000000  ........
 System            00000000 00000000  ........

Local copy

Lock Database
-------------

Lock id:  0A000004            PID:    0001000F   Flags: VALBLK  CONVERT SYNCSTS
Par. id:  00000000            SUBLCKs:       0          SYSTEM  NODLCKW NODLCKB
LKB:      FFFFFFFF.7DF48350   BLKAST: 81190420          QUECVT
Priority:     0000

Granted at    EX   00000000-FFFFFFFF

RSB:               FFFFFFFF.7DF50850
Resource:          004F0FDF 24534D52  RMS$ß.O.  Status: VALBLKR VALBLKW
 Length   26       5F313039 58020000  ...X901_
 Exec. mode        00202020 204C354B  K5L    .
 System            00000000 00000000  ........

Local copy

   .
   .
   .
SDA>  SHOW RESOURCES/LOCKID=0A000004
Resource Database
-----------------
RSB:         FFFFFFFF.7DF50850  GGMODE:     EX  Status: DIRENTR VALID
Parent RSB:  00000000.00000000  CGMODE:     EX
Sub-RSB count:      0           FGMODE:     EX
Lock Count:         1           RQSEQNM:  0000
BLKAST count:       1           CSID: 00000000  (MILADY)

Resource:          004F0FDF 24534D52  RMS$ß.O.  Valblk: 00000000 00000000
 Length   26       5F313039 58020000  ...X901_          00000000 00000000
 Exec. mode        00202020 204C354B  K5L    .
 System            00000000 00000000  ........  Seqnum: 00000000

Granted queue (Lock ID / Gr mode / Range):
 0A000004  EX 00000000-FFFFFFFF

Conversion queue (Lock ID / Gr mode / Range -> Rq mode / Range):
     *** EMPTY QUEUE ***

Waiting queue (Lock ID / Rq mode / Range):
     *** EMPTY QUEUE ***
This SDA session shows the output of the SHOW LOCKS command for several locks. The SHOW RESOURCES command, executed for the last displayed lock, verifies that the lock is in the resource's granted queue. (See Table 4-26 for a full explanation of the contents of the display of the SHOW RESOURCES command.)
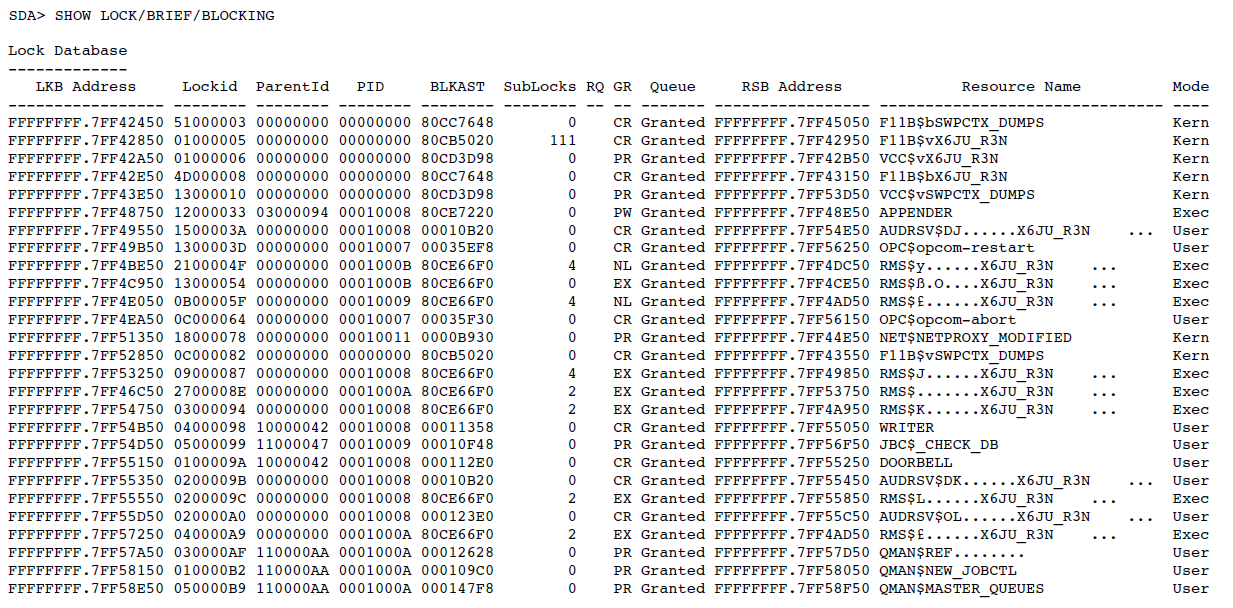
This example shows the brief display for all locks with a blocking AST.
4.56. SHOW MACHINE_CHECK
Displays the contents of the stored machine check frame. This command is valid for the DEC 4000 Alpha, DEC 7000 Alpha, and DEC 10000 Alpha computers only.
Format
SHOW MACHINE_CHECK [/FULL] [cpu-id]
Parameters
- cpu-id
Numeric value indicating the identity of the CPU for which context information is to be displayed. This parameter changes the SDA current CPU (the default) to the CPU specified with cpu-id. If you specify the cpu-id of a processor that was not active at the time of the system failure, SDA displays the following message:
%SDA-E-CPUNOTVLD, CPU not booted or CPU number out of range
If you use the cpu-id parameter, the SHOW MACHINE_CHECK command performs an implicit SET CPU command, making the CPU indicated by cpu-id the current CPU for subsequent SDA commands. (See the description of the SET CPU command and Section 2.5, ''SDA Context'' for information on how this can affect the CPU context---and process context---in which SDA commands execute.)
Qualifiers
- /FULL
Specifies that a detailed version of the machine check information be displayed. This is currently identical to the default summary display.
Description
The SHOW MACHINE_CHECK command displays the contents of the stored machine check frame. A separate frame is allocated at boot time for every CPU in a multiple-CPU system. This command is valid for the DEC 4000 Alpha, DEC 7000 Alpha, and DEC 10000 Alpha computers only.
If you do not specify a qualifier, a summary version of the machine check frame is displayed.
The default cpu-id is the SDA current CPU.
Examples
SDA> SHOW MACHINE_CHECK
CPU 00 Stored Machine Check Crash Data
--------------------------------------
Processor specific information:
-------------------------------
Exception address:    FFFFFFFF.800B0250    Exception Summary:  00000000.00000000
Pal base address:     00000000.00008000    Exception Mask:     00000000.00000000
HW Interrupt Request: 00000000.00000342    HW Interrupt Ena:   00000001.FFC01CE0
MM_CSR                00000000.00003640    ICCSR:              00000002.381F0000
D-cache address:      00000007.FFFFFFFF    D-cache status:     00000000.000002E0
BIU status:           00000000.00000050    BIU address [7..0]: 00000000.000060E0
BIU control:          00000008.50006447    Fill Address:       00000000.00006120
Single-bit syndrome:  00000000.00000000    Processor mchck VA: 00000000.00006190
A-box control:        00000000.0000040E    B-cache TAG:        00106100.83008828
System specific information:
----------------------------
Garbage bus info:     00200009 00000038    Device type:                 000B8001
LCNR:                          00000001    Memory error:                00000000
LBER:                          00000009    Bus error synd 0,1: 00000000 00000000
Bus error cmd:        00048858 00AB1C88    Bus error synd 2,3: 00000000 0000002C
LEP mode:                      00010010    LEP lock address:            00041108
The SHOW MACHINE_CHECK command in this SDA display shows the contents of the stored machine check frame.
SDA> SHOW MACHINE_CHECK 1
CPU 01 Stored Machine Check Crash Data
--------------------------------------
Processor specific information:
-------------------------------
Exception address:    FFFFFFFF.800868A0    Exception Summary:  00000000.00000000
Pal base address:     00000000.00008000    Exception Mask:     00000000.00000000
HW Interrupt Request: 00000000.00000342    HW Interrupt Ena:   00000000.1FFE1CE0
MM_CSR                00000000.00005BF1    ICCSR:              00000000.081F0000
D-cache address:      00000007.FFFFFFFF    D-cache status:     00000000.000002E0
BIU status:           00000000.00000050    BIU address [7..0]: 00000000.000063E0
BIU control:          00000008.50006447    Fill Address:       00000000.00006420
Single-bit syndrome:  00000000.00000000    Processor mchck VA: 00000000.00006490
A-box control:        00000000.0000040E    B-cache TAG:        35028EA0.50833828
System specific information:
----------------------------
Garbage bus info:     00210001 00000038    Device type:                 000B8001
LCNR:                          00000001    Memory error:                00000080
LBER:                          00040209    Bus error synd 0,1: 00000000 00000000
Bus error cmd:        00048858 00AB1C88    Bus error synd 2,3: 00000000 0000002C
LEP mode:                      00010010    LEP lock address:            00041108
The SHOW MACHINE_CHECK command in this SDA display shows the contents of the stored machine check frame for cpu-id 01.
4.57. SHOW MEMORY
Displays the availability and usage of memory resources.
Format
SHOW MEMORY [/ALL][/BUFFER_OBJECTS][/CACHE][/FILES]
[/FULL][/GH_REGIONS][/PHYSICAL_PAGES][/POOL]
[/RESERVED][/SLOTS]
Parameters
None.
Qualifiers
- /ALL
Displays all available information, that is, information displayed by the following qualifiers:
/BUFFER_OBJECTS
/CACHE
/FILES
/GH_REGIONS
/PHYSICAL_PAGES
/POOL
/RESERVED
/SLOTS
This is the default display.
- /BUFFER_OBJECTS
Displays information about system resources used by buffer objects.
- /CACHE
Displays information about either the Virtual I/O Cache facility or the Extended File Cache facility. The system parameter VCC_FLAGS determines which is used. The cache facility information is displayed as part of the SHOW MEMORY and SHOW MEMORY/CACHE/FULL commands.
- /FILES
Displays information about the use of each paging and swapping file currently installed.
- /FULL
When used with the /POOL and /CACHE qualifiers, displays additional information. This qualifier is ignored otherwise. For /CACHE, the additional information is only displayed when the Virtual I/O Cache facility is in use (Alpha only); /FULL is ignored if the Extended File Cache facility is in use. Additional information on how memory is being used by the Extended File Cache facility can be obtained using the XFC extension described in Chapter 9.
- /GH_REGIONS
Displays information about the granularity hint regions (GHR) that have been established. For each of these regions, information is displayed about the size of the region, the amount of free memory, the amount of memory in use, and the amount of memory released to OpenVMS from the region. The granularity hint regions information is also displayed as part of SHOW MEMORY and SHOW MEMORY/ALL commands.
- /PHYSICAL_PAGES
Displays information about the amount of physical memory and the number of free and modified pages.
- /POOL
Displays information about the usage of each dynamic memory (pool) area, including the amount of free space and the size of the largest contiguous block in each area.
- /RESERVED
Displays information about memory reservations.
- /SLOTS
Displays information about the availability of process control block (PCB) vector slots and balance slots.
Description
For more information about the SHOW MEMORY command, see the description in the VSI OpenVMS DCL Dictionary or online help.
4.58. SHOW PAGE_TABLE
Displays a range of system page table entries, the entire system page table, or the entire global page table.
Format
SHOW PAGE_TABLE [range | /FREE [/HEADER=address ]
| /GLOBAL | /GPT | /PT
| /INVALID_PFN [=option]
| /NONMEMORY_PFN [=option]
| /PTE_ADDRESS | /SECTION_INDEX=n
| /S0S1 (d) | /S2 | /SPTW | /ALL]
[/L1 | /L2 | /L3 (d)]
Parameters
- range
Range of virtual addresses or PTE addresses for which SDA displays page table entries. If the qualifier /PTE_ADDRESS is given, then the range is of PTE addresses; otherwise, the range is of virtual addresses. The range given can be of process-space addresses.
If /PTE_ADDRESS is given, the range is expressed using the following syntax:
m Displays the single page table entry at address m m:n Displays the page table entries from address m to address n m;n Displays n bytes of page table entries starting at address m If /PTE_ADDRESS is not given, then range is expressed using the following syntax:
m Displays the single page table entry that corresponds to virtual address m m:n Displays the page table entries that correspond to the range of virtual addresses from m to n m;n Displays the page table entries that correspond to a range of n bytes starting at virtual address m Note
OpenVMS Alpha and IA-64 page protections are slightly different. For additional information, see Section 2.8, ''Page Protections and Access Rights''.
Qualifiers
- /FREE
Causes the starting addresses and sizes of blocks of pages in the free PTE list to be displayed. The qualifiers /S0S1 (default), /S2, /GLOBAL, and /HEADER determine which free PTE list is to be displayed. A range cannot be specified, and no other qualifiers can be combined with /FREE.
- /GLOBAL
Lists the global page table. When used with the /FREE qualifier, /GLOBAL indicates the free PTE list to be displayed.
- /HEADER=address
When used with the /FREE qualifier, the /HEADER=address qualifier displays the free PTE list for the specified private page table.
- /GPT
Specifies the portion of page table space that maps the global page table as the address range.
- /INVALID_PFN [=option]
The /INVALID_PFN qualifier, which is valid only on platforms that supply an I/O memory map, causes SDA to display only page table entries that map to PFNs that are not in the system's private memory or in Galaxy-shared memory, and which are not I/O access pages.
/INVALID_PFN has two optional keywords, READONLY and WRITABLE. If neither keyword is specified, all relevant pages are displayed.
If READONLY is specified, only pages marked for no write access are displayed. If WRITABLE is specified, only pages that allow write access are displayed. For example, SHOW PAGE_TABLE/ALL/INVALID_PFN=WRITABLE would display all system pages whose protection allows write, but which map to PFNs that do not belong to this system.
- /L1
- /L2
- /L3 (D)
Specifies the level for which page table entries are to be displayed for the specified portion of memory. You can specify only one level. /L3 is the default.
- /NONMEMORY_PFN [=option]
The /NONMEMORY_PFN qualifier causes SDA to display only page table entries that are not in the system's private memory or in Galaxy-shared memory.
/NONMEMORY_PFN has two optional keywords, READONLY and WRITABLE. If neither keyword is specified, all relevant pages are displayed.
If READONLY is specified, only pages marked for no write access are displayed. If WRITABLE is specified, only pages that allow write access are displayed. For example, SHOW PAGE_TABLE/ALL/NONMEMORY_PFN=WRITABLE would display all system pages whose protection allows write, but which map to PFNs that do not belong to this system.
- /PT
Specifies that the page table entries for the page table region of system space are to be displayed.
- /PTE_ADDRESS
Specifies that the range given is of PTE addresses instead of the virtual addresses mapped by the PTEs.
- /SECTION_INDEX=n
Displays the page table for the range of pages in the global section or pageable part of a loaded image. For pageable portions of loaded images, one of the qualifiers /L1, /L2, or /L3 can also be specified.
- /S0S1 (D)
- /S2
Specifies the region whose page table entries are to be displayed. When used with the /FREE qualifier, indicates the free PTE list to be displayed. By default, the page table entries or the free list for S0 & S1 space is displayed.
- /SPTW
Displays the contents of the system page table window.
- /ALL
Displays the page table entries for all shared (system) addresses. It is equivalent to specifying all of /S0S1, /S2, and /PT.
Description
If the /FREE qualifier is not specified, this command displays page table entries for the specified range of addresses or section of memory. For each virtual address displayed by the SHOW PAGE_TABLE command, the first eight columns of the listing provide the associated page table entry and describe its location, characteristics, and contents. SDA obtains this information from the system page table or from the process page table if a process_space address is given. The table below desand IMGACT process pools. cribes the information displayed by the SHOW PAGE_TABLE command.
If the /FREE qualifier is specified, this command displays the free PTE list for the specified section of memory.
The /L1, /L2, and /L3 qualifiers are ignored when used with the /FREE, /GLOBAL, and /SPTW qualifiers.
| Value | Meaning |
|---|---|
| MAPPED ADDRESS | Virtual address that marks the base of the virtual page(s) mapped by the PTE. |
| PTE ADDRESS | Virtual address of the page table entry that maps the virtual page(s). |
| PTE | Contents of the page table entry, a quadword that describes a system virtual page. |
| TYPE | Type of virtual page. Table 4.5, ''Types of Virtual Pages'' shows the eight types and their meanings. |
| READ | (Alpha only.) A code, derived from bits in the PTE, that designates the processor access modes (kernel, executive, supervisor, or user) for which read access is granted. |
| WRIT | (Alpha only.) A code, derived from bits in the PTE, that designates the processor access modes (kernel, executive, supervisor, or user) for which write access is granted. |
| MLOA | (Alpha only.) Letters that represent the setting of a bit or a combination of bits in the PTE. These bits indicate attributes of a page. Table 4.6, ''Bits In the PTE'' shows the codes and their meanings. |
| AR/PL | (IA-64 only) The access rights and privilege level of the page. Consists of a number (0-7) and a letter (K, E, S, or U) that determines access to a page in each mode. |
| KESU | (IA-64 only) The access allowed to the page in each mode. This is an interpretation of the AR/PL values in the previous column. For an explanation of the access codes, see Section 2.8, ''Page Protections and Access Rights''. |
| MLO | (IA-64 only) Letters that represent the setting of a bit or a combination of bits in the PTE. These bits indicate attributes of a page. Table 4.6, ''Bits In the PTE'' shows the codes and their meanings. |
| GH | Contents of granularity hint bits. |
| Type | Meaning |
|---|---|
| VALID | Valid page (in main memory). |
| TRANS | Transitional page (on free or modified page list). |
| DZERO | Demand-allocated, zero-filled page. |
| PGFIL | Page within a paging file. |
| STX | Section table's index page. |
| GPTX | Index page for a global page table. |
| IOPAG | Page in I/O address space. |
| NXMEM | Page not represented in physical memory. The page frame number (PFN) of this page is not mapped by any of the system's memory controllers. This indicates an error condition. |
| Column Name | Code | Meaning |
|---|---|---|
| M | M | Page has been modified. |
| L | L | Page is locked into a working set. |
| L | P | Page is locked in physical memory. |
| O | K | Owner is kernel mode. |
| O | E | Owner is executive mode. |
| O | S | Owner is supervisor mode. |
| O | U | Owner is user mode. |
| A | A | Address space match is set (Alpha only). |
If the virtual page has been mapped to a physical page, the last five columns of the listing include information from the page frame number (PFN) database; otherwise, the section is left blank. Table 4.7, ''Physical Page Information in the SHOW PAGE_TABLE Display'' describes the physical page information displayed by the SHOW PAGE_TABLE command.
| Category | Meaning |
|---|---|
| PGTYP | Type of physical page. Table 4.8, ''Types of Physical Pages'' shows the types of physical pages. |
| LOC | Location of the page within the system. Table 4.9, ''Locations of Physical Pages'' shows the possible locations with their meaning. |
| BAK | Place to find information on this page when all links to this PTE are broken: either an index into a process section table or the number of a virtual block in the paging file. |
| REFCNT | Number of references being made to this page. |
| WSLX | Working Set List Index. This shows as zero for resident and global pages, and is left blank for transition pages. |
| Page Type | Meaning |
|---|---|
| PROCESS | Page is part of process space. |
| SYSTEM | Page is part of system space. |
| GLOBAL | Page is part of a global section. |
| GBLWRT | Page is part of a global, writable section. |
| PPGTBL | Page is part of a process page table. |
| GPGTBL | Page is part of a global page table. |
| PHD | Page is part of a process PHD. These page types are variants of the PPGTBL page type. |
| PPT(Ln) | Page is a process page table page at level n. These page types are variants of the PPGTBL page type. |
| WSL | Page is part of a process's working list. These page types are variants of the PPGTBL page type. |
| SPT(Ln) | Page is a system page table page at level n. These page types are variants of the SYSTEM page type. |
| SHPT | Page is part of a shared page table. These page types are variants of the GBLWRT page type. |
| PFNLST | Page is in a Shared Memory Common Property Partition PFN database. These page types are variants of the SYSTEM page type. |
| SHM_REG | Page is in a Shared Memory Region. These page types are variants of the GBLWRT page type. |
| UNKNOWN | Unknown. |
| Location | Meaning |
|---|---|
| ACTIVE | Page is in a working set. |
| MFYLST | Page is in the modified page list. |
| FRELST | Page is in the free page list. |
| BADLST | Page is in the bad page list. |
| RELPND | Release of the page is pending. |
| RDERR | Page has had an error during an attempted read operation. |
| PAGOUT | Page is being written into a paging file. |
| PAGIN | Page is being brought into memory from a paging file. |
| ZROLST | Page is in the zeroed-page list. |
| UNKNWN | Location of page is unknown. |
SDA indicates pages are inaccessible by displaying one of the following messages:
-------   1 null page:       VA   FFFFFFFE.00064000     PTE   FFFFFFFD.FF800190

------- 974 null pages:      VA   FFFFFFFE.00064000     PTE   FFFFFFFD.FF800190
                             -to- FFFFFFFE.007FDFFF     -to-  FFFFFFFD.FF801FF8
In this case, the page table entries are not in use (page referenced is inaccessible).
-------      1 entry not in memory:    VA   FFFFFFFE.00800000   PTE   FFFFFFFD.FF802000

------- 784384 entries not in memory:  VA   FFFFFFFE.00800000   PTE   FFFFFFFD.FF802000
                                       -to- FFFFFFFF.7F7FDFFF   -to-  FFFFFFFD.FFDFDFF8
In this case, the page table entries do not exist (PTE itself is inaccessible).
-------    1 free PTE:    VA   FFFFFFFF.7F800000   PTE   FFFFFFFD.FFDFEOOO

------- 1000 free PTEs:   VA   FFFFFFFF.7F800000   PTE   FFFFFFFD.FFDFE000
                          -to- FFFFFFFF.7FFCDFFF   -to-  FFFFFFFD.FFDFFF38
In this case, the page table entries are in the list of free system pages.
In each case, VA is the MAPPED ADDRESS of the skipped entry, and PTE is the PTE ADDRESS of the skipped entry.
Examples
For an example of SHOW PAGE_TABLE output when the qualifier /FREE has not been given, see the SHOW PROCESS/PAGE_TABLES command.
SDA> SHOW PAGE_TABLE/FREE
S0/S1 Space Free PTEs
---------------------
 MAPPED ADDRESS        PTE ADDRESS             PTE           COUNT

FFFFFFFF.82A08000   FFFFFFFD.FFE0A820   0001FFE0.A8580000   00000003
FFFFFFFF.82A16000   FFFFFFFD.FFE0A858   0001FFE0.A8900000   00000003
FFFFFFFF.82A24000   FFFFFFFD.FFE0A890   0001FFE0.B3C00000   00000003
FFFFFFFF.82CF0000   FFFFFFFD.FFE0B3C0   0001FFE0.B4010000   00000001
FFFFFFFF.82D00000   FFFFFFFD.FFE0B400   0001FFE0.B4680000   00000002
   .
   .
   .
FFFFFFFF.82E48000   FFFFFFFD.FFE0B920   0001FFE0.B9390000   00000001
FFFFFFFF.82E4E000   FFFFFFFD.FFE0B938   0001FFE0.BA200000   00000002
FFFFFFFF.82E88000   FFFFFFFD.FFE0BA20   0001FFE0.C9780000   00000003
FFFFFFFF.8325E000   FFFFFFFD.FFE0C978   0001FFE0.CC980000   00000003
FFFFFFFF.83326000   FFFFFFFD.FFE0CC98   00000000.00000000   0000066D
This example shows the output when you invoke the SHOW PAGE_TABLE/FREE command.
4.59. SHOW PARAMETER
Displays the name, location, and value of one or more SYSGEN parameters currently in use or at the time that the system dump was taken.
Format
SHOW PARAMETER [sysgen_parameter]
[/ACP] [/ALL] [/CLUSTER] [/DYNAMIC] [/GALAXY] [/GEN] [/JOB] [/LGI] [/MAJOR]
                [/MULTIPROCESSING] [/OBSOLETE] [/PQL] [/RMS] [/SCS] [/SPECIAL] [/SYS] [/STARTUP]
                [/TTY]
Parameter
- sysgen_parameter
The name of a specific parameter to be displayed. The name can include wildcards. However, a truncated name is not recognized, unlike with the equivalent SYSGEN and SYSMAN commands.
Qualifiers
- /ACP
Displays all Files-11 ACP parameters.
- /ALL
Displays the values of all parameters except the special control parameters.
- /CLUSTER
Displays all parameters specific to clusters.
- /DYNAMIC
Displays all parameters that can be changed on a running system.
- /GALAXY
Displays all parameters specific to Galaxy systems.
- /GEN
Displays all general parameters.
- /JOB
Displays all Job Controller parameters.
- /LGI
Displays all LOGIN security control parameters.
- /MAJOR
Displays the most important parameters.
- /MULTIPROCESSING
Displays parameters specific to multiprocessing.
- /OBSOLETE
Displays all obsolete system parameters. SDA displays obsolete parameters only if they are named explicitly (no wildcards) or if /OBSOLETE is given.
- /PQL
Displays the parameters for all default and minimum process quotas.
- /RMS
Displays all parameters specific to OpenVMS Record Management Services (RMS).
- /SCS
Displays all parameters specific to OpenVMS Cluster System Communications Services.
- /SPECIAL
Displays all special control parameters.
- /STARTUP
Displays the name of the site-independent startup procedure.
- /SYS
Displays all active system parameters.
- /TTY
Displays all parameters for terminal drivers.
Description
The SHOW PARAMETER command displays the name, location, and value of one or more SYSGEN parameters at the time that the system dump is taken. You can specify either a parameter name, or one or more qualifiers, but not both a parameter and qualifiers. If you do not specify a parameter or qualifiers, then the last parameter displayed is displayed again.
The qualifiers are the equivalent to those available for the SHOW [parameter] command in the SYSGEN utility and the PARAMETERS SHOW command in the SYSMAN utility. See the VSI OpenVMS System Management Utilities Reference Manual for more information about these two commands. You can combine qualifiers, and all appropriate SYSGEN parameters are displayed.
Note
To see the entire set of parameters, use the SDA command SHOW PARAMETER /ALL /SPECIAL /STARTUP /OBSOLETE.
Examples
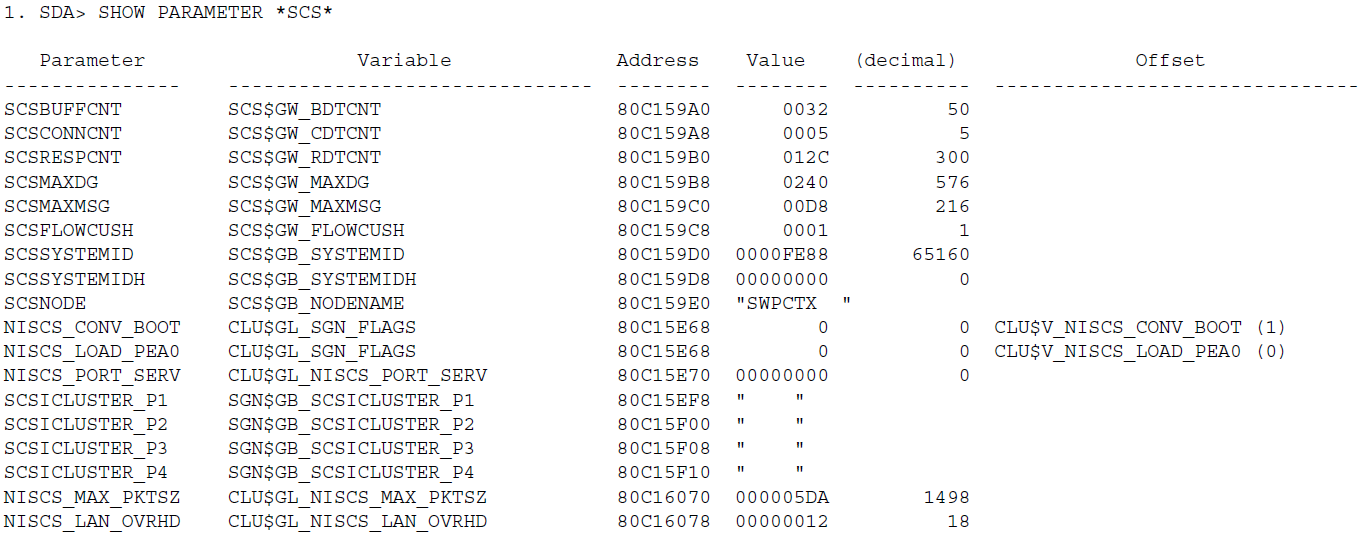
This example shows all parameters that have the string "SCS" in their name. For parameters defined as a single bit, the name and value of the bit offset within the location used for the parameter are also given.
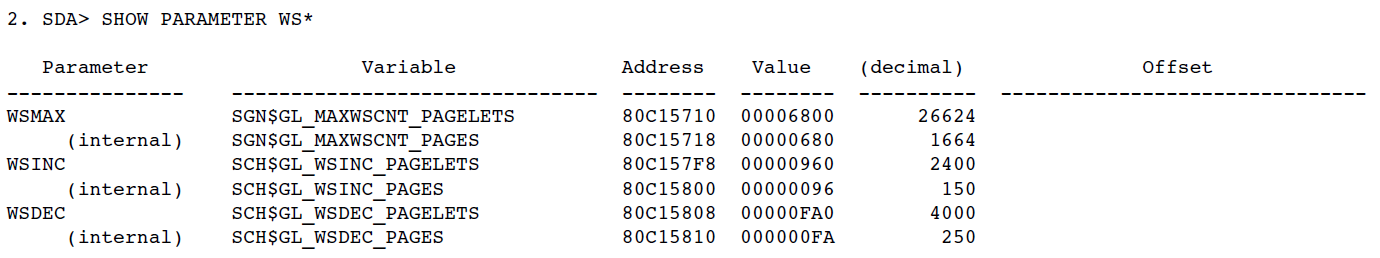
This example shows all parameters whose names begin with the string "WS". For parameters that have both an external value (pagelets) and an internal value (pages), both are displayed.
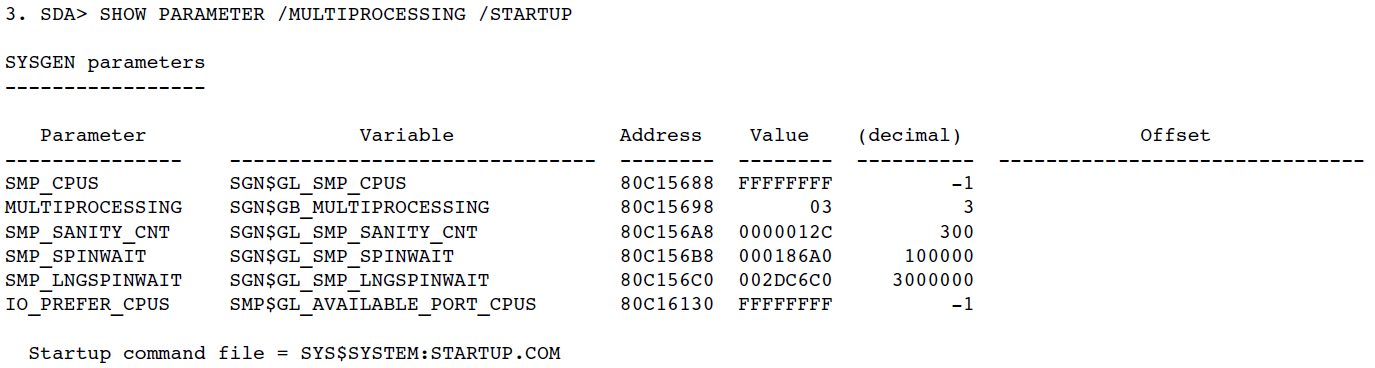
This example shows all the parameters specific to multiprocessing, plus the name of the site-independent startup command procedure.
4.60. SHOW PFN_DATA
Displays information that is contained in the page lists and PFN database.
Format
SHOW PFN_DATA { [/qualifier] | pfn [{:end-pfn|;length}]
                    }
or
SHOW PFN_DATA/MAP
Parameters
- pfn
Page frame number (PFN) of the physical page for which information is to be displayed.
- end-pfn
Last PFN to be displayed. When you specify the end-pfn parameter, a range of PFNs is displayed. This range starts at the PFN specified by the pfn parameter and ends with the PFN specified by the end-pfn parameter.
- length
Length of the PFN list to be displayed. When you specify the length parameter, a range of PFNs is displayed. This range starts at the PFN specified by the pfn parameter and contains the number of entries specified by the length parameter.
Qualifiers
- /ADDRESS=PFN-entry-address
Displays the PFN database entry at the address specified. The address specified is rounded to the nearest entry address, so if you have an address that points to one of the fields of the entry, the correct database entry will still be found.
- /ALL
Displays the following lists:
Free page list
Zeroed free page list
Modified page list
Bad page list
Untested page list
Private page lists, if any
Per-color or per-RAD free and zeroed free page lists
Entire database in order by page frame number
This is the default behavior of the SHOW PFN_DATA command. SDA precedes each list with a count of the pages it contains and its low and high limits.
- /BAD
Displays the bad page list. SDA precedes the list with a count of the pages it contains, its low limit, and its high limit.
- /COLOR [= {n|ALL} ]
Displays data on page coloring. The table below shows the command options available with the COLOR and RAD qualifiers, which are functionally equivalent.
Table 4.10. Command Options with the /COLOR and /RAD Qualifiers Options Meaning /COLOR 1 with no value Displays a summary of the lengths of the color 1 page lists for both free pages and zeroed pages. /COLOR= n where n is a color number Displays the data in the PFN lists (for the specified color) for both free and zeroed pages. /COLOR=ALL Displays the data in the PFN lists (for all colors), for both free and zeroed free pages. /COLOR= n or /COLOR=ALL with /FREE or /ZERO Displays only the data in the PFN list (for the specified color or all colors), for either free or zeroed free pages as appropriate. The qualifiers /BAD and /MODIFIED are ignored with /COLOR= n and /COLOR=ALL. /COLOR without an option specified together with one or more of /FREE, /ZERO, /BAD, or /MODIFIED Displays the color summary in addition to the display of the requested list. Wherever COLOR is used in this table, RAD is equally applicable, both in the qualifier name and the meaning.
For more information on page coloring, see VSI OpenVMS System Management Utilities Reference Manual: M--Z.
- /FREE
Displays the free page list. SDA precedes the list with a count of the pages it contains, its low limit, and its high limit.
- /MAP
Displays the contents of the PFN memory map. On platforms that support it, the I/O space map is also displayed. You cannot combine the /MAP qualifier with any parameters or other qualifiers.
- /MODIFIED
Displays the modified page list. SDA precedes the list with a count of the pages it contains, its low limit, and its high limit.
- /PRIVATE [=address]
Displays private PFN lists. If no address is given, all private PFN lists are displayed; if an address is given, only the PFN list whose head is at the given address is displayed.
- /RAD [= {n|ALL} ]
Displays data on the disposition of pages among the Resource Affinity Domains (RADs) on applicable systems. /RAD is functionally equivalent to /COLOR. See Table 4.10, ''Command Options with the /COLOR and /RAD Qualifiers'' for the command options available with /RAD.
- /SUMMARY[=(option,...)]
By default, displays a summary of all pages in the system, totaling pages by page location (Free List, Modified List, Active, and so on) and by page type (Process, System, Global, and so on). Also, provides a breakdown of active system pages by their virtual address (S0/S1, S2, and so on).
Additional information is displayed if one or more options are given. If multiple options are given, they must be separated by commas and enclosed in parentheses. Available options are:
/SUMMARY=PROCESS
Displays a breakdown of active process pages for each process by virtual address (P0, P1, and so on), and of non-active process pages by page location.
/SUMMARY=GLOBAL
Displays a breakdown for each global section of its in-memory pages by page location.
/SUMMARY=RAD
If RADs are enabled on the system, displays a breakdown for each RAD of its in-memory pages by location and type.
/SUMMARY=ALL
Equivalent to /SUMMARY=(PROCESS,GLOBAL,RAD)
You cannot combine the /SUMMARY qualifier with any other qualifiers, but you can specify a range.
- /SYSTEM
Displays the entire PFN database in order by page frame number, starting at PFN 0000.
- /UNTESTED
Displays the state of the untested PFN list that was set up for deferred memory testing.
- /ZERO
Displays the contents of the zeroed free page list.
Description
For each page frame number it displays, the SHOW PFN_DATA command lists information used in translating physical page addresses to virtual page addresses.
The display contains two or three lines: Table 4.11, ''PFN Data---Fields in Line One'' shows the fields in line one, Table 4.12, ''PFN Data---Fields in Line Two'' shows the fields in line two, and Table 4.13, ''PFN Data---Fields in Line Three'' shows the fields in line three, displayed only if relevant (page table page or non-zero flags).
| Item | Contents |
|---|---|
| PFN | Page frame number. |
| DB ADDRESS | Address of PFN structure for this page. |
| PT PFN | PFN of the page table page that maps this page. |
| BAK | Place to find information on this page when all links to this PTE are broken: either an index into a process section table or the number of a virtual block in the paging file. |
| FLINK | Forward link within PFN database that points to the next physical page (if the page is on one of the lists: FREE, MODIFIED, BAD, or ZEROED); this longword also acts as the count of the number of processes that are sharing this global section. |
| BLINK | Backward link within PFN database (if the page is on one of the lists: FREE, MODIFIED, BAD, or ZEROED); also acts as an index into the working set list. |
| SWP/BO | Either a swap file page number or a buffer object reference count, depending on a flag set in the page state field. |
| LOC | Location of the page within the system. Table 4.9, ''Locations of Physical Pages'' shows the possible locations with their meaning. |
| Item | Contents |
|---|---|
| (Blank) | First field of line two is left blank. |
| PTE ADDRESS | Virtual address of the page table entry that describes the virtual page mapped into this physical page. If no virtual page is mapped into this physical page then "<no backpointer>" is displayed, and the next three fields are left blank. |
| PTE Type | If a virtual page is mapped into this physical page, a description of the type of PTE is provided across the next three fields: one of "System-space PTE", "Global PTE (section index nnnn)", "Process PTE (process index nnnn)". If no virtual page is mapped into this physical page, these fields are left blank. |
| REFCNT | Number of references being made to this page. |
| PAGETYP | Type of physical page. See Table 4.8, ''Types of Physical Pages'' for the types of physical pages and their meanings. |
| Item | Contents |
|---|---|
| COUNTS | If the page is a page table page, then the contents of the PRN$W_PT_VAL_CNT, PFN$W_PT_LCK_CNT, and PFN$W_PT_WIN_CNT fields are displayed. The format is as follows: VALCNT = nnnn LCKCNT = nnnn WINCNT = nnnn |
| FLAGS | The flags in text form that are set in page state. Table 4.14, ''Flags Set in Page State'' shows the possible flags and their meaning. |
| Flag | Meaning |
|---|---|
| BUFOBJ | Set if any buffer objects reference this page |
| COLLISION | Indicates an empty collision queue when page read is complete |
| BADPAG | Indicates a bad page |
| RPTEVT | Indicates a report event on I/O completion |
| DELCON | Indicates a delete PFN when REFCNT=0 |
| MODIFY | Indicates a dirty page (modified) |
| UNAVAILABLE | Indicates PFN is unavailable; most likely a console page |
| SWPPAG_VALID | Indicated swap file page number is valid |
| TOP_LEVEL_PT | Level one (1) page table |
| SLOT | Page is part of process's balance set |
| SHARED | Shared memory page |
| ZEROED | Shared memory page that has been zeroed |
Examples
SDA> SHOW PFN_DATA/MAP
System Memory Map
-----------------

Start PFN   PFN count   Flags
---------   ---------   -----
00000000    000000FA    0009  Console Base
000000FA    00003306    000A  OpenVMS Base
00003C00    000003FF    000A  OpenVMS Base
00003FFF    00000001    0009  Console Base
00003400    00000800    0010  Galaxy_Shared
This example shows the output when you invoke the SHOW PFN/MAP command.
SDA> SHOW PFN 598:59f

PFN data base for PFN range
---------------------------

       PFN           DB  ADDRESS         PT PFN              BAK              FLINK             BLINK       SWP/BO   LOC
                     PTE ADDRESS                                                                            REFCNT PAGETYP
----------------- ----------------- ----------------- ----------------- ----------------- ----------------- ------ -------
00000000.00000598 FFFFF802.06C16600 00000000.000001D7 FFFFFFFF.84D6F700 00000000.00000000 00000000.00000000  ----  ACTIVE
                  FFFFF801.FFD072A0 System-space PTE                                                         0001  SYSTEM

00000000.00000599 FFFFF802.06C16640 00000000.00000000 00000000.0001DBD9 00000000.0001DBD9 00000000.000081B6  ----  FRELST
                  <no  backpointer>                                                                          0000  SYSTEM


00000000.0000059A FFFFF802.06C16680 00000000.00000565 FF000000.00000000 00000000.00000000 00000000.000000D4  ----  ACTIVE
                  000007FF.FF700000 Process PTE (process index 001A)                                         0001  PROCESS
                  FLAGS  = Modify

00000000.0000059B FFFFF802.06C166C0 00000000.0000493A 000000FD.00010000 00000000.00000003 00000000.00000000  ----  ACTIVE
                  FFFFF802.0F641680 Global PTE (section index 00FD)                                          0001  GLOBAL

00000000.0000059C FFFFF802.06C16700 00000000.000005E3 FF000000.00000000 00000000.00000000 00000000.00000136  ----  ACTIVE
                  000007FE.00001C30 Process PTE (process index 000F)                                         0001  PROCESS

00000000.0000059D FFFFF802.06C16740 00000000.0000059D 00000000.8705A000 00000000.00000002 00000000.00000001  ----  ACTIVE
                  000007FF.FFFFFFF8 Process PTE (process index 0005)                                         0001  PPT(L1)
                  VALCNT = 0002     LCKCNT = FFFF     WINCNT = FFFF     FLAGS  = Modify,Top_Level_PT

00000000.0000059E FFFFF802.06C16780 00000000.000001D7 FFFFFFFF.84D6F700 00000000.00000000 00000000.00000000  ----  ACTIVE
                  FFFFF801.FFD07420 System-space PTE                                                         0001  SYSTEM

00000000.0000059F FFFFF802.06C167C0 00000000.000001D7 FFFFFFFF.84D6F700 00000000.00000000 00000000.00000000  ----  ACTIVE
                  FFFFF801.FFD07428 System-space PTE                                                         0001  SYSTEM
This example shows the output from SHOW PFN for a range of pages.
4.61. SHOW POOL
Displays the contents of the nonpaged dynamic storage pool, the bus-addressable pool, and the paged dynamic storage pool. You can display part or all of each pool. If you do not specify a range or qualifiers, the default is SHOW POOL/ALL. Optionally, you can display the pool history ring buffer and pool statistics.
Format
SHOW POOL [range | /ALL (d)| /BAP | /NONPAGED |
                    /PAGED]
[ /BRIEF | /CHECK | /FREE | /HEADER | /MAXIMUM_BYTES [=n] | /SUMMARY
                        | /TYPE=packet-type | /SUBTYPE=packet-type | /UNUSED ]
[/RING_BUFFER[=address]]
[/STATISTICS [=ALL] [/NONPAGED | /BAP | /PAGED]
Parameter
- range
Range of virtual addresses in pool that SDA is to examine. You can express a range using the following syntax:
m:n Range of virtual addresses in pool from m to n m;n Range of virtual addresses in pool starting at m and continuing for n bytes
Qualifiers
- /ALL
Displays the entire contents of the dynamic storage pool, except for those portions that are free (available). This is the default behavior of the SHOW POOL command.
- /BAP
Displays the contents of the bus-addressable dynamic storage pool currently in use.
- /BRIEF
Displays only general information about the dynamic storage pool and its addresses.
- /CHECK
Checks all free packets for POOLCHECK-style corruption, in exactly the same way that the system does when generating a POOLCHECK crash dump.
- /FREE
Displays the entire contents, both allocated and free, of the specified region or regions of pool. Use the /FREE qualifier with a range to show all of the used and free pool in the given range.
- /HEADER
Displays only the first 16 bytes of each data packet found within the specified region or regions of pool.
- /MAXIMUM_BYTES [=n]
Displays only the first n bytes of a pool packet; if you specify /MAXIMUM_BYTES without a value, the default is 64 bytes.
- /NONPAGED
Displays the contents of the nonpaged dynamic storage pool currently in use.
- /PAGED
Displays the contents of the paged dynamic storage pool currently in use.
- /RING_BUFFER [=address]
Displays the contents of the pool history ring buffer if pool checking has been enabled. Entries are displayed in reverse chronological order, that is, most to least recent. If address is specified, the only entries in the ring buffer displayed are for pool blocks that address lies within.
- /STATISTICS [= ALL]
Displays usage statistics about each lookaside list and the variable free list. For each lookaside list, its queue header address, packet size, the number of packets, attempts, fails, and deallocations are displayed. (If pool checking is disabled, the attempts, fails, and deallocations are not displayed.) For the variable free list, its queue header address, the number of packets and the size of the smallest and largest packets are displayed. You can further qualify /STATISTICS by using either /NONPAGED, /BAP, or /PAGED to display statistics for a specified pool area. Paged pool only has lookaside lists if the system parameter PAGED_LAL_SIZE has been set to a nonzero value; therefore paged pool lookaside list statistics are only displayed if there has been activity on a list.
If you specify /STATISTICS without the ALL keyword, only active lookaside lists are displayed. Use /STATISTICS = ALL to display all lookaside lists.
- /SUBTYPE=packet-type
Displays the packets within the specified region or regions of pool that are of the indicated packet-type. For information on packet-type, see packet-type in the Description section.
- /SUMMARY
Displays only an allocation summary for each specified region of pool.
- /TYPE=packet-type
Displays the packets within the specified region or regions of pool that are of the indicated packet-type. For information on packet-type, see packet-type in the Description section.
- /UNUSED
Displays only variable free packets and lookaside list packets, not used packets.
Description
The SHOW POOL command displays information about the contents of any specified region of dynamic storage pool. There are several distinct display formats, as follows:
Pool layout display. This display includes the addresses of the pool structures and lookaside lists, and the ranges of memory used for pool.
Full pool packet display. This display has a section for each packet, consisting of a summary line (the packet type, its start address and size, and, on systems that have multiple Resource Affinity Domains (RADs), the RAD number), followed by a dump of the contents of the packet in hexadecimal and ASCII.
Header pool packet display. This display has a single line for each packet. This line contains the packet type, its start address and size, and, on systems that have multiple RADs, the RAD number, followed by the first 16 bytes of the packet, in hexadecimal and ASCII.
Pool summary display. This display consists of a single line for each packet type, and includes the type, the number of occurrences and the total size, and the percentage of used pool consumed by this packet type.
Pool statistics display. This display consists of statistics for variable free pool and for each lookaside list. For variable free pool, it includes the number of packets, the total bytes available, and the sizes of the smallest and largest packets. In addition, if pool checking is enabled, the total bytes allocated from the variable list and the number of times pool has been expanded are also displayed.
For lookaside lists, the display includes the listhead address and size, the number of packets (both the maintained count and the actual count), the operation sequence number for the list, the allocation attempts and failures, and the number of deallocations.
On systems with multiple RADs, statistics for on-RAD deallocations are included in the display for the first RAD.
Ring buffer display. This display is only available when pool checking is enabled. It consists of one line for each packet in the ring buffer and includes the address and size of the pool packet being allocated or deallocated, its type, the PC of the caller and the pool routine called, the CPU and IPL of the call, and the system time.
Optionally, the ring buffer display can be limited to only the entries that contain a given address.
The qualifiers used on the SHOW POOL command determine which displays are generated. The default is the pool layout display, followed by the full pool packet display, followed by the pool summary display, these being generated in turn for Nonpaged Pool, Bus-Addressable Pool (if it exists in the system or dump being analyzed), and then Paged Pool.
If you specify a range, type, or subtype, then the pool layout display is not generated, and the pool summary display is a summary only for the range, type, or subtype, and not for the entire pool.
Not all displays are relevant for all pool types. For example, Paged Pool may have no lookaside lists, in which case the Paged Pool statistics display will consist only of variable free pool information. And because there is a single ring buffer for all pools, only one ring buffer display is generated even if all pools are being displayed.
Packet-type
Each packet of pool has a type field (a byte containing a value in the range of 0-255). Many of these type values have names associated that are defined in $DYNDEF in SYS$LIBRARY:LIB.MLB. The packet-type specified in the /TYPE qualifier of the SHOW POOL command can either be the value of the pool type or its associated name.
Some pool packet types have an additional subtype field (also a byte containing a value in the range of 0--255), many of which also have associated names. The packet-type specified in the /SUBTYPE qualifier of the SHOW POOL command can either be the value of the pool type or its associated name. However, if given as a value, a /TYPE qualifier (giving a value or name) must also be specified. Note also that /TYPE and /SUBTYPE are interchangeable if packet-type is given by name. The table below shows several examples.
| /TYPE and /SUBTYPE Qualifiers | Meaning |
|---|---|
| /TYPE = CI | All CI packets regardless of subtype |
| /TYPE = CI_MSG | All CI packets with subtype CI_MSG |
| /TYPE = MISC/SUBTYPE = 120 | All MISC packets with subtype 120 |
| /TYPE = 0 or /TYPE = UNKNOWN | All packets with an unknown TYPE/SUBTYPE combination |
Examples
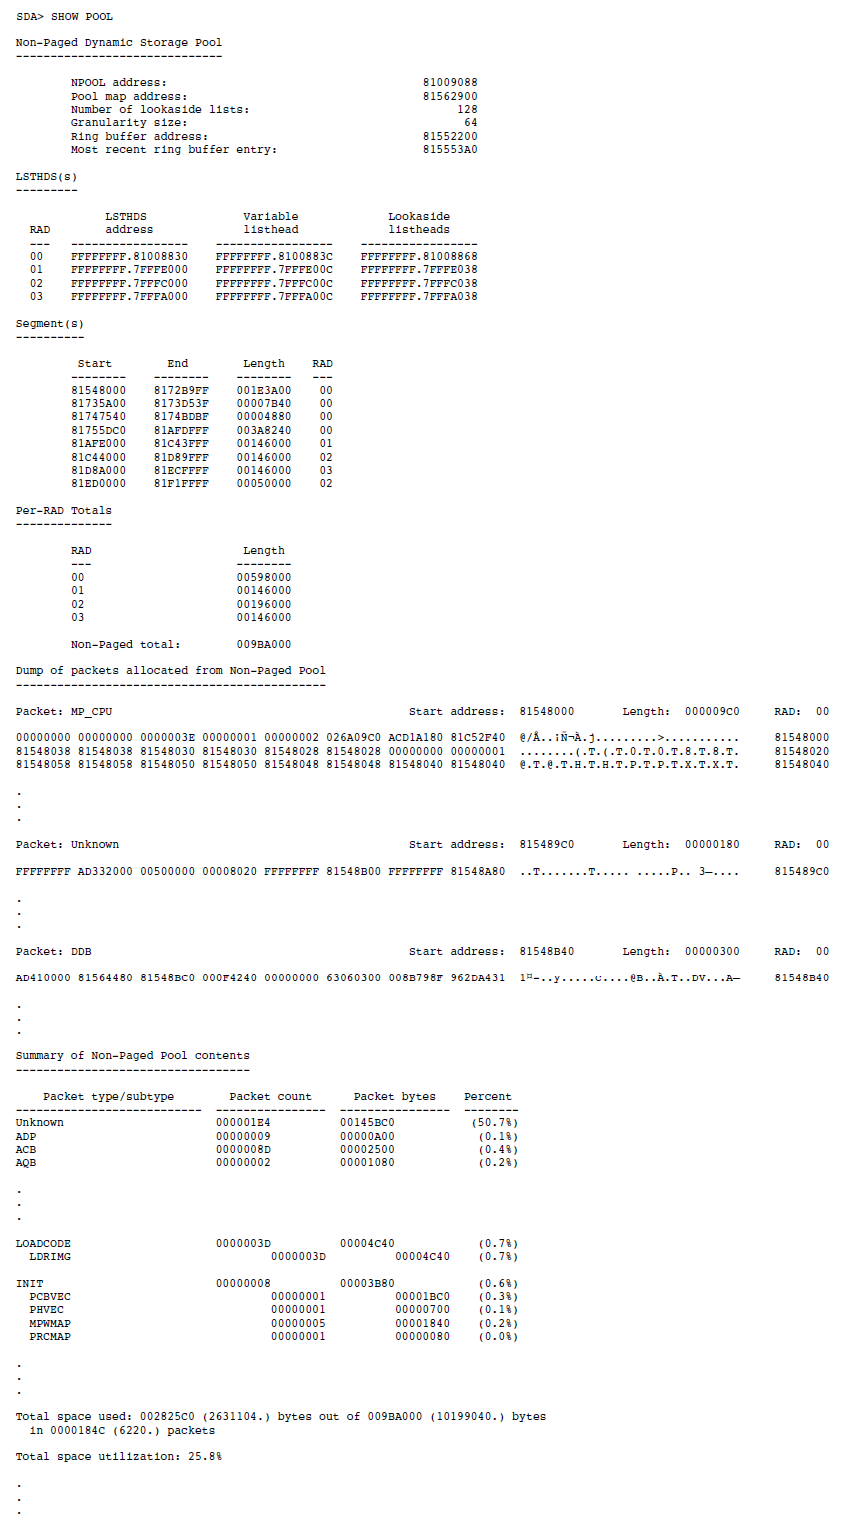
This example shows the Nonpaged Pool portion of the default SHOW POOL display.
SDA> SHOW POOL/TYPE=IPC/HEADER 8156E140:815912C0

Non-Paged Dynamic Storage Pool
------------------------------

Dump of packets allocated from Non-Paged Pool
---------------------------------------------

   Packet type/subtype     Start    Length   RAD                    Header contents
-------------------------  -------- -------- ---   -----------------------------------------------------
IPC_TDB                    8156E140 00000040  00   81591180 057B0040 00000040 81591180  ..Y.@...@.{...Y.
IPC_LIST                   815838C0 00009840  00   004C0200 087B9840 0057A740 8158D100  .ÑX.@§W.@.{...L.
IPC_LIST                   8158D100 00001840  00   00040400 087B1840 00570F00 8158E940  @éX...W.@.{.....
IPC_LIST                   8158E940 00002840  00   00140200 087B2840 0056F6C0 81591180  ..Y.ÀöV.@({.....
IPC_TPCB                   81591180 00000080  00   00000000 067B0080 0056CE80 81591200  ..Y..ÎV...{.....
IPC                        81591200 000000C0  00   00000000 007B00C0 0056CE00 815912C0  À.Y..ÎV.À.{.....

Summary of Non-Paged Pool contents
----------------------------------

    Packet type/subtype        Packet count      Packet bytes    Percent
---------------------------  ----------------  ----------------  --------
IPC                          00000006          0000DA40          (100.0%)
  IPC                                00000001          000000C0    (0.3%)
  IPC_TDB                            00000001          00000040    (0.1%)
  IPC_TPCB                           00000001          00000080    (0.2%)
  IPC_LIST                           00000003          0000D8C0   (99.3%)

Total space used: 0000DA40 (55872.) bytes out of 00023180 (143744.) bytes
  in 00000006 (6.) packets

Total space utilization: 38.9%
This example shows how you can specify a pool packet type and a range of addresses.
SDA> SHOW POOL/STATISTICS

Non-Paged Pool statistics for RAD 00
------------------------------------

        On-RAD deallocations (all RADs):                    1221036
        Total deallocations (all RADs):                     1347991
        Percentage of on-RAD deallocations:                   90.6%

Variable list statistics
------------------------

        Number of packets on variable list:                       7
        Total bytes on variable list:                       3613376
        Smallest packet on variable list:                       256
        Largest packet on variable list:                    3598016
        Bytes allocated from variable list:                 2140480
        Times pool expanded:                                      0

Lookaside list statistics
-------------------------

                      List   Packets     Packets    Operation   Allocation  Allocation
  Listhead address    size   (approx)    (actual)   sequence #   attempts    failures    Deallocs
  -----------------   ----  ----------  ----------  ----------  ----------  ----------  ----------
  FFFFFFFF.81008870     64           5           5       10057       10549         492       10062
  FFFFFFFF.81008878    128          21          21         366        4881        4515         387
  FFFFFFFF.81008880    192          33          33       27376       27542         166       27409
  FFFFFFFF.81008888    256           4           4        8367        8476         118        8362

   .
   .
   .
This example shows the Nonpaged Pool portion of the SHOW POOL/STATISTICS display.
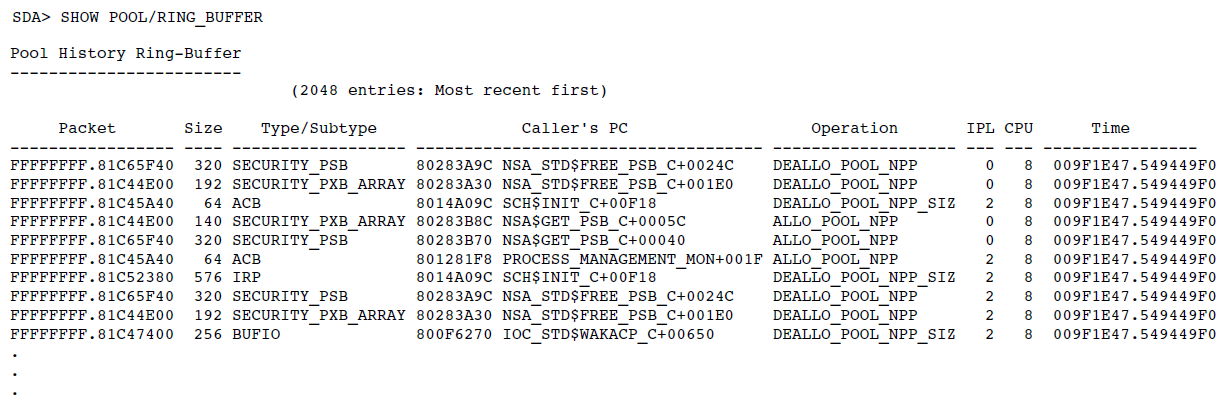
This example shows the output of the SHOW POOL/RING_BUFFER display.
SDA> SHOW POOL/PAGED/STATISTICS

Paged Pool statistics
---------------------

Variable list statistics
------------------------
        Number of packets on variable list:                     30
        Total bytes on variable list:                      4778288
        Smallest packet on variable list:                       16
        Largest packet on variable list:                   4777440

Lookaside list statistics
-------------------------
                        List                  Operation
  Listhead address      size     Packets      sequence #
  -----------------     ----    ----------    ----------
         ...
  FFFFFFFF.882119D0       80             0             1
         ...
This example shows the output of paged pool statistics when the system parameter PAGED_LAL_SIZE has been set to a nonzero value.
4.62. SHOW PORTS
Displays those portions of the port descriptor table (PDT) that are port independent.
Format
SHOW PORTS [/qualifier[,...]]
Parameters
None.
Qualifiers
- /ADDRESS=pdt-address
Displays the specified port descriptor table (PDT). You can find the pdt-address for any active connection on the system in the PDT summary page display of the SHOW PORTS command. This command also defines the symbol PE_PDT. The connection descriptor table (CDT) addresses are also stored in many individual data structures related to System Communications Services (SCS) connections, for instance, in the path block displays of the SHOW CLUSTER/SCS command.
- /BUS=bus-address
Displays bus (LAN device) structure data.
- /CHANNEL=channel-address
Displays channel (CH) data.
- /DEVICE
Displays the network path description for a channel.
- /MESSAGE
Displays the message data associated with a virtual circuit (VC).
- /NODE=node
Shows only the virtual circuit block associated with the specific node. When you use the /NODE qualifier, you must also specify the address of the PDT using the /ADDRESS qualifier.
- /VC=vc-address
Displays the virtual circuit data.
Description
The SHOW PORTS command provides port-independent information from the port descriptor table (PDT) for those CI ports with full System Communications Services (SCS) connections. This information is used by all SCS port drivers.
The SHOW PORTS command also defines symbols for PEDRIVER based on the cluster configuration. These symbols include the following information:
Virtual circuit (VC) control blocks for each of the remote systems
Bus data structure for each of the local LAN adapters
Some of the data structures used by both PEDRIVER and the LAN drivers
The following symbols are defined automatically:
VC_nodename---Example: VC_NODE1, address of the local node's virtual circuit to node NODE1.
CH_nodename---The preferred channel for the virtual circuit. For example, CH_NODE1, address of the local node's preferred channel to node NODE1.
BUS_busname---Example: BUS_ETA, address of the local node's bus structure associated with LAN adapter ETA0.
PE_PDT---Address of PEDRIVER's port descriptor table.
MGMT_VCRP_busname---Example: MGMT_VCRP_ETA, address of the management VCRP for bus ETA.
HELLO_VCRP_busname---Example: HELLO_VCRP_ETA, address of the HELLO message VCRP for bus ETA.
VCIB_busname---Example: VCIB_ETA, address of the VCIB for bus ETA.
UCB_LAVC_busname---Example: UCB_LAVC_ETA, address of the LAN device's UCB used for the local-area OpenVMS Cluster protocol.
UCB0_LAVC_busname---Example: UCB0_LAVC_ETA, address of the LAN device's template UCB.
LDC_LAVC_busname---Example: LDC_LAVC_ETA, address of the LDC structure associated with LAN device ETA.
LSB_LAVC_busname---Example: LSB_LAVC_ETA, address of the LSB structure associated with LAN device ETA.
These symbols equate to system addresses for the corresponding data structures. You can use these symbols, or an address, in SHOW PORTS qualifiers that require an address, as in the following:
SDA> SHOW PORTS/BUS=BUS_ETA
The SHOW PORTS command produces several displays. The initial display, the PDT summary page, lists the PDT address, port type, device name, and driver name for each PDT. Subsequent displays provide information taken from each PDT listed on the summary page.
You can use the /ADDRESS qualifier to the SHOW PORTS command to produce more detailed information about a specific port. The first display of the SHOW PORTS/ADDRESS command duplicates the last display of the SHOW PORTS command, listing information stored in the port's PDT. Subsequent displays list information about the port blocks and virtual circuits associated with the port.
Examples
SDA> SHOW PORTS
OpenVMS Cluster data structures
--------------------------

                  --- PDT Summary Page ---

 PDT Address          Type         Device          Driver Name
 -----------          ----         -------         -----------

  80E2A180             pn          PNA0            SYS$PNDRIVER
  80EC3C70             pe          PEA0            SYS$PEDRIVER

                  --- Port Descriptor Table (PDT) 80E2A180 ---

Type: 09 pn
Characteristics: 0000

Msg Header Size          104  Flags               0000  Message Sends    3648575
Max Xfer Bcnt       00100000  Counter CDRP    00000000  Message Recvs    4026887
Poller Sweep              21  Load Vector     80E2DFCC  Mess Sends NoFP  3020422
Fork Block W.Q.     80E2A270  Load Class            60  Mess Recvs NoFP  3398732
UCB Address         80E23380  Connection W.Q. 80E4BF94  Datagram Sends         0
ADP Address         80E1BF00  Yellow Q.       80E2A2E0  Datagram Recvs         0
Max VC timeout            16  Red Q.          80E2A2E8  Portlock        80E1ED80
SCS Version                2  Disabled Q.     80FABB74  Res Bundle Size      208
                              Port Map        00000001

                  --- Port Descriptor Table (PDT) 80EC3C70 ---

Type: 03 pe
Characteristics: 0000

Msg Header Size           32  Flags               0000  Message Sends     863497
Max Xfer Bcnt       FFFFFFFF  Counter CDRP    00000000  Message Recvs     886284
Poller Sweep              30  Load Vector     80EDBF8C  Mess Sends NoFP   863497
Fork Block W.Q.     80EC3D60  Load Class            10  Mess Recvs NoFP   886284
UCB Address         80EC33C0  Connection W.Q. 80EFF5D4  Datagram Sends         0
ADP Address         00000000  Yellow Q.       80EC3DD0  Datagram Recvs         0
Max VC timeout            16  Red Q.          80EC3DD8  Portlock        00000000
SCS Version                2  Disabled Q.     812E72B4  Res Bundle Size        0
                              Port Map        00000000
This example illustrates the default output of the SHOW PORTS command.
SDA> SHOW PORTS/ADDRESS=80EC3C70
OpenVMS Cluster data structures
--------------------------

                  --- Port Descriptor Table (PDT) 80EC3C70 ---

Type: 03 pe
Characteristics: 0000

Msg Header Size           32  Flags               0000  Message Sends     864796
Max Xfer Bcnt       FFFFFFFF  Counter CDRP    00000000  Message Recvs     887086
Poller Sweep              30  Load Vector     80EDBF8C  Mess Sends NoFP   864796
Fork Block W.Q.     80EC3D60  Load Class            10  Mess Recvs NoFP   887086
UCB Address         80EC33C0  Connection W.Q. 80EFF5D4  Datagram Sends         0
ADP Address         00000000  Yellow Q.       80EC3DD0  Datagram Recvs         0
Max VC timeout            16  Red Q.          80EC3DD8  Portlock        00000000
SCS Version                2  Disabled Q.     812E72B4  Res Bundle Size        0
                              Port Map        00000000
                              Port Map        00000000

                 --- Port Block 80EC4540 ---

Status: 0001 authorize
VC Count: 20
Secs Since Last Zeroed: 77020

SBUF Size             824     LBUF Size         5042     Fork Count     1943885
SBUF Count             28     LBUF Count           1     Refork Count         0
SBUF Max              768     LBUF Max           384     Last Refork   00000000
SBUF Quo               28     LBUF Quo             1     SCS Messages   1154378
SBUF Miss            1871     LBUF Miss         3408     VC Queue Cnt    361349
SBUF Allocs       1676801     LBUF Allocs      28596     TQE Received    770201
SBUFs In Use            2     LBUFs In Use         0     Timer Done      770201
Peak SBUF In Use      101     Peak LBUF In Use    10     RWAITQ Count     30288
SBUF Queue Empty        0     LBUF Queue Empty     0     LDL Buf/Msg      32868
TR SBUF Queue Empty     0     Ticks/Second        10     ACK Delay      1000000
No SBUF for ACK         0     Listen Timeout       8     Hello Interval      30

Bus Addr  Bus     LAN Address    Error Count Last Error   Time of Last Error
--------  ---  ----------------- ----------- ---------- -----------------------
80EC4C00  LCL  00-00-00-00-00-00           0
80EC5400  EXA  08-00-2B-17-CF-92           0
80EC5F40  FXA  08-00-2B-29-E1-40           0

                 --- Virtual Circuit (VC) Summary ---

VC Addr     Node    SCS ID  Lcl ID    Status Summary        Last Event Time
--------  --------  ------  ------  -----------------   -----------------------
80E566C0  ARUSHA     19617  223/DF  open,path            8-FEB-2001 16:01:57.58
80E98840  ETOSHA     19699  222/DE  open,path            8-FEB-2001 16:01:58.41
80E98A80  VMS        19578  221/DD  open,path            8-FEB-2001 16:01:58.11
   .
   .
   .
This example illustrates the output produced by the SHOW PORTS command for the PDT at address 80EC3C70.
4.63. SHOW PROCESS
Displays the software and hardware context of any process in the system. If the process is suspended (ANALYZE/SYSTEM), then some displays may be incomplete or unavailable. If the process was outswapped at the time of the system crash, or not included in a selective dump (ANALYZE/CRASH_DUMP), then some displays may be incomplete or unavailable. Please see descriptions of the individual qualifiers for details not included in the syntax definition.
Format
SHOW PROCESS
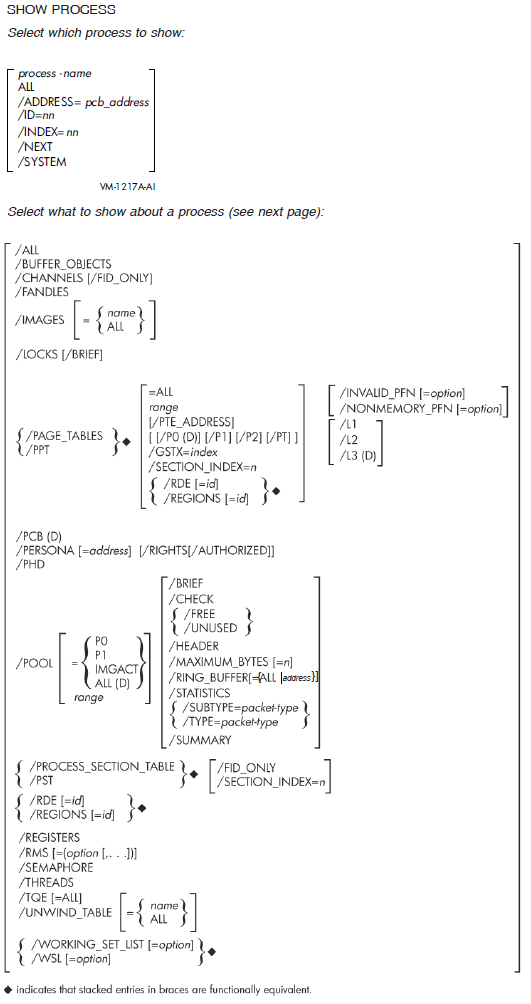
Parameters
- ALL
Information is to be displayed about all processes that exist in the system.
- process-name
Name of the process for which information is to be displayed. Use of the process-name parameter or one of the /ADDRESS, /ID, /INDEX, /NEXT, or /SYSTEM qualifiers causes the SHOW PROCESS command to perform an implicit SET PROCESS command, making the indicated process the current process for subsequent SDA commands.
When you analyze a crash dump from a multiprocessing system, changing process context may require a switch of CPU context as well. When you issue a SET PROCESS command, SDA automatically changes its CPU context to that of the CPU on which that process is, or was most recently, current. You can determine the names of the processes in the system by issuing a SHOW SUMMARY command.
The process-name can contain up to 15 uppercase letters, numerals, the underscore (_), dollar sign, colon (:), and some other printable characters. If it contains any other characters (including lowercase letters), you may need to enclose the process-name in quotation marks (" ").
Qualifiers
- /ADDRESS=pcb-address
Specifies the process control block (PCB) address of a process in order to display information about the process.
- /ALL
Displays all information shown by the following qualifiers:
/BUFFER_OBJECTS
/CHANNELS
/FANDLES
/IMAGES=ALL
/LOCKS
/PAGE_TABLES=ALL
/PCB
/PERSONA/RIGHTS
/PHD
/POOL/HEADER/RING_BUFFER/STATISTICS
/PROCESS_SECTION_TABLE
/REGIONS
/REGISTERS
/RMS
/SEMAPHORE
/THREADS
/TQE
/UNWIND_TABLE (IA-64 only.)
/WORKING_SET_LIST
- /AUTHORIZED
Used with the /PERSONA/RIGHTS qualifiers. See the /PERSONA/RIGHTS/AUTHORIZED description for the use of the /AUTHORIZED qualifier.
- /BRIEF
When used with the /LOCKS qualifier, causes SDA to display each lock owned by the current process in brief format, that is, one line for each lock. When used with the /POOL qualifier, causes SDA to display only general information about process pool and its addresses.
- /BUFFER_OBJECTS
Displays all the buffer objects that a process has created.
- /CHANNELS
Displays information about the I/O channels assigned to the process.
- /CHECK
Checks all free process pool packets for POOLCHECK-style corruption in exactly the same way that the system does when generating a POOLCHECK crash dump.
- /FANDLES
Displays the data on the process' fast I/O handles.
- /FID_ONLY
When used with /CHANNEL or /PROCESS_SECTION_TABLE (/PST), causes SDA to not attempt to translate the FID (File ID) to a file name when invoked with ANALYZE/SYSTEM.
- /FREE
When used with /POOL, displays the entire contents, both allocated and free, of the specified region or regions of pool. Use the /FREE qualifier with a range to show all of the used and free pool in the given range.
- /GSTX=index
When used with the /PAGE_TABLES qualifier, displays only page table entries for the specific global section.
- /HEADER
When used with /POOL, displays only the first 16 bytes of each data packet found within the specified region or regions of pool.
- /IMAGES [= {name|ALL} ]
For all images in use by this process, displays the address of the image control block, the start and end addresses of the image, the activation code, the protected and shareable flags, the image name, and the major and minor IDs of the image. The /IMAGES=ALL qualifier also displays the base, end, image offset, section type, and global pointer for all images (IA-64) or for all installed resident images (Alpha) in use by this process. The /IMAGE=name qualifier displays this information for just the specified images; name may contain wildcards.
See the VSI OpenVMS Linker Utility Manual and the Install utility chapter in the VSI OpenVMS System Management Utilities Reference Manual for more information on images installed using the /RESIDENT qualifier.
- /ID=nn
- /INDEX=nn
Specifies the process for which information is to be displayed by its index into the system's list of software process control blocks (PCBs), or by its process identification (ID). /ID and /INDEX can be used interchangeably. You can supply the following values for nn:
The process index itself.
The process identification (PID) or extended PID longword, from which SDA extracts the correct index. You can specify the PID or extended PID of any thread of a process with multiple kernel threads. Any thread-specific data displayed by SHOW PROCESS will be for the given thread.
To obtain these values for any given process, issue the SDA command SHOW SUMMARY/THREADS.
- /INVALID_PFN [=option]
The /INVALID_PFN qualifier, which is valid only on platforms that supply an I/O memory map, causes SDA to display only page table entries that map to PFNs that are not in the system's private memory or in Galaxy-shared memory, and which are not I/O access pages. Use of /INVALID_PFN implies /PAGE_TABLES.
The /INVALID_PFN qualifier allows two optional keywords, READONLY and WRITABLE. If neither keyword is given, all relevant pages are displayed. If you specify READONLY, only pages marked for no write access are displayed. If you specify WRITABLE, only pages that allow write access are displayed. For example, SHOW PROCESS ALL/PAGE_TABLE=ALL/INVALID_PFN=WRITABLE would display all process pages (for all processes) whose protection allows write, but which map to PFNs that do not belong to this system.
- /L1
- /L2
- /L3 (D)
Used with the /PAGE_TABLES qualifier to specify the level for which page table entries are to be displayed. You can specify only one level. /L3 is the default.
- /LOCKS [/BRIEF]
Displays the lock management locks owned by the current process.
When specified with /BRIEF, produces a display similar in format to that produced by the SHOW LOCKS command; that is, it causes SDA to display each lock owned by the current process in brief format with one line for each lock. Table 4.3, ''Contents of the SHOW LOCKS and SHOW PROCESS/LOCKS Displays'' contains additional information.
- /MAXIMUM_BYTES [=n]
When used with /POOL, displays only the first n bytes of a pool packet; if you specify /MAXIMUM_BYTES without a value, the default is 64 bytes.
- /NEXT
Locates the next valid process in the system's process list and selects that process. If there are no further valid processes in the system's process list, SDA returns an error.
- /NONMEMORY_PFN [=option]
The /NONMEMORY_PFN qualifier causes SDA to display only page table entries that are in neither the system's private memory nor in Galaxy-shared memory. Use of /NONMEMORY_PFN implies /PAGE_TABLES.
The /NONMEMORY_PFN qualifier allows two optional keywords, READONLY and WRITABLE. If neither keyword is given, all relevant pages are displayed. If you specify READONLY, only pages marked for no write access are displayed. If you specify WRITABLE, only pages that allow write access are displayed. For example, SHOW PROCESS ALL/PAGE_TABLE=ALL/NONMEMORY_PFN=WRITABLE would display all process pages (for all processes) whose protection allows write, but which map to PFNs that are in neither the system's private memory nor Galaxy-shared memory.
- /P0 (D)
- /P1
- /P2
- /PT
When used with the /PAGE_TABLES qualifier, /P0, /P1, /P2, and /PT specify one or more regions for which page table entries should be displayed. You can specify any or none of these values. The default is /P0.
- /PAGE_TABLES
Displays the page tables of the process P0 (process), P1 (control), P2, or PT (page table) region, or, optionally, page table entries for a range of addresses. You can use /PAGE_TABLES=ALL to display page tables of all four regions. With /Ln, the page table entries at the level specified by /L1, /L2, or /L3 (the default) are displayed.
With /RDE=id or /REGIONS=id, SDA displays the page tables for the address range of the specified address region. When you do not specify an ID, the page tables are displayed for all the process-permanent and user-defined regions.
If /PTE_ADDRESS is given, the range is expressed using the following syntax:
m Displays the single page table entry at address m m:n Displays the page table entries from address m to address n m;n Displays n bytes of page table entries starting at address m If /PTE_ADDRESS is not given, then range is expressed using the following syntax:
m Displays the single page table entry that corresponds to virtual address m m:n Displays the page table entries that correspond to the range of virtual addresses from m to n m;n Displays the page table entries that correspond to a range of n bytes starting at virtual address m See Section 2.8, ''Page Protections and Access Rights'' for information on page protections and access.
The /GSTX=index qualifier causes SDA to display only the page table entries for the pages in the specified global section.
The /SECTION_INDEX=n qualifier causes SDA to display only the page table entries for the pages in the specified process section.
- /PCB
Displays the information contained in the process control block (PCB). This is the default behavior of the SHOW PROCESS command.
- /PERSONA [=address]
Displays all persona security blocks (PSBs) held in the PERSONA ARRAY of the process, and then lists selected information contained in each initially listed PSB. The selected information includes the contents of the following cells inside the PSB:
Flags
Reference count
Execution mode
Audit status
Account name
UIC
Privileges
Rights enabled mask
If you specify a PSB address, this information is provided for that specific PSB only.
If you also specify /RIGHTS, SDA expands the display to provide additional selected information, including all the rights and their attributes currently held and active for each persona security block (PSB) specified with the /PERSONA qualifier.
If you specify /RIGHTS/AUTHORIZED, SDA also displays additional selected information, including all the rights and their attributes authorized for each persona security block (PSB) specified with the /PERSONA qualifier.
- /PHD
Lists the information included in the process header (PHD).
- /POOL [= {P0 | P1 | IMGACT | ALL (D)} | range]
Displays the dynamic storage pool in the process' P0 (process) region, the P1 (control) region, or the image activator's reserved pages, or optionally, a range of addresses. The default action is to display all dynamic storage pools.
You can express a range using the following syntax:
m:n Displays the process pool in the range of virtual addresses from m to n. m;n Displays process pool in a range of n bytes, starting at virtual address m. - /PPT
See the description of /PAGE_TABLES, which is functionally equivalent to /PPT.
- /PROCESS_SECTION_TABLE [/SECTION_INDEX=id][/FID_ONLY]
Lists the information contained in the process section table (PST). The /SECTION_INDEX=id qualifier used with /PROCESS_SECTION_TABLE displays the process section table entry for the specified section.
- /PST
Is a synonym for /PROCESS_SECTION_TABLE.
- /PT
When used with the /PAGE_TABLES qualifier, displays the page table entries for the page table space of the process. By default, P0 space is displayed.
- /PTE_ADDRESS
When used with the /PAGE_TABLES qualifier, specifies that the range is of PTE addresses instead of the virtual addresses mapped by the PTE.
- /RDE [=id]
- /REGIONS [=id]
Lists the information contained in the process region table for the specified region. If you do not specify a region, the entire table is displayed, including the process-permanent regions. /RDE and /REGIONS are functionally equivalent. When used with /PAGE_TABLES, this qualifier causes SDA to display the page tables for only the specified region or, by default, for all regions.
- /REGISTERS
Lists the hardware context of the process, as reflected in the process registers stored in the hardware privileged context block (HWPCB), in its kernel stack, and possibly, in its PHD.
- /RIGHTS
Used with the /PERSONA qualifier. See the /PERSONA/RIGHTS description for use of the /RIGHTS qualifier.
- /RING_BUFFER [={ALL | address}]
Displays the contents of the process-pool history ring buffer. Entries are displayed in reverse chronological order (most recent to least recent). If you specify /RING_BUFFER without the ALL keyword or an address, SDA displays all unmatched current allocations and deallocations. Use /RING_BUFFER=ALL to display matched allocations and deallocations and any non-current entries not yet overwritten. Use /RING_BUFFER=address to limit the display to only allocations and deallocations of blocks that contain the given address (including matched allocations and deallocations).
- /RMS [= (option[,...]) ]
Displays certain specified RMS data structures for each image I/O or process-permanent I/O file the process has open. To display RMS data structures for process-permanent files, specify the PIO option to this qualifier. Other guidelines for specifying this qualifier include the following:
If you specify only one option, you can omit the parentheses.
You can add additional structures to those already set by the SET RMS command by beginning the list of options with an asterisk (*).
You can exclude a structure from those set by the SET RMS command by specifying its keyword option preceded by NO (for example, NOPIO).
SDA determines the structures to be displayed according to either of the following methods:
If you provide the name of a structure or structures in the option parameter, SHOW PROCESS/RMS displays information from only the specified structures. (See Table 4.2, ''SET RMS Command Keywords for Displaying Process RMS Information'' in the SET RMS command description for a list of keywords that you can supply as options.)
If you do not specify an option, SHOW PROCESS/RMS displays the current list of options as shown by the SHOW RMS command and set by the SET RMS command.
- /SECTION_INDEX=n
When used with the /PAGE_TABLES qualifier, displays the page table for the range of pages in the specified process section. You can also specify one of the qualifiers /L1, /L2, or /L3.
When used with the /PROCESS_SECTION_TABLE qualifier, displays the PST for the specified process section.
The /SECTION_INDEX=n qualifier is ignored if you do not specify either the /PAGE_TABLES or the /PROCESS_SECTION_TABLE qualifier.
- /SEMAPHORE
Displays the Inner Mode Semaphore for a multithreaded process.
- /STATISTICS
When used with /POOL, displays statistics on the free list(s) in process pool.
- /SUBTYPE=packet-type
When used with /POOL, displays only packets of the specified subtype. Pool packet types found in the process pool can include logical names (LNM) and image control blocks (IMCB). /SUBTYPE is functionally equivalent to /TYPE.
- /SUMMARY
When used with /POOL, displays only an allocation summary for each packet type.
- /SYSTEM
Displays the system's process control block. The system PCB and process header (PHD) parallel the data structures that describe processes. They contain the system working set, global section table, global page table, and other systemwide data.
- /THREADS
Displays the software and hardware context of all the threads associated with the current process.
- /TQE [=ALL]
Displays all timer queue entries associated with the current process. If specified as /TQE, a one-line summary is output for each TQE. If specified as /TQE=ALL, a detailed display of each TQE is output. See Table 4-32 for an explanation of TQE types in the one-line summary.
- /TYPE=packet-type
When used with /POOL, displays only packets of the specified type. Pool packet types found in the process pool can include logical names (LNM) and image control blocks (IMCB). /TYPE is functionally equivalent to /SUBTYPE.
- /UNUSED
When used with /POOL, displays only free packets.
- /UNWIND_TABLE [= {ALL | name} ]
Valid for Intergrity server systems only.
If specified without a keyword, displays the master unwind table for the process. SHOW PROCESS/UNWIND=ALL displays the details of every process unwind descriptor. SHOW PROCESS/UNWIND=name displays the details of every unwind descriptor for the named image or images implied by a wildcard. To look at unwind data for a specific PC in process space, use SHOW UNWIND address.
If some or all unwind data for an image is not included in the system dump (for example, if it was not in the working set of the process at the time of the system crash), a SHOW PROCESS/UNWIND command can fail with a %SDA-W-NOREAD error because the unwind data is inaccessible. Collecting unwind data using the SDA commands COLLECT and COPY/COLLECT will not correct this because the collected unwind data is used only by SHOW UNWIND address and SHOW CALL.
- /WORKING_SET_LIST [={PPT|PROCESS|LOCKED|GLOBAL|MODIFIED|n}]
Displays the contents of the requested entries of the working set list for the process. If you do not specify an option, all working set list entries are displayed. This qualifier is functionally equivalent to /WSL.
The table shows the options available with SHOW PROCESS/WORKING_SET_LIST.
Table 4.16. Options for the /WORKING_SET_LIST Qualifier Options Results PPT Displays process page table pages PROCESS Displays process-private pages LOCKED Displays pages locked into the process' working set GLOBAL Displays global pages currently in the working set of the process MODIFIED Displays working set list entries marked modified n Displays a specific working set list entry, where n is the working set list index (WSLX) of the entry of interest - /WSL
See /WORKING_SET_LIST, which is functionally equivalent to /WSL.
Description
The SHOW PROCESS command displays information about the process specified by process-name, the process specified in the /ID or /INDEX qualifier, the next process in the system's process list, the system process, or all processes. The SHOW PROCESS command performs an implicit SET PROCESS command under certain uses of its qualifiers and parameters, as noted previously. By default, the SHOW PROCESS command produces information about the SDA current process, as defined in Section 2.5, ''SDA Context''.
The default of the SHOW PROCESS command provides information taken from the software process control block (PCB) and the kernel threads block (KTB) of the SDA current thread. This is the first display provided by the /ALL qualifier and the only display provided by the /PCB qualifier. This information describes the following characteristics of the process:
Software context
Condition-handling information
Information on interprocess communication
Information on counts, quotas, and resource usage
Among the displayed information are the process PID, EPID, priority, job information block (JIB) address, and process header (PHD) address. SHOW PROCESS also describes the resources owned by the process, such as event flags and mutexes. The "State" field records the current scheduling state for the thread, and indicates the CPU ID of any thread whose state is CUR. See Table 4.26, ''Current State Information'' for a list of all possible states.
The /THREADS qualifier (also part of SHOW PROCESS/ALL), displays information from the KTBs of all threads in the process, instead of only the SDA current thread.
The SHOW PROCESS/ALL command displays additional process-specific information, also provided by several of the individual qualifiers to the command.
The process registers display, also produced by the /REGISTERS qualifier, describes the process hardware context, as reflected in its registers. The registers displayed are those of the SDA current thread, or of all threads if either the /THREADS or the /ALL qualifier have been specified.
A process hardware context is stored in the following locations:
If the process is currently executing on a processor in the system (that is, in the CUR scheduling state), its hardware context is contained in that processor's registers. (That is, the process registers and the processor's registers contain identical values, as illustrated by a SHOW CPU command for that processor or a SHOW CRASH command, if the process was current at the time of the system failure.)
If the process is not executing, its privileged hardware context is stored in the part of the PHD known as the HWPCB. Its integer register context is stored on its kernel stack. Its floating-point registers are stored in its PHD.
The process registers display first lists those registers stored in the HWPCB, kernel stack, and PHD ("Saved process registers"). If the process to be displayed is currently executing on a processor in the system, the display then lists the processor's registers ("Active registers for the current process"). In each section, the display lists the registers in groups.
For Alpha:
Integer registers (R0 through R29)
Special-purpose registers (PC and PS)
Stack pointers (KSP, ESP, SSP, and USP)
Page table base register (PTBR)
AST enable and summary registers (ASTEN and ASTSR)
Address space number register (ASN)
For IA-64:
Integer registers (R1 through R11, R13 through R31). Note that R1 is displayed as GP (Global Pointer) and R12 is omitted.
Special-purpose registers (PC, PSR, ISR). Note: The PC is the combination of the IP and the slot number from the PSR.
Stack pointers (KSP, ESP, SSP, and USP)
Register stack pointers (KBSP, EBSP, SBSP, and UBSP)
Page table base register (PTBR0)
AST enable and summary registers (ASTEN and ASTSR)
Address space number registers (ASN0)
Floating point registers (F2 through F31, possibly F32 through F127)
The semaphore display, also produced by the /SEMAPHORE qualifier, provides information on the inner-mode semaphore used to synchronize kernel threads. The PC history log, recorded if the system parameter SYSTEM_CHECK is enabled, is also displayed.
The process header display, also produced by the /PHD qualifier, provides information taken from the PHD, which is swapped into memory when the process becomes part of the balance set. Each item listed in the display reflects a quantity, count, or limit for the process use of the following resources:
Process memory
The pager
The scheduler
Asynchronous system traps
I/O activity
CPU activity
The working set information and working set list displays, also produced by the /WORKING_SET_LIST qualifier, describe those virtual pages that the process can access without a page fault. After a brief description of the size, scope, and characteristics of the working set list itself, SDA displays information for each entry in the working set list as shown in the table below.
| Column | Contents |
|---|---|
| INDEX | Index into the working set list at which information for this entry can be found |
| ADDRESS | Virtual address of the page that this entry describes |
| STATUS |
Four columns that list the following status information:
|
When SDA locates either one or more unused working set entries, or entries that do not match the specified option, it issues the following message:
---- n entries not displayed
The process section table information and process section table displays, also produced by the /PROCESS_SECTION_TABLE or /PST qualifier, list each entry in the process section table (PST) and display the offsets to, and the indexes of, the first free entry and last used entry.
SDA displays the information listed in the table below for each PST entry.
| Part | Definition |
|---|---|
| INDEX | Index number of the entry. Entries in the process section table begin at the highest location in the table, and the table expands toward lower addresses. |
| ADDRESS | Address of the process section table entry. |
| SECTION ADDRESS | Virtual address that marks the beginning of the first page of the section described by this entry. |
| CCB | Address of the channel control block on which the section file is open. |
| PAGELETS | Length of the process section. This is in units of pagelets, except for a PFN-mapped section in which the units are pages. |
| VBN | Virtual block number. The number of the file's virtual block that is mapped into the section's first page. |
| WINDOW | Address of the window control block on which the section file is open. |
| REFCNT | Number of pages of this section that are currently mapped. |
| FLINK | Forward link. The pointer to the next entry in the PST list. |
| BLINK | Backward link. The pointer to the previous entry in the PST list. |
| FLAGS | Flags that describe the access that processes have to the process section. |
In addition, for each process section that has an associated file, the device and/or file name is displayed. For details of this display, see Table 4.20, ''Process I/O Channel Information in the SHOW PROCESS Display''.
The regions display, also produced by the either of the /RDE or /REGIONS qualifiers, shows the contents of the region descriptors. This includes the three default regions (P0, P1, P2), plus any others created by the process. A single region will be displayed if you specify its identifier. The information displayed for each region includes the RDE address, the address range of the region, its identifiers and protection, and links to other RDEs.
If you use the /PAGE_TABLE or /PPT qualifier with /RDE or /REGION, the page table for the region is also displayed, as described below.
The P0 page table, P1 page table, P2 page table, and PT page table displays, also produced by the /PAGE_TABLES qualifier, display listings of the process page table entries in the same format as that produced by the SHOW PAGE_TABLE command (see Tables Table 4.4, ''Virtual Page Information in the SHOW PAGE_TABLE Display'' through Table 4.9, ''Locations of Physical Pages'').
The RMS display, also produced by the /RMS qualifier, provides information on the RMS internal data structures for all RMS-accessed open files. The data structures displayed depend on the current setting of RMS options, as described under the SET RMS command and Table 4.2, ''SET RMS Command Keywords for Displaying Process RMS Information''.
The locks display, also produced by the /LOCKS qualifier, provides information on the locks held by the process. For a full description of the information displayed for process locks, see the SHOW LOCKS command and Table 4.3, ''Contents of the SHOW LOCKS and SHOW PROCESS/LOCKS Displays''. You can also specify the /BRIEF qualifier, which provides single-line summary of each process lock; however, no other qualifiers from SHOW LOCKS apply to SHOW PROCESS/LOCKS.
The process active channels display, also produced by the /CHANNEL qualifier, displays the information in Table 4.19, ''Process Active Channels in the SHOW PROCESS Display'' for each I/O channel assigned to the process.
| Column | Contents |
|---|---|
| Channel | Number of the channel. |
| CCB | The address of the channel control block (CCB). |
| Window | Address of the window control block (WCB) for the file if the device is a file-oriented device; zero otherwise. |
| Status | Status of the device: "Busy" if the device has an I/O operation outstanding; "Dpnd" if the device is deaccess pending; blank otherwise. |
| Device/file accessed | Name of the device and, if applicable, name of the file being accessed on that device. |
The information listed under the heading "Device/file accessed" varies from channel to channel and from process to process. SDA displays certain information according to the conditions listed in the table below.
| Information Displayed1 | Type of Channel |
|---|---|
| dcuu: | SDA displays this information for devices that are not file structured, such as terminals, and for processes that do not open files in the normal way. |
| dcuu: filespec | SDA displays this information only if you are examining a running system, and only if your process has enough privilege to translate the file-id into the filespec, or if you are examining a dump for which file identification data 2 has been collected. |
| dcuu:( file-id) | The file-id no longer points to a valid filespec, as when you look at a dump that does not have file identification data 2; or the process in which you are running SDA does not have enough privilege to translate the file-id into the corresponding filespec. |
| (section file) | The file in question is mapped into the process' memory. |
The images display, also produced by the /IMAGES qualifier, describes the activated images in the process. SDA displays the information listed in the table below for each image, plus a summary line giving the total image and total page counts.
| Item | Description |
|---|---|
| Image Name | The name of the image. |
| Link Time | The date and time the image was linked. These items are only displayed with SHOW PROCESS/IMAGE=ALL or SHOW PROCESS/ALL. |
| Section Type | For shareable images, the data for each image section is displayed on a separate line. For privileged shareable images, data for the change mode vector is also displayed on a separate line. These items are only displayed with SHOW PROCESS/IMAGE=ALL or SHOW PROCESS/ALL. |
| Start | Start address of the image in process memory. For resident shareable images, this is the start address of the process-space portion of the image. Alpha only. |
| End | End address of the image in process memory. For resident shareable images, this is the end address of the process-space portion of the image. Alpha only. |
| Type | The image type and/or activation method, plus "PROT" for protected images and "SHR" for shareable images. |
| File ID | The File ID for the image file. No attempt is made to translate this to a file name. These items are only displayed with SHOW PROCESS/IMAGE=ALL or SHOW PROCESS/ALL. |
| IMCB | The address of the Image Management Control Block. |
| GP | The Global Pointer for the image. (IA-64 only) |
| Sym Vect | The address of the image's symbol vector, if any. These items are only displayed with SHOW PROCESS/IMAGE=ALL or SHOW PROCESS/ALL. |
| Maj, Minor ID | The major and minor revision IDs for the image. These items are only displayed with SHOW PROCESS/IMAGE=ALL or SHOW PROCESS/ALL. Alpha only. |
| Maj, Min ID, Match | The major and minor revision IDs for the image, plus the match control bits. These items are only displayed with SHOW PROCESS/IMAGE=ALL or SHOW PROCESS/ALL. (IA-64 only) |
| Base | For Alpha shareable images and all IA-64 images, the base address of each image section and/or the change mode vector. These items are only displayed with SHOW PROCESS/IMAGE=ALL or SHOW PROCESS/ALL. |
| End | For Alpha shareable images and all IA-64 images, the end address of each image section and/or the change mode vector. These items are only displayed with SHOW PROCESS/IMAGE=ALL or SHOW PROCESS/ALL. |
| ImageOff | For Alpha shareable images and all IA-64 images, the virtual offset within the image file for each image section. These items are only displayed with SHOW PROCESS/IMAGE=ALL or SHOW PROCESS/ALL. |
The buffer objects display, also produced by the /BUFFER_OBJECTS qualifier, describes the buffer objects in use by the process. Information displayed by SDA for each buffer object includes its address, access mode, size, flags, plus the base virtual address of the object in process space and system space.
The fast I/O handles display, also produced by the /FANDLES qualifier, describes the fast I/O handles used by the process. Information displayed by SDA includes the address and size of the fast I/O handle vector header, then the address, corresponding IRP, state, and buffer object handles for each fast I/O handle, plus information on free vector entries.
The persona display, also produced by the /PERSONA qualifier, describes the Persona status block data structures. The default output of /PERSONA consists of summary information for all personae in use by the process (the PSB address, flags, user name) and information for each persona (privilege masks, UIC, and so on). When you specify /PERSONA/RIGHTS (as in SHOW PROCESS/ALL), all the rights currently held and active for each persona are also displayed. When you specify /PERSONA/RIGHTS/AUTHORIZED, all the rights authorized for each persona are displayed instead.
The pool display, also produced by the /POOL qualifier, describes the P0, P1 and IMGACT process pools. The default output of /POOL is the entire contents of each used block of pool. When you specify /POOL/HEADER (as in SHOW PROCESS/ALL), only the first 16 bytes of each used pool block is displayed. By default, all process pools are displayed. You can limit this using /POOL=P0, /POOL=P1 or /POOL=IMGACT. See the description of the SHOW POOL command for explanations of other qualifiers.
The Timer Queue Entry (TQE) display, also produced by the /TQE qualifier, describes all timer queue entries that affect the process. The default display (as in SHOW PROCESS/ALL) is a one-line summary of each TQE. If you specify /TQE=ALL, a detailed display of each TQE is given. No other qualifiers from the SHOW TQE command apply to SHOW PROCESS/TQE.
Examples
SDA>  SHOW PROCESS
Process index: 0028   Name: SYSTEM   Extended PID: 000000E8
-----------------------------------------------------------
Process status:          02040001  RES,PHDRES,INTER
        status2:         00000000

PCB address              81444A40    JIB address              81443600
PHD address              821AA000    Swapfile disk address    00000000
KTB vector address       81444D2C    HWPCB address            821AA080
Callback vector address  00000000    Termination mailbox          0000
Master internal PID      00030028    Subprocess count                0
Creator extended PID     00000000    Creator internal PID     00000000
Previous CPU Id          00000000    Current CPU Id           00000000
Previous ASNSEQ  0000000000000003    Previous ASN     0000000000000017
Initial process priority        4    # open files remaining        100/100
Delete pending count            0    Direct I/O count/limit        150/150
UIC                [00001,000004]    Buffered I/O count/limit      149/150
Abs time of last event   01F1A51D    BUFIO byte count/limit      99424/99808
# of threads                    1    ASTs remaining                248/250
Swapped copy of LEFC0    00000000    Timer entries remaining        20/20
Swapped copy of LEFC1    00000000    Active page table count         0
Global cluster 2 pointer 00000000    Process WS page count          43
Global cluster 3 pointer 00000000    Global WS page count           28

Thread index: 0000
------------------
Current capabilities:    System: 0000000C  QUORUM,RUN
                         User:   00000000
Permanent capabilities:  System: 0000000C  QUORUM,RUN
                         User:   00000000
Current affinities:      00000000
Permanent affinities:    00000000
Thread status:           02040001
       status2:          00000000

KTB address              81444A40    HWPCB address            821AA080
PKTA address             7FFEFF98    Callback vector address  00000000
Internal PID             00030028    Callback error           00000000
Extended PID             000000E8    Current CPU id           00000000
State                       LEF      Flags                    00000000
Base priority                   4    Current priority                5
Waiting EF cluster              0    Event flag wait mask     DFFFFFFF
CPU since last quantum       FFF8    Mutex count                     0
ASTs active                  NONE
The SHOW PROCESS command displays information taken from the software PCB of SYSTEM, the SDA current process. According to the State field in the display, process SYSTEM is in Local Event Flag Wait.
SDA> SHOW PROCESS/BUFFER_OBJECTS/FANDLES

Process index: 0022   Name: NODEA_RTA1:   Extended PID: 00000062
-----------------------------------------------------------------


                           Process Buffer Objects
                           ----------------------

ADDRESS  ACMODE SEQUENCE  REFCNT    PID     PAGCNT      BASE PVA          BASE SVA
-------- ------ -------- -------- -------- -------- ----------------- -----------------
8151AE00 User   00000011 00000031 00010022 00000001 00000000.00084000 FFFFFFFF.7DE68000 S2_WINDOW
814A6CC0 User   00000012 00000009 00010022 00000001 00000000.80000000 FFFFFFFF.7DE66000 S2_WINDOW
814FBA00 User   00000013 00000009 00010022 00000001 00000000.80000000 FFFFFFFF.FFFFFFFF NOSVA
81512200 User   00000014 00000009 00010022 00000001 00000000.80028000 FFFFFFFF.7DE64000 S2_WINDOW
8151A8C0 User   00000015 00000009 00010022 00000001 00000000.80028000 FFFFFFFF.FFFFFFFF NOSVA
81438580 User   00000016 00000009 00010022 00000001 FFFFFEFB.FF800000 FFFFFFFF.7DE62000 S2_WINDOW
81464480 User   00000017 00000009 00010022 00000001 FFFFFEFB.FF800000 FFFFFFFF.FFFFFFFF NOSVA
81416F00 Kernel 00000018 00000001 00010022 00000001 00000000.7FF76000 FFFFFFFF.8120C000 NOQUOTA


                  Fandle Vector Header
                  --------------------

Address   Maxfix  Real_Size CCB buffer handle
-------- -------- --------- -----------------
7FF68290 00000043  00000880 00000018.81416F00


                         Fandles
                         -------

Address     IRP   fastio_done  Orgfun   Data bo handle     IOSA bo handle        DBYLEN
-------- -------- ----------- -------- ----------------- ----------------- -----------------
7FF682B0 815CEF40     set     00020031 00000016.81438580 00000011.8151AE00 00000000.00002000
7FF682D0 815CE4C0     set     00020030 00000016.81438580 00000011.8151AE00 00000000.00002000
7FF682F0 815CE200     set     00000031 00000016.81438580 00000011.8151AE00 00000000.00002000
7FF68310 815D4B80     set     00000030 00000016.81438580 00000011.8151AE00 00000000.00002000
7FF68330 815D65C0     set     00020031 00000015.8151A8C0 00000011.8151AE00 00000000.00002000
7FF68350 815D6880     set     00020030 00000015.8151A8C0 00000011.8151AE00 00000000.00002000

   .
   .
   .

7FF68810 815D6B40     set     00020031 00000013.814FBA00 00000011.8151AE00 00000000.00002000
7FF68830 815D5880     set     00020030 00000013.814FBA00 00000011.8151AE00 00000000.00002000

                     -----    00000013 free FVEs (IRP = 00000000)              VA   7FF68850
                                                                               -to- 7FF68A90

7FF68AB0 815D9840     set     00020031 00000017.81464480 00000011.8151AE00 00000000.00002000
7FF68AD0 815CD040     set     00020030 00000017.81464480 00000011.8151AE00 00000000.00002000
7FF68AF0 815CB480     set     00000031 00000017.81464480 00000011.8151AE00 00000000.00002000)
The SHOW PROCESS/BUFFER_OBJECTS/FANDLES command displays all the buffered objects and fast I/O handles that a process has created.
SDA> SHOW PROCESS JOB_CONTROL/TQE
Process index: 000C   Name: JOB_CONTROL   Extended PID: 0000004C
----------------------------------------------------------------

                            Timer queue entries
                            -------------------

  TQE
address                 Expiration Time                 Type
--------   -----------------------------------------   ------
81504080   00A05ABD.895F93C5 27-NOV-2001 11:17:17.37   TSD---
815026C0   00A05AC3.80D0E000 27-NOV-2001 12:00:00.00   TSA---
81502180   00A0C160.635594EF  7-APR-2002 02:00:00.12   TSA---
This example shows the timer queue entries for the process JOB_CONTROL. See Table 4.27, ''TQE Types in Summary TQE Display'' for an explanation of the Type codes.
SDA> SHOW PROCESS /IMAGE


Process index: 0005   Name: SA_STARTUP_DCL   Extended PID: 00000025
-------------------------------------------------------------------)

                     Process activated images
                     ------------------------

         Image Name             Type       IMCB          GP
--------------------------- ------------ -------- -----------------
SDA                         MAIN         7FE86EB0 00000000.00230000
SDA$SHARE                   GLBL         7FE86190 00000000.00636000
SMGSHR                      GLBL         7FE87830 00000000.00706000
...

Total images = 17                       Pages allocated = 2165
This example includes the GP (global pointer) for all images in the process.
SDA> SHOW PROCESS/IMAGE=SDA

Process index: 0005   Name: SA_STARTUP_DCL    Extended PID: 00000025
--------------------------------------------------------------------

                            Process activated images
                            ------------------------

   Image Name/Link Time/Section Type    Type/File Id   IMCB   Sym Vect Maj,Min ID,Match
--------------------------------------- ------------ -------- -------- ---------------- *** see below ***
SDA                                     MAIN         7FE86EB0          231F,85F10A8C,01
 17-MAY-2004 10:55:33.89                (1346,1,0)
                                   Code
                       Data (read only)
                             Short data
                                  Fixup

*** Rightmost columns from above output moved here ***

      Base               End        ImageOff
----------------- ----------------- --------
             GP = 00000000.00230000

00000000.00010000 00000000.0001022F 00010000
00000000.00020000 00000000.000200EF 00020000
00000000.00030000 00000000.00030077 00030000
00000000.80000000 00000000.800003FF 80000000
This example includes the GP (global pointer) for the SDA image.
4.64. SHOW RAD
Displays the settings and explanations of the RAD_SUPPORT system parameter fields, and the assignment of CPUs and memory to the Resource Affinity Domains (RADs). This command is only useful on platforms that support RADs. By default, the SHOW RAD command displays the settings of the RAD_SUPPORT system parameter fields.
Format
SHOW RAD [number | /ALL | /PXML]
Parameter
- number
Displays information on CPUs and memory for the specified RAD.
Qualifiers
- /ALL
Displays settings of the RAD_SUPPORT parameter fields and the CPU and memory assignments for all RADs.
- /PXML (IA-64 only)
SDA displays the proximity database derived from the Advanced Configuration and Power Interface (ACPI) tables. The proximity database is used to set up the RAD data structures.
Examples
SDA> SHOW RAD
Resource Affinity Domains
-------------------------

    RAD information header address: FFFFFFFF.81032340
    Maximum RAD count:                       00000008
    RAD containing SYS$BASE_IMAGE:           00000000
    RAD support flags:                       0000004F

     3         2 2         1 1
     1         4 3         6 5         8 7         0
    +-----------+-----------+-----------+-----------+
    |..|..| skip|ss|gg|ww|pp|..|..|..|..|.p|fs|cr|ae|
    +-----------+-----------+-----------+-----------+
    |..|..|    0| 0| 0| 0| 0|..|..|..|..|.1|00|11|11|
    +-----------+-----------+-----------+-----------+

    Bit 0 = 1:          RAD support is enabled

    Bit 1 = 1:          Soft RAD affinity support is enabled
                        (Default scheduler skip count of 16 attempts)

    Bit 2 = 1:          System-space replication support is enabled

    Bit 3 = 1:          Copy on soft fault is enabled

    Bit 4 = 0:          Default RAD-based page allocation in use

                        Allocation Type               RAD choice
                        ---------------               ----------
                        Process-private pagefault     Home
                        Process creation or inswap    Random
                        Global pagefault              Random
                        System-space page allocation  Current

    Bit 5 = 0:          RAD debug feature is disabled

    Bit 6 = 1:          Per-RAD non-paged pool is enabled
This example shows the settings of the RAD_SUPPORT system parameter fields.
SDA> SHOW RAD 2 Resource Affinity Domain 0002 ----------------------------- CPU sets: Active 08 10 11 Active 08 10 11 Configure 08 09 10 11 Potential 08 10 11 PFN ranges: Start PFN End PFN PFN count Flags --------- -------- --------- ----- 01000000 0107FFE7 0007FFE8 000A OpenVMS Base 0107FFE8 0107FFFF 00000018 0009 Console Base SYSPTBR: 01002A01 RAD data: B817C000
This example shows information on the CPUs and memory for RAD 2.
4.65. SHOW RESOURCES
Displays information about all resources in the system or about a resource associated with a specific lock.
Format
SHOW RESOURCES [ /ADDRESS=n
| /ALL (d)
| /BRIEF
| /CACHED
| /CONTENTION [=ALL][/FULL]
| /LOCKID=lock-id
| /LIST
| /NAME=name
| /OWNED
| /STATUS=(keyword[,...]) ]
Parameters
None.
Qualifiers
- /ADDRESS=n
Displays information from the resource block at the specified address.
- /ALL
Displays information from all resource blocks (RSBs) in the system. This is the default behavior of the SHOW RESOURCES command.
- /BRIEF
Displays a single line of information for each resource.
- /CACHED
Displays resource blocks that are no longer valid. The memory for these resources is saved so that later requests for resources can use them.
- /CONTENTION [=ALL]
Displays only resources that have at least one lock on either the waiting or conversion queue. Unless you specify the ALL keyword, resources with locks on the waiting or conversion queues that are not participating in deadlock searches are ignored. (Locks not participating in deadlock searches are requested with either the LCK$M_NODLCKWT or LCK$M_NODLCKBLK flags.) By default, a single line summary is displayed for each resource, followed by a single line summary for each lock on the resource. Use /FULL to obtain a detailed display for each resource that is in contention.
- /FULL
When used with /CONTENTION [=ALL], causes SDA to display details of each resource that is in contention instead of a single line summary.
- /LIST
Displays summary information for each resource, followed by a list of all locks associated with the resource.
- /LOCKID=lock-id
Displays information on the resource associated with the lock with the specified lock-id.
- /NAME=name
Displays information about the specific resource. Name may be the actual name of the resource, if it only contains uppercase letters, numerals, the underscore (_), dollar sign, colon (:), and some other printable characters, as for example, /NAME=MY_LOCK. If it contains other printable characters (including lowercase letters), you may need to enclose the name in quotation marks (""), as for example, /NAME="My_Lock/47". If it contains nonprintable characters, the name may be specified as a comma-separated list comprised of strings and hexadecimal numbers, as for example, /NAME=("My_Lock",0C00,"/47") would specify the name "My_Lock<NUL><FF>/47". The hexadecimal number can be no more than 8 digits (4 bytes) in length. Nonprintable sequences or more than 4 bytes must be split into multiple hexadecimal numbers. The maximum length of a resource name is 32 characters.
- /OWNED
Displays only owned resources.
- /STATUS=(keyword[,...])
Displays only resources that have the specified status bits set in the RSB$L_STATUS field. If you specify only one keyword, you can omit the parentheses. Status keywords are as follows:
Keyword Meaning 2PC_IP Indicates a two-phase convert operation in progress BRL Indicates byte range resource CHK_BTR Checks for better master CVTFULRNG Indicates full-range requests in convert queue CVTSUBRNG Indicates sub-range requests in convert queue DIRENTRY Indicates directory entry during failover DIR_IP Creates directory entry DIR_RQD Indicates directory entry required INVPEND Checks for value block invalidation RBLD_ACT Indicates lock rebuild active for this tree RBLD_IP Indicates rebuild operation in progress RBLD_RQD Indicates rebuild required for this resource tree RM_ACCEPT Accepts new master RM_DEFLECT Deflects remote interest RM_FORCE Forces tree move RM_FREEZE Freeze resource tree on this node RM_INTEREST Remaster due to master having no interest RM_IP Indicates resource remaster in progress RM_PEND Indicates a pending resource remaster operation RM_RBLD Indicates to always rebuild resource tree RM_WAIT Blocks local activity VALCUR Indicates value block is current VALINVLD Indicates value block invalid WTFULRNG Indicates full-range requests in wait queue WTSUBRNG Indicates a sub-range requests in wait queue XVAL_VALID Indicates last value block was long block
Description
The SHOW RESOURCES command displays the information listed in Table 4.22, ''Resource Information in the SHOW RESOURCES Display'' either for each resource in the system or for the specific resource associated with the specified lock-id, address, or name.
| Field (in order of display) | Contents |
|---|---|
| RSB | Address of the resource block (RSB) that describes this resource. |
| GGMODE |
Indication of the most restrictive mode in which a lock on this resource has been granted. Table 4.23, ''Lock Modes on Resources'' shows the values and their meanings. For information on conflicting and incompatible lock modes, see the VSI OpenVMS System Services Reference Manual. |
| Status | The contents of the resource block status field. |
| Parent RSB | Address of the RSB that is the parent of this RSB. This field is 00000000 if the RSB itself is a parent block. |
| CGMODE |
Indication of the most restrictive lock mode to which a lock on this resource is waiting to be converted. This does not include the mode for which the lock at the head of the conversion queue is waiting. See Table 4.23, ''Lock Modes on Resources''. |
| Sub-RSB count | Number of RSBs of which this RSB is the parent. This field is 0 if the RSB has no sub-RSBs. |
| FGMODE |
Indication of the full-range grant mode. See Table 4.23, ''Lock Modes on Resources''. |
| Lock Count | The total count of all locks on the resource. |
| RQSEQNM | Sequence number of the request. |
| BLKAST count | Number of locks on this resource that have requested a blocking AST. |
| CSID | Cluster system identification number (CSID) and name of the node that owns the resource. |
| Resource | Dump of the name of this resource, as stored at the end of the RSB. The first two columns are the hexadecimal representation of the name, with the least significant byte represented by the rightmost two digits in the rightmost column. The third column contains the ASCII representation of the name, the least significant byte being represented by the leftmost character in the column. Periods in this column represent values that correspond to nonprinting ASCII characters. |
| Valblk | Hexadecimal and ASCII dump of the first 16 bytes of the value block associated with this resource. See Extended Value Block later in this table for the display of the rest of the value block. |
| Length | Length in bytes of the resource name. |
| x mode | Processor mode of the namespace in which this RSB resides (Group, Kernel, User). |
| owner | Owner of the resource. Certain resources, owned by the operating system, list "System" as the owner. Locks owned by a group have the number (in octal) of the owning group in this field. |
| Seqnum | Sequence number associated with the resource's value block. If the number indicates that the value block is not valid, the words "Not valid" appear to the right of the number. |
| Extended Valblk | If any of the last 48 bytes of the value block (see Valblk earlier in this table) are non-zero, then the entire 64-byte value block is displayed as hexadecimal and ASCII dumps. Otherwise this display is omitted. The display appears only when value block contents are non-zero, without regard to the state of the RSB$M_XVAL_VALID flag. |
| Granted queue | List of locks on this resource that have been granted. For each lock in the list, SDA displays the number of the lock and the lock mode in which the lock was granted. |
| Conversion queue | List of locks waiting to be converted from one mode to another. For each lock in the list, SDA displays the number of the lock, the mode in which the lock was granted, and the mode to which the lock is to be converted. |
| Waiting queue | List of locks waiting to be granted. For each lock in the list, SDA displays the number of the lock and the mode requested for that lock. |
| Value1 | Meaning |
|---|---|
| NL | Null mode |
| CR | Concurrent-read mode |
| CW | Concurrent-write mode |
| PR | Protected-read mode |
| PW | Protected-write mode |
| EX | Exclusive mode |
Values are shown in order from the least restrictive mode to the most restrictive.
Examples
SDA> SHOW RESOURCES Resource Database ----------------- RSB: FFFFFFFF.7FEECE40 GGMODE: PW Status: VALID XVALID Parent RSB: 00000000.00000000 CGMODE: PW Sub-RSB count: 0 FGMODE: PW Lock Count: 1 RQSEQNM: 0000 BLKAST count: 0 CSID: 00000000 (SAND41) Resource: 00000000 0043524A JRC..... Valblk: 5F73695F 73696854 Length 3 00000000 00000000 ........ 6F5F7473 65745F61 User mode 00000000 00000000 ........ This_is_a_test_o Group 001 00000000 00000000 ........ Seqnum: 00000001 Extended Valblk: 6F5F7473 65745F61 5F73695F 73696854 This_is_a_test_o 565F6465 646E6574 78455F65 68745F66 f_the_Extended_V 00000000 00006B63 6F6C425F 65756C61 alue_Block...... 00000000 00000000 00000000 00000000 ................ Granted queue (Lock ID / Gr mode / Range): 1500082F PW 00000000-FFFFFFFF Conversion queue (Lock ID / Gr mode / Range -> Rq mode / Range): *** EMPTY QUEUE *** Waiting queue (Lock ID / Rq mode / Range): *** EMPTY QUEUE *** SDA> SHOW RESOURCES Resource Database ----------------- RSB: FFFFFFFF.7FEECE40 GGMODE: PW Status: VALID Parent RSB: 00000000.00000000 CGMODE: PW Sub-RSB count: 0 FGMODE: PW Lock Count: 1 RQSEQNM: 0002 BLKAST count: 0 CSID: 00000000 (SAND41) Resource: 00000000 0043524A JRC..... Valblk: 5F74726F 68735F41 Length 3 00000000 00000000 ........ 00000000 00656E6F User mode 00000000 00000000 ........ A_short_one..... Group 001 00000000 00000000 ........ Seqnum: 00000003 Extended Valblk: 00000000 00656E6F 5F74726F 68735F41 A_short_one..... 565F6465 646E6574 78455F65 68745F66 f_the_Extended_V 00000000 00006B63 6F6C425F 65756C61 alue_Block...... 00000000 00000000 00000000 00000000 ................ Granted queue (Lock ID / Gr mode / Range): 3900080C PW 00000000-FFFFFFFF Conversion queue (Lock ID / Gr mode / Range -> Rq mode / Range): *** EMPTY QUEUE *** Waiting queue (Lock ID / Rq mode / Range): *** EMPTY QUEUE ***These examples for Alpha and IA-64 systems show two cases:
output from a program writing a longer block
output where the last writer wrote a short value block (XVALID not set), but because a previous writer wrote non-zero data to the high portion of the block and these data are still present, the data in the Extended Value Block are shown.
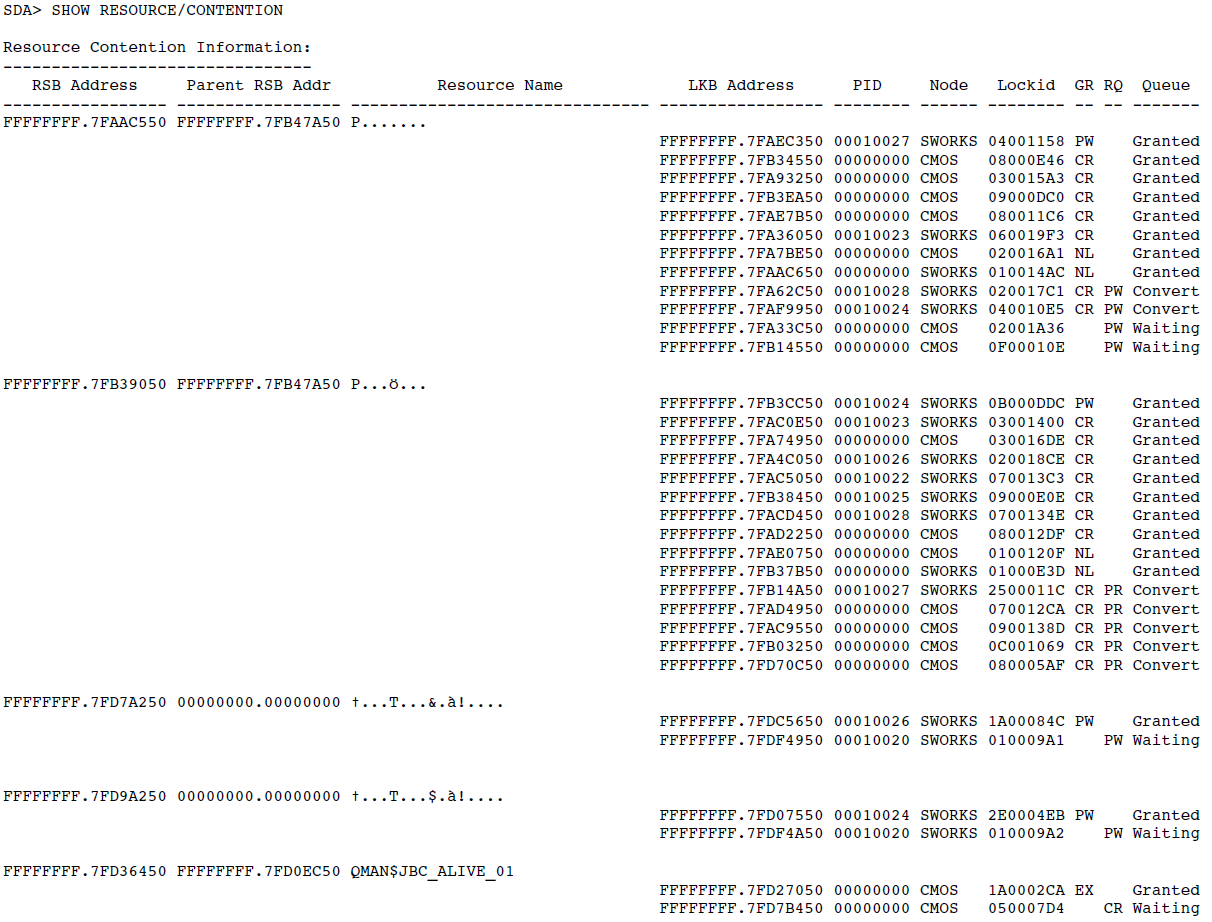
This example of the SHOW RESOURCES/CONTENTION command shows all the resources for which there is contention, and which are to be included in deadlock searches.
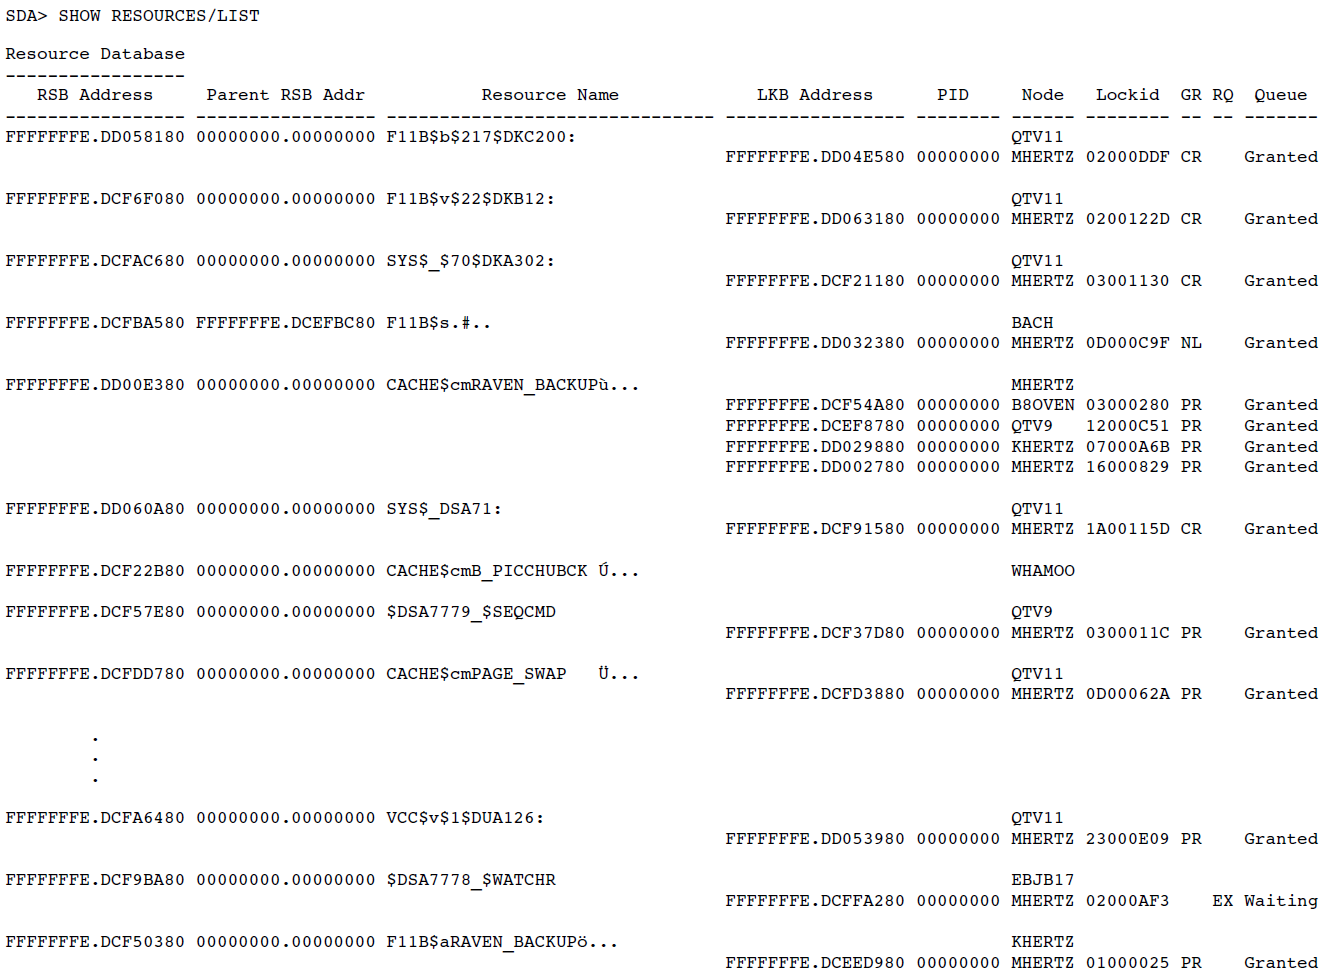
This example shows the output from the SHOW RESOURCES/LIST command.
4.66. SHOW RMD
Displays information contained in the reserved memory descriptors. Reserved memory is used within the system by memory-resident global sections.
Format
SHOW RMD [/qualifiers]
Parameters
None.
Qualifiers
- /ADDRESS=n
Displays a specific reserved memory descriptor entry, given its address.
- /ALL
Displays information in all the reserved memory descriptors. This qualifier is the default.
Description
The SHOW RMD command displays information that resides in the reserved memory descriptors. The table below shows the fields and their meanings.
| Field | Meaning |
|---|---|
| Address | Gives the address of the reserved memory descriptor. |
| Name | Gives the name of the reserved memory descriptor. |
| Group | Gives the UIC group that owns the reserved memory. This is given as -S- for system global reserved memory. |
| RAD | Gives the required RAD for the reserved memory. Displays "Any" if no RAD specified. |
| PFN | Gives starting page number of the reserved memory. |
| Count | Gives the number of pages reserved. |
| In_Use (Error) | Gives the number of pages in use. If an error occurred when the reserved memory was being allocated, the error condition code is displayed in parentheses. A second line, giving the text of the error, is also displayed in this case. |
| Zero_PFN | Gives the next page number to be zeroed. |
| Flags | Gives the settings of flags for specified reserved memory descriptor as a hexadecimal number, then displays key flag bits by name. The names may use multiple lines in the display. |
Examples
SDA> SHOW RMD Reserved Memory Descriptor List ------------------------------- In_Use Address Name Group RAD PFN Count (Error) Zero_PFN Flags -------- ------------------- ----- ---- -------- -------- -------- -------- ------------------------------ 814199C0 LARGE 00022 Any 00000000 000004E2 00000000 00000000 000000E0 Group Page_Tables GBLSec 81419940 LARGE 00022 Any 00000000 00138800 (0000244C) 00000000 000001A0 Error Group GBLSec Error = %SYSTEM-F-INSFLPGS, insufficient Fluid Pages available 81419AC0 SMALL 00011 0001 00000180 00000001 00000000 00000180 000000E1 Alloc Group Page_Tables GBLSec 81419A40 SMALL 00011 0001 00000E00 00000080 00000000 00000E00 000000A1 Alloc Group GBLSecThis example shows the default output of a SHOW RMD command.
4.67. SHOW RMS
Displays the RMS data structures selected by the SET RMS command to be included in the default display of the SHOW PROCESS/RMS command.
Format
SHOW RMS
Parameters
None.
Qualifiers
None.
Description
The SHOW RMS command lists the names of the data structures selected for the default display of the SHOW PROCESS/RMS command.
For a description of the significance of the options listed in the SHOW RMS display, see the description of the SET RMS command and Table 4.2, ''SET RMS Command Keywords for Displaying Process RMS Information''.
For an illustration of the information displayed by the SHOW PROCESS/RMS command, see the examples included in the description of the SHOW PROCESS command.
Examples
SDA> SHOW RMS RMS Display Options: IFB,IRB,IDX,BDB,BDBSUM,ASB,CCB,WCB,FCB,FAB,RAB,NAM, XAB,RLB,BLB,BLBSUM,GBD,GBH,FWA,GBDSUM,JFB,NWA,RU,DRC,SFSB,GBSB Display RMS structures for all IFI values.
The SHOW RMS command displays the full set of options available for display by the SHOW PROCESS/RMS command. SDA, by default, selects the full set of RMS options at the beginning of an analysis.
SDA> SET RMS=(IFAB=1,CCB,WCB) SDA> SHOW RMS RMS Display Options: IFB,CCB,WCB Display RMS structures only for IFI = 0001
The SET RMS command establishes the IFB, CCB, and WCB as the structures to be displayed, and only for the file whose internal File Identifer has the value 1, when the SHOW PROCESS/RMS command is issued. The SHOW RMS command verifies this selection of RMS options.
4.68. SHOW RSPID
Displays information about response IDs (RSPIDs) of all System Communications Services (SCS) connections or, optionally, about a specific SCS connection.
Format
SHOW RSPID [/CONNECTION=cdt-address ]
Parameters
None.
Qualifier
- /CONNECTION=cdt-address
Displays RSPID information for the specific SCS connection whose connection descriptor table (CDT) address is provided in cdt-address. You can find the cdt-address for any active connection on the system in the CDT summary page display of the SHOW CONNECTIONS command. CDT addresses are also stored in many individual data structures related to SCS connections. These data structures include class driver request packets (CDRPs) and unit control blocks (UCBs) for class drivers that use SCS and cluster system blocks (CSBs) for the connection manager.
Description
Whenever a local system application (SYSAP) requires a response from a remote SYSAP, a unique number, called an RSPID, is assigned to the response by the local system. The RSPID is transmitted in the original request (as a means of identification), and the remote SYSAP returns the same RSPID in its response to the original request.
The SHOW RSPID command displays information taken from the response descriptor table (RDT), which lists the currently open local requests that require responses from SYSAPs at a remote node. For each RSPID, SDA displays the following information:
RSPID value
Address of the class driver request packet (CDRP), which generally represents the original request
Address of the CDT that is using the RSPID
Name of the local process using the RSPID
Remote node from which a response is required (and has not yet been received)
Examples
SDA> SHOW RSPID --- Summary of Response Descriptor Table (RDT) 805E6F18 --- RSPID CDRP Address CDT Address Local Process Name Remote Node ----- ------------ ----------- ------------------ ----------- 39D00000 8062CC80 805E8710 VMS$VMScluster VANDQ1 EE210001 80637260 805E8C90 VMS$DISK_CL_DRVR ROMRDR EE240002 806382E0 805E8DF0 VMS$DISK_CL_DRVR VANDQ1 EE440003 806393E0 805E8F50 VMS$TAPE_CL_DRVR VANDQ1 5DB90004 80636BC0 805E8870 VMS$VMScluster ROMRDR 5C260005 80664040 805E8870 VMS$VMScluster ROMRDR 38F80006 80664A80 805E8710 VMS$VMScluster VANDQ1This example shows the default output for the SHOW RSPID command.
SDA> SHOW RSPID/CONNECTION=805E8F50 --- Summary of Response Descriptor Table (RDT) 805E6F18 --- RSPID CDRP Address CDT Address Local Process Name Remote Node ----- ------------ ----------- ------------------ ----------- EE440003 806393E0 805E8F50 VMS$TAPE_CL_DRVR VANDQ1This example shows the output for a SHOW RSPID/CONNECTION command.
4.69. SHOW SHM_CPP
Displays information about the shared memory common property partitions (CPPs). The default display shows a single-page summary that includes a single line for each CPP.
Format
SHOW SHM_CPP [/qualifiers]
Parameters
None.
Qualifiers
- /ADDRESS=n
Displays a detailed page of information about an individual shared memory CPP given the address of the SHM_CPP structure.
- /ALL
Displays a detailed page of information about each shared memory CPP.
- /IDENT=n
Displays a detailed page of information about an individual shared memory CPP.
- /PFN [=(option[,option,...])]
Displays PFN data in addition to the basic SHM_CPP. The default is to display all lists (free, bad, untested), plus the PFN database pages and the complete range of PFNs in the CPP.
You can limit which lists are displayed by specifying one or more keywords from the following table. If you specify multiple keywords, enclose them in parentheses and separate keywords with a comma.
ALL_FRAGMENTS Displays the complete range of PFNs in the CPP. BAD Displays only the bad page list. FREE Displays only the free page list. PFNDB Displays the PFNs containing the PFN database. UNTESTED Displays only the untested page list. If you specify /PFN without /ALL, /IDENT, or /ADDRESS, the system displays the PFN lists from the last shared memory CPP accessed.
Examples
SDA> SHOW SHM_CPP Summary of Shared Memory Common Property Partitions --------------------------------------------------- Base address of SHM_CPP array: FFFFFFFF.7F2BA140 Maximum number of SHM_CPP entries: 00000007 Size of each SHM_CPP: 00000240 Maximum fragment count per SHM_CPP: 00000010 Valid CPP count: 00000001 ID SHM_CPP address MinPFN MaxPFN Page count Free pages Flags ---- ----------------- -------- -------- -------- -------- -------- -- SHM_CPP IDs 0000 to 0002: VALID flag clear -- 0003 FFFFFFFF.7F2BA800 00060000 0007FFFF 00020000 0001FCF7 00000001 VALID -- SHM_CPP IDs 0004 to 0006: VALID flag clear --
This example shows the default output for the SHOW SHM_CPP command.
SDA> SHOW SHM_CPP/IDENT=3 Shared Memory CPP 0003 ---------------------- SHM_CPP address: FFFFFFFF.7F2BA800 Version: 00000001 Flags: 00000001 VALID Size: 00000000.000000C0 Page count: 00020000 Actual fragment count: 00000001 Minimum PFN: 00060000 Maximum fragment count: 00000010 Maximum PFN: 0007FFFF Length of free page list: 0001FCF7 Length of bad page list: 00000000 Length of untested page list: 00000000 PMAP array for PFN database pages PMAP Start PFN PFN count ----- -------- -------- 0. 00060053 00000280 PMAP array for all fragments PMAP Start PFN PFN count ----- -------- -------- 0. 00060000 00020000 GLock address: FFFFFFFF.7F2BA8C0 Handle: 80000000.00010D19 GLock name: SHM_CPP00000003 Flags: 00 Owner count: 00 Owner node: 00 Node sequence: 0000 Owner: 000000 IPL: 08 Previous IPL: 00 Wait bitmask: 00000000.00000000 Timeout: 00249F00 Thread ID: 00000000.00000000 Connected GNode bitmask: FFFFFFFF.7F2BA900 Valid bits: 00000004 State: 00000000.00000000 Unit count: 0001 Unit size: QUADWORD Unit bitmask: ........ ........ ........ .......7 00000000 Ranges of free pages Range Start PFN PFN count ----- -------- -------- 1. 000602F6 00000002 2. 0006030B 0001FCF5This example shows the details for a single SHM_CPP.
4.70. SHOW SHM_REG
Displays information about shared memory regions. The default display shows a single page summary that includes a single line for each region.
Format
SHOW SHM_REG [/qualifiers] [name]
Parameter
- name
Detailed page of information about the named region.
Qualifiers
- /ADDRESS=n
Displays a detailed page of information about an individual region given the address of the SHM_REG structure.
- /ALL
Displays a detailed page of information about each region.
- /IDENT=n
Displays a detailed page of information about the specified region.
Examples
SDA> SHOW SHM_REG Summary of Shared Memory Regions -------------------------------- Base address of SHM_REG array: FFFFFFFF.7F2BB140 Maximum number of SHM_REG entries: 00000040 Size of each SHM_REG: 00000208 Base address of SHM_DESC array: FFFFFFFF.7F2DC000 Valid region count: 00000009 ID SHM_REG address Region Tag SysVA / GSTX Flags ---- ----------------- ------------------------------ ----------------- -------- 0000 FFFFFFFF.7F2BB140 SYS$GALAXY_MANAGEMENT_DATABASE FFFFFFFF.7F234000 00000001 VALID 0001 FFFFFFFF.7F2BB348 SYS$SHARED_MEMORY_PFN_DATABASE FFFFFFFE.00000000 00000001 VALID 0002 FFFFFFFF.7F2BB550 SMCI$SECTION_PBA_04001 -<None>- 00000001 VALID 0003 FFFFFFFF.7F2BB758 GLX$CPU$BALANCER$SYSGBL 0000013F 00000005 VALID SHARED_CONTEXT_VALID 0004 FFFFFFFF.7F2BB960 SMCI$CHANNEL_PBA_0_1 FFFFFFFF.8F3AE000 00000001 VALID 0005 FFFFFFFF.7F2BBB68 SMCI$CHANNEL_PBA_0_2 FFFFFFFF.8FAEE000 00000001 VALID 0006 FFFFFFFF.7F2BBD70 SMCI$CHANNEL_PBA_1_2 -<Not Attached>- 00000001 VALID 0007 FFFFFFFF.7F2BBF78 LAN$SHM_REG FFFFFFFF.7F20C000 00000009 VALID ATTACH_DETACH 0008 FFFFFFFF.7F2BC180 GLX$CPU_BAL_GLOCK $000006 00000140 00000005 VALID SHARED_CONTEXT_VALID -- SHM_REG IDs 0009 to 003F: never used --This example shows the summary of all shared memory regions in the system.
SDA> SHOW SHM_REG SMCI$CHANNEL_PBA_0_1 -------------------------------------- SHM_REG address: FFFFFFFF.7F2BB960 Version: 00000001 Flags: 00000001 VALID Index/Sequence: 0004/00000003 Size: 00000000.00000120 Region tag: SMCI$CHANNEL_PBA_0_1 Creation time: 31-MAR-1999 14:11:11.37 SHM_DESC address: FFFFFFFF.7F2DC200 Version: 00000001 Flags: 00000005 ATTACHED SYS_VA_VALID System VA: FFFFFFFF.8F3AE000 Virtual size: 00000000.00274000 I/O ref count: 00000000.00000000 Index/Sequence: 0004/00000003 Context: FFFFFFFF.80F42480 Callback: FFFFFFFF.8F38E5C0 SYS$PBDRIVER+185C0 MMAP address: FFFFFFFF.7F2BB9E0 Level count: 0001 Flags: 0001 VALID Top page count: 00000001 Virtual size: 00000000.00274000 PFN list page count: 00000001 First PFN: 000602D4 Data page count: 00000009 GLock address: FFFFFFFF.7F2BBA80 Handle: 80000000.00010F51 GLock name: SHM_REG00000004 Flags: 00 Owner count: 00 Owner node: 00 Node sequence: 0000 Owner: 000000 IPL: 08 Previous IPL: 00 Wait bitmask: 00000000.00000000 Timeout: 002DC6C0 Thread ID: 00000000.00000000 Attached GNode bitmask: FFFFFFFF.7F2BBAC0 Valid bits: 00000004 State: 00000000.00000012 AUTO_LOCK SET_COUNT Unit count: 0001 Unit size: QUADWORD Lock IPL: 08 Saved IPL: 00000008 Count of bits set: 00000002 Unit bitmask: ........ ........ ........ .......3 00000000 I/O in progress bitmask: FFFFFFFF.7F2BBAF8 Valid bits: 00000004 State: 00000000.00000012 AUTO_LOCK SET_COUNT Unit count: 0001 Unit size: QUADWORD Lock IPL: 08 Saved IPL: 00000000 Count of bits set: 00000000 Unit bitmask: ........ ........ ........ .......0 00000000 SHM_CPP bitmask: FFFFFFFF.7F2BBB30 Valid bits: 00000007 State: 00000000.00000000 Unit count: 0001 Unit size: QUADWORD Unit bitmask: ........ ........ ........ ......08 00000000 )This example shows the details for a single shared memory region.
4.71. SHOW SPINLOCKS
Displays the multiprocessing synchronization data structures.
Format
SHOW SPINLOCKS
{[name]|/ADDRESS=expression|/INDEX=expression}
[{/BRIEF | /COUNTS | /FULL}]
[/CACHED_PCB | /DEVICE | /DYNAMIC | /MAILBOX
| /MISCELLANEOUS | /OWNED | /PCB | /PORT
| /PSHARED | /STATIC]
Parameters
- name
Name of the spinlock to be displayed. Device spinlock names are of the form node$lock, where node indicates the OpenVMS Cluster node name and lock indicates the device and controller identification (for example, HAETAR$DUA). If there is no OpenVMS Cluster node name, the dollar sign ($) is also skipped (for example, DUA).
Qualifiers
- /ADDRESS=expression
Displays the spinlock at the address specified in expression. You can use the /ADDRESS qualifier to display a specific device, mailbox, PCB, cached PCB, or process-shared spinlock; however, the name of the spinlock may be listed as "Unknown" in the display.
- /BRIEF
Produces a condensed display of the spinlock information displayed by default by the SHOW SPINLOCKS command, including the following: address, spinlock name or device name, IPL or device IPL, rank, ownership depth, and CPU ID of the owner CPU. If the system under analysis was executing with full-checking multiprocessing enabled (according to the setting of the MULTIPROCESSING or SYSTEM_CHECK system parameter), then the number of waiting CPUs and interlock status are also displayed.
- /CACHED_PCB
Displays all PCB-specific spinlocks associated with PCBs of deleted processes.
- /COUNTS
Produces a display of Spin, Wait, and Acquire counts for each spinlock (only if full-checking multiprocessing is enabled).
- /DYNAMIC
Displays information for all dynamic spinlocks in the system (device, port, mailbox, PCB, cached PCB, process-shared, and miscellaneous spinlocks).
- /FULL
Displays full descriptive and diagnostic information for each displayed spinlock.
- /INDEX=expression
Displays the static spinlock whose index is specified in expression. You can only use the /INDEX qualifier to display a named static spinlock.
- /MAILBOX
Displays all mailbox-specific spinlocks.
- /MISCELLANEOUS
Display all spinlocks that are not included in existing groups such as mailbox and PCB spinlocks. Miscellaneous spinlocks include the XFC, PEDRIVER, TCP/IP, and various other spinlocks. The list of miscellaneous spinlocks varies from system to system.
- /OWNED
Displays information for all spinlocks owned by a CPU. If no processors own any spinlocks, SDA displays the following message:
%SDA-I-NOSPLOWNED, all requested spinlocks are unowned
- /PCB
Displays all PCB-specific spinlocks.
- /PORT
Displays all port spinlocks.
- /PSHARED
Displays all process-shared (Pthreads) spinlocks.
- /STATIC
Displays information for all static spinlocks in the system.
Description
The SHOW SPINLOCKS command displays status and diagnostic information about the multiprocessing synchronization structures known as spinlocks.
A static spinlock is a spinlock whose data structure is permanently assembled into the system. Static spinlocks are accessed as indexes into a vector of longword addresses called the spinlock vector, the address of which is contained in SMP$AR_SPNLKVEC. The table below lists the static spinlocks.
A dynamic spinlock is a spinlock that is created based on the configuration of a particular system. One such dynamic spinlock is the device lock SYSMAN creates when configuring a particular device. This device lock synchronizes access to the device's registers and certain UCB fields. The system creates a dynamic spinlock by allocating space from nonpaged pool, rather than assembling the lock into the system as it does in creating a static spinlock. Other types of dynamic spinlocks are: port spinlocks, mailbox spinlocks, PCB, cached PCB, process-shared, and miscellaneous spinlocks.
See the Writing OpenVMS Alpha Device Drivers in C for a full discussion of the role of spinlocks in maintaining synchronization of kernel-mode activities in a multiprocessing environment.
| Name | Description |
|---|---|
| QUEUEAST | Spinlock for queuing ASTs at IPL 6 |
| FILSYS | Spinlock on file system structures |
| LCKMGR | Spinlock on all lock manager structures |
| IOLOCK8/SCS | Spinlock for executing a driver fork process at IPL 8 |
| TX_SYNCH | Transaction processing spinlock |
| TIMER | Spinlock for adding and deleting timer queue entries and searching the timer queue |
| PORT | Template structure for dynamic spinlocks for ports with multiple devices |
| IO_MISC | Miscellaneous short-term I/O spinlocks |
| MMG | Spinlock on memory management, PFN database, swapper, modified page writer, and creation of per-CPU database structures |
| SCHED | Spinlock on some process data structures and the scheduler database. |
| IOLOCK9 | Spinlock for executing a driver fork process at IPL 9 |
| IOLOCK10 | Spinlock for executing a driver fork process at IPL 10 |
| IOLOCK11 | Spinlock for executing a driver fork process at IPL 11 |
| MAILBOX | Spinlock for sending messages to the permanent system (OPCOM, JOBCTL, and so on) mailboxes |
| POOL | Spinlock on nonpaged pool database |
| PERFMON | Spinlock for I/O performance monitoring |
| INVALIDATE | Spinlock for system space translation buffer (TB) invalidation |
| HWCLK | Spinlock on hardware clock database, including the quadword containing the due time of the first timer queue entry (EXE$GQ_1ST_TIME) and the quadword containing the system time (EXE$GQ_SYSTIME) |
| MEGA | Spinlock for serializing access to fork-wait queue |
| EMB/MCHECK | Spinlock for allocating and releasing error-logging buffers and synchronizing certain machine error handling |
For each spinlock in the system, SHOW SPINLOCKS provides the following information:
Name of the spinlock (or device name for the device lock)
Address of the spinlock data structure (SPL)
The owning CPU's CPU ID
IPL at which allocation of the lock is synchronized on a local processor
Number of nested acquisitions of the spinlock by the processor owning the spinlock (Ownership Depth)
Rank of the spinlock
Timeout interval for spinlock acquisition (in terms of 10 milliseconds)
Shared array (shared spinlock context block pointer)
Number of processors waiting to obtain the spinlock
Interlock (synchronization mutex used when full-checking multiprocessing is enabled)
The last two items (CPUs waiting and Interlock) are only displayed if full-checking multiprocessing is enabled.
SHOW SPINLOCKS/BRIEF produces a condensed display of this same information, excluding the share array and timeout interval.
SHOW SPINLOCKS/COUNTS displays only the Spin, Wait, and Acquire counts for each spinlock.
If the system under analysis was executing with full-checking multiprocessing enabled, SHOW SPINLOCKS/FULL adds to the spinlock display the Spin, Wait, and Acquire counts and the last sixteen PCs at which the lock was acquired or released. If applicable, SDA also displays the PC of the last release of multiple, nested acquisitions of the lock.
If no spinlock name, address, or index is given, then information is displayed for all applicable spinlocks.
Examples
SDA> SHOW SPINLOCKS System static spinlock structures --------------------------------- EMB Address 810AE300 Owner CPU ID None IPL 0000001F Ownership Depth FFFFFFFF Rank 00000000 Timeout Interval 000186A0 Share Array 00000000 CPUs Waiting 00000000 Interlock Free MCHECK Address 810AE300 Owner CPU ID None IPL 0000001F Ownership Depth FFFFFFFF Rank 00000000 Timeout Interval 000186A0 Share Array 00000000 CPUs Waiting 00000000 Interlock Free MEGA Address 810AE400 Owner CPU ID None IPL 0000001F Ownership Depth FFFFFFFF Rank 00000002 Timeout Interval 000186A0 Share Array 00000000 CPUs Waiting 00000000 Interlock Free HWCLK Address 810AE500 Owner CPU ID None IPL 00000016 Ownership Depth FFFFFFFF Rank 00000004 Timeout Interval 000186A0 Share Array 00000000 CPUs Waiting 00000000 Interlock Free . . . System dynamic spinlock structures ---------------------------------- QTV14$OPA Address 8103FB00 Owner CPU ID None DIPL 00000015 Ownership Depth FFFFFFFF Rank FFFFFFFF Timeout Interval 000186A0 Share Array 00000000 CPUs Waiting 00000000 Interlock Free QTV14$MBA Address 810AE900 Owner CPU ID None IPL 0000000B Ownership Depth FFFFFFFF Rank 0000000C Timeout Interval 000186A0 Share Array 00000000 CPUs Waiting 00000000 Interlock Free QTV14$NLA Address 810AE900 Owner CPU ID None IPL 0000000B Ownership Depth FFFFFFFF Rank 0000000C Timeout Interval 000186A0 Share Array 00000000 CPUs Waiting 00000000 Interlock Free QTV14$PKA Address 814AA100 Owner CPU ID None DIPL 00000015 Ownership Depth FFFFFFFF Rank FFFFFFFF Timeout Interval 000186A0 Share Array 00000000 CPUs Waiting 00000000 Interlock Free . . .
This excerpt illustrates the default output of the SHOW SPINLOCKS command.
SDA> SHOW SPINLOCKS/BRIEF System static spinlock structures --------------------------------- Spinlock Owner CPUs Address Name IPL Rank Depth CPU Waiting Interlock -------- ------------ ---- -------- -------- -------- -------- --------- 810AE300 EMB 001F 00000000 FFFFFFFF None 00000000 Free 810AE300 MCHECK 001F 00000000 FFFFFFFF None 00000000 Free 810AE400 MEGA 001F 00000002 FFFFFFFF None 00000000 Free 810AE500 HWCLK 0016 00000004 FFFFFFFF None 00000000 Free 810AE600 INVALIDATE 0015 00000006 FFFFFFFF None 00000000 Free 810AE700 PERFMON 000F 00000008 FFFFFFFF None 00000000 Free 810AE800 POOL 000B 0000000A FFFFFFFF None 00000000 Free 810AE900 MAILBOX 000B 0000000C FFFFFFFF None 00000000 Free 810AEA00 IOLOCK11 000B 0000000E FFFFFFFF None 00000000 Free 810AEB00 IOLOCK10 000A 0000000F FFFFFFFF None 00000000 Free 810AEC00 IOLOCK9 0009 00000010 FFFFFFFF None 00000000 Free 810AED00 SCHED 0008 00000012 00000000 00000000 00000001 Free 810AEE00 MMG 0008 00000014 FFFFFFFF None 00000000 Free 810AEF00 IO_MISC 0008 00000016 FFFFFFFF None 00000000 Free 810AF000 PORT 0008 00000017 FFFFFFFF None 00000000 Free 810AF100 TIMER 0008 00000018 00000000 00000000 00000000 Free 810AF200 TX_SYNCH 0008 00000019 FFFFFFFF None 00000000 Free 810AF300 SCS 0008 0000001A FFFFFFFF None 00000000 Free 810AF400 LCKMGR 0008 0000001B FFFFFFFF None 00000000 Free 810AF500 FILSYS 0008 0000001C FFFFFFFF None 00000000 Free 810AF600 QUEUEAST 0006 0000001E FFFFFFFF None 00000000 Free System dynamic spinlock structures ---------------------------------- Device Owner CPUs Address Name DIPL Rank Depth CPU Waiting Interlock -------- ------------ ---- -------- -------- -------- -------- --------- 8103FB00 QTV14$OPA 0015 FFFFFFFF FFFFFFFF None 00000000 Free 810AE900 QTV14$MBA 000B 0000000C FFFFFFFF None 00000000 Free 810AE900 QTV14$NLA 000B 0000000C FFFFFFFF None 00000000 Free 814AA100 QTV14$PKA 0015 FFFFFFFF FFFFFFFF None 00000000 Free . . .This excerpt illustrates the condensed form of the display produced in the first example.
SDA> SHOW SPINLOCKS/FULL SCHED System static spinlock structures --------------------------------- SCHED Address 810AED00 Owner CPU ID 00000000 IPL 00000008 Ownership Depth 00000000 Rank 00000012 Timeout Interval 002DC6C0 Share Array 00000000 CPUs Waiting 00000001 Interlock Free Spins 00000000.0458E8DC Busy waits 00252E8D Acquires 00000000.01279BE0 Spinlock SPL$C_SCHED was last acquired or released from: (Most recently) 8004AD00 EXE$SWTIMER_FORK_C+00170 . 8004B1D4 EXE$SWTIMER_FORK_C+00644 . 8004AD00 EXE$SWTIMER_FORK_C+00170 . 8004B1D4 EXE$SWTIMER_FORK_C+00644 . 8004AD00 EXE$SWTIMER_FORK_C+00170 . 8004B1D4 EXE$SWTIMER_FORK_C+00644 . 8004AD00 EXE$SWTIMER_FORK_C+00170 . 8004B1D4 EXE$SWTIMER_FORK_C+00644 . 8004AD00 EXE$SWTIMER_FORK_C+00170 . 80136A2C SCH$INTERRUPT+0070C . 80117580 SCH$IDLE_C+002A0 . 8004B230 EXE$SWTIMER_FORK_C+006A0 . 8004AFC4 EXE$SWTIMER_FORK_C+00434 . 80117360 SCH$IDLE_C+00080 . 8012E5F4 EXE$HIBER_INT_C+00074 (Least recently) 80132150 EXE$SCHDWK_C+00110 Last release of multiple acquisitions occurred at: 80262A54 EXE$CHECK_VERSION_C+009F4This display shows the detailed information on the SCHED spinlock, including the PC history.
4.72. SHOW STACK
Displays the location and contents of the process stacks (of the SDA current process) and the system stack.
Format
SHOW STACK {range | /ALL | [/EXECUTIVE | /INTERRUPT | /KERNEL |
/PHYSICAL | /SUMMARY | /SUPERVISOR | /SYSTEM | /USER]}
{/LONG | /QUAD (d)}
Parameters
- range
Range of memory locations you want to display in stack format. You can express a range using the following syntax:
m:n Range of addresses from m to n m;n Range of addresses starting at m and continuing for n bytes
Qualifiers
- /ALL
Displays the locations and contents of the four process stacks for the SDA current process and the system stack.
- /EXECUTIVE
Shows the executive stack for the SDA current process.
- /INTERRUPT
Shows the system stack and is retained for compatibility with OpenVMS VAX. The interrupt stack does not exist on OpenVMS Alpha and OpenVMS IA-64.
- /KERNEL
Shows the kernel stack for the SDA current process.
- /LONG
Displays longword width stacks. If you do not specify this qualifier, SDA by default displays quadword width stacks.
- /PHYSICAL
Treats the start and end addresses in the given range as physical addresses. This qualifier is only relevant when a range is specified. By default, SDA treats range addresses as virtual addresses.
- /QUAD
Displays quadword width stacks. This is the default.
- /SUMMARY
Displays a list of all known stack ranges and the current stack pointer for each range.
- /SUPERVISOR
Shows the supervisor stack for the SDA current process.
- /SYSTEM
Shows the system stack.
- /USER
Shows the user stack for the SDA current process.
Description
The SHOW STACK command, by default, displays the stack that was in use when the system failed, or, in the analysis of a running system, the current operating stack. For a process that became the SDA current process as the result of a SET PROCESS command, the SHOW STACK command by default shows its current operating stack.
The various qualifiers to the command allow display of any of the four per-process stacks for the SDA current process, as well as the system stack for the SDA current CPU. In addition, any given range can be displayed in stack format.
You can define SDA process and CPU context by using the SET CPU, SHOW CPU, SHOW CRASH, SET PROCESS, and SHOW PROCESS commands as indicated in their command descriptions. A complete discussion of SDA context control appears in Section 2.5, ''SDA Context''.
SDA provides the following information in each stack display:
| Section | Contents |
|---|---|
| Identity of stack | SDA indicates whether the stack is a process stack (user, supervisor, executive, or kernel) or the system stack. |
| Stack pointer | The stack pointer identifies the top of the stack. The display indicates the stack pointer by the symbol SP =>. |
| Stack address | SDA lists all the addresses that the operating system has allocated to the stack. The stack addresses are listed in a column that increases in increments of 8 bytes (one quadword) unless you specify the /LONG qualifier, in which case addresses are listed in increments of 4 (one longword). |
| Stack contents | SDA lists the contents of the stack in a column to the right of the stack addresses. |
| Symbols | SDA attempts to display the contents of a location symbolically, using a symbol and an offset. If the stack is being displayed in quadword width and the location cannot be symbolized as a quadword, SDA attempts to symbolize the least significant longword and then the most significant longword. If the address cannot be symbolized, this column is left blank. |
| Canonical stack | When displaying the kernel stack of a noncurrent process in a crash dump, SDA identifies the stack locations used by the scheduler to store the register contents of the process. |
| Mechanism array Signal array Exception frame | When displaying the current stack in a FATALEXCPT, INVEXCEPTN, SSRVEXCEPT, or UNXSIGNAL bugcheck, SDA identifies the stack locations used to store registers and other key data for these structures. |
If a stack is empty, the display shows the following:
SP => (STACK IS EMPTY)
Examples
SDA> SHOW STACK Current Operating Stack (SYSTEM): FFFFFFFF.8244BD08 FFFFFFFF.800600FC SCH$REPORT_EVENT_C+000FC FFFFFFFF.8244BD10 00000000.00000002 FFFFFFFF.8244BD18 00000000.00000005 FFFFFFFF.8244BD20 FFFFFFFF.8060C7C0 SP => FFFFFFFF.8244BD28 FFFFFFFF.8244BEE8 FFFFFFFF.8244BD30 FFFFFFFF.80018960 EXE$HWCLKINT_C+00260 FFFFFFFF.8244BD38 00000000.000001B8 FFFFFFFF.8244BD40 00000000.00000050 FFFFFFFF.8244BD48 00000000.00000210 UCB$N_RSID+00002 FFFFFFFF.8244BD50 00000000.00000000 FFFFFFFF.8244BD58 00000000.00000000 FFFFFFFF.8244BD60 FFFFFFFF.804045D0 SCH$GQ_IDLE_CPUS FFFFFFFF.8244BD68 FFFFFFFF.8041A340 EXE$GL_FKWAITFL+00020 FFFFFFFF.8244BD70 00000000.00000250 UCB$T_MSGDATA+00034 FFFFFFFF.8244BD78 00000000.00000001 CHF$IS_MCH_ARGS FFFFFFFF.8244BD80 00000000.0000002B CHF$PH_MCH_FRAME FFFFFFFF.8244BD88 FFFFFFFF.8244BFB0 CHF$IS_MCH_DEPTH FFFFFFFF.8244BD90 80000000.FFFFFFFD G CHF$PH_MCH_DADDR FFFFFFFF.8244BD98 00000000.00001600 CTL$C_CLIDATASZ+00060 CHF$PH_MCH_ESF_ADDR FFFFFFFF.8244BDA0 FFFFFFFF.8244BF40 CHF$PH_MCH_SIG_ADDR FFFFFFFF.8244BDA8 FFFFFFFF.8244BEE8 CHF$IH_MCH_SAVR0 FFFFFFFF.8244BDB0 FFFFFFFF.8041FB00 SMP$RELEASEL+00640 CHF$IH_MCH_SAVR1 FFFFFFFF.8244BDB8 00000000.00000000 CHF$IH_MCH_SAVR16 FFFFFFFF.8244BDC0 00000000.0000000D CHF$IH_MCH_SAVR17 FFFFFFFF.8244BDC8 0000FFF0.00007E04 CHF$IH_MCH_SAVR18 FFFFFFFF.8244BDD0 00000000.00000000 CHF$IH_MCH_SAVR19 FFFFFFFF.8244BDD8 00000000.00000001 CHF$IH_MCH_SAVR20 FFFFFFFF.8244BDE0 00000000.00000000 CHF$IH_MCH_SAVR21 FFFFFFFF.8244BDE8 FFFFFFFF.805AE4B6 SISR+0006E CHF$IH_MCH_SAVR22 FFFFFFFF.8244BDF0 00000000.00000001 CHF$IH_MCH_SAVR23 FFFFFFFF.8244BDF8 00000000.00000010 CHF$IH_MCH_SAVR24 FFFFFFFF.8244BE00 00000000.00000008 CHF$IH_MCH_SAVR25 FFFFFFFF.8244BE08 00000000.00000010 CHF$IH_MCH_SAVR26 FFFFFFFF.8244BE10 00000000.00000001 CHF$IH_MCH_SAVR27 FFFFFFFF.8244BE18 00000000.00000000 CHF$IH_MCH_SAVR28 FFFFFFFF.8244BE20 FFFFFFFF.804045D0 SCH$GQ_IDLE_CPUS FFFFFFFF.8244BE28 30000000.00000300 UCB$L_PI_SVA FFFFFFFF.8244BE30 FFFFFFFF.80040F6C EXE$REFLECT_C+00950 FFFFFFFF.8244BE38 18000000.00000300 UCB$L_PI_SVA FFFFFFFF.8244BE40 FFFFFFFF.804267A0 EXE$CONTSIGNAL+00228 FFFFFFFF.8244BE48 00000000.7FFD00A8 PIO$GW_IIOIMPA FFFFFFFF.8244BE50 00000003.00000000 FFFFFFFF.8244BE58 FFFFFFFF.8003FC20 EXE$CONNECT_SERVICES_C+00920 FFFFFFFF.8244BE60 FFFFFFFF.8041FB00 SMP$RELEASEL+00640 FFFFFFFF.8244BE68 00000000.00000000 FFFFFFFF.8244BE70 FFFFFFFF.8042CD50 SCH$WAIT_PROC+00060 FFFFFFFF.8244BE78 00000000.0000000D FFFFFFFF.8244BE80 0000FFF0.00007E04 FFFFFFFF.8244BE88 00000000.00000000 FFFFFFFF.8244BE90 00000000.00000001 FFFFFFFF.8244BE98 00000000.00000000 FFFFFFFF.8244BEA0 FFFFFFFF.805AE4B6 SISR+0006E FFFFFFFF.8244BEA8 00000000.00000001 FFFFFFFF.8244BEB0 00000000.00000010 FFFFFFFF.8244BEB8 00000000.00000008 FFFFFFFF.8244BEC0 00000000.00000010 FFFFFFFF.8244BEC8 00000000.00000001 FFFFFFFF.8244BED0 00000000.00000000 FFFFFFFF.8244BED8 FFFFFFFF.804045D0 SCH$GQ_IDLE_CPUS FFFFFFFF.8244BEE0 00000000.00000001 CHF$L_SIG_ARGS FFFFFFFF.8244BEE8 0000000C.00000005 CHF$L_SIG_ARG1 FFFFFFFF.8244BEF0 FFFFFFFC.00010000 SYS$K_VERSION_08 FFFFFFFF.8244BEF8 00000300.FFFFFFFC UCB$L_PI_SVA FFFFFFFF.8244BF00 00000002.00000001 FFFFFFFF.8244BF08 00000000.0000000C FFFFFFFF.8244BF10 00000000.00000000 FFFFFFFF.8244BF18 00000000.FFFFFFFC FFFFFFFF.8244BF20 00000008.00000000 FFFFFFFF.8244BF28 00000000.00000001 FFFFFFFF.8244BF30 00000008.00000000 FFFFFFFF.8244BF38 00000000.FFFFFFFC INTSTK$Q_R2 FFFFFFFF.8244BF40 FFFFFFFF.80404668 SCH$GL_ACTIVE_PRIORITY INTSTK$Q_R3 FFFFFFFF.8244BF48 FFFFFFFF.8042F280 SCH$WAIT_KERNEL_MODE INTSTK$Q_R4 FFFFFFFF.8244BF50 FFFFFFFF.80615F00 INTSTK$Q_R5 FFFFFFFF.8244BF58 00000000.00000000 INTSTK$Q_R6 FFFFFFFF.8244BF60 FFFFFFFF.805AE000 INTSTK$Q_R7 FFFFFFFF.8244BF68 00000000.00000000 INTSTK$Q_PC FFFFFFFF.8244BF70 00000000.FFFFFFFC INTSTK$Q_PS FFFFFFFF.8244BF78 30000000.00000300 UCB$L_PI_SVA FFFFFFFF.8244BF80 FFFFFFFF.80404668 SCH$GL_ACTIVE_PRIORITY FFFFFFFF.8244BF88 00000000.7FFD00A8 PIO$GW_IIOIMPA FFFFFFFF.8244BF90 00000000.00000000 FFFFFFFF.8244BF98 FFFFFFFF.8042CD50 SCH$WAIT_PROC+00060 FFFFFFFF.8244BFA0 00000000.00000044 FFFFFFFF.8244BFA8 FFFFFFFF.80403C30 SMP$GL_FLAGS Prev SP (8244BFB0) => FFFFFFFF.8244BFB0 FFFFFFFF.8042CD50 SCH$WAIT_PROC+00060 FFFFFFFF.8244BFB8 00000000.00000000 FFFFFFFF.8244BFC0 FFFFFFFF.805EE040 FFFFFFFF.8244BFC8 FFFFFFFF.8006DB54 PROCESS_MANAGEMENT_NPRO+0DB54 FFFFFFFF.8244BFD0 FFFFFFFF.80404668 SCH$GL_ACTIVE_PRIORITY FFFFFFFF.8244BFD8 FFFFFFFF.80615F00 FFFFFFFF.8244BFE0 FFFFFFFF.8041B220 SCH$RESOURCE_WAIT FFFFFFFF.8244BFE8 00000000.00000044 FFFFFFFF.8244BFF0 FFFFFFFF.80403C30 SMP$GL_FLAGS FFFFFFFF.8244BFF8 00000000.7FF95E00The SHOW STACK command displays a system stack on an OpenVMS Alpha system. The data shown before the stack pointer may not be valid. The mechanism array, signal array, and exception frame symbols displayed on the left appear only for INVEXCEPTN, FATALEXCPT, UNXSIGNAL, and SSRVEXCEPT bugchecks.
SDA> SHOW STACK/SUMMARY Stack Ranges ------------ Memory Stack: Stack Stack Base Stack Limit Stack Pointer Notes ----------- ----------------- ----------------- ----------------- --------- Kernel 00000000.7FF44000 00000000.7FF2C000 00000000.7FF43EB0 Current Executive 00000000.7FF68000 00000000.7FF58000 00000000.7FF68000 Supervisor 00000000.7FFAC000 00000000.7FFA8000 00000000.7FFAC000 User 00000000.3FFE2000 00000000.3FFCA000 00000000.3FFE1FB0 KPstack User 00000000.3FFFE000 00000000.3FFE6000 00000000.3FFFDDB0 KPstack User 00000000.7AC9E000 00000000.7AC9A000 00000000.7AC9D830 System FFFFFFFF.86970000 FFFFFFFF.86958000 FFFFFFFF.8696FFC0 Register Stack: Stack Stack Base Stack Limit Stack Pointer Notes ----------- ----------------- ----------------- ----------------- --------- Kernel 00000000.7FF12000 00000000.7FF2A000 00000000.7FF12250 Current Executive 00000000.7FF46000 00000000.7FF56000 00000000.7FF46000 Supervisor 00000000.7FF6A000 00000000.7FF8A000 00000000.7FF6A000 User 000007FD.BFF3C000 000007FD.BFF54000 000007FD.BFF3C160 KPstack User 000007FD.BFF58000 000007FD.BFF70000 000007FD.BFF58108 KPstack User 000007FD.C0000000 000007FD.C0002000 000007FD.C0000268 System FFFFF802.0F236000 FFFFF802.0F24E000 FFFFF802.0F236278This example shows the stack ranges for a process on an OpenVMS IA-64 system.
4.73. SHOW SUMMARY
Displays a list of all active processes and the values of the parameters used in swapping and scheduling these processes.
Format
SHOW SUMMARY [/IMAGE | /PAGES |
/PROCESS_NAME=process_name
| /TOTALS | /THREAD | /USER=username]
Parameters
None.
Qualifiers
- /IMAGE
Causes SDA to display, if possible, the name of the image being executed within each process.
- /PAGES
Outputs an additional line for each process, displaying the number of process-private pages and the number of global pages in the process's working set.
- /PROCESS_NAME=process_name
Displays only processes with the specified process name. You can use wildcards in process_name, in which case SDA displays all matching processes. The default action is for SDA to display data for all processes, regardless of process name.
- /TOTALS
At the end of the list of active processes, SDA will output two sets of totals:
The total number of process-private and global pages in the working sets of all processes. The totals for resident and non-resident processes are displayed separately.
The total number of processes (or, if /THREADS was also specified, the total number of kernel threads) in each scheduling state. The totals for resident and non-resident processes or kernel threads are displayed separately.
- /THREAD
Displays information on all the kernel threads associated with the current process.
- /USER=username
Displays only the processes of the specified user. You can use wildcards in username, in which case SDA displays processes of all matching users. The default action is for SDA to display data for all processes, regardless of user name.
Description
The SHOW SUMMARY command displays the information in the table below for each active process in the system.
| Column | Contents |
|---|---|
| Extended PID | The 32-bit number that uniquely identifies the process or thread. |
| Indx | Index of this process into the PCB array. When SHOW SUMMARY/THREAD is used, for all threads of a process other than the initial thread, displays the thread number. |
| Process name | Name assigned to the process. When SHOW SUMMARY/THREAD is used, this column is blank for all threads other than the initial thread. |
| Username | Name of the user who created the process. When SHOW SUMMARY/THREAD is used, this column is blank for all threads other than the initial thread. |
| State | Current state of the process. Table 4.26, ''Current State Information'' shows the 14 states and their meanings. |
| Pri | Current scheduling priority of the process. |
| PCB/KTB | Address of the process control block or address of the kernel thread block. |
| PHD | Address of the process header. When SHOW SUMMARY/THREAD is used, this column is blank for all threads other than the initial thread. |
| Wkset | Number (in decimal) of pages currently in the process working set. When SHOW SUMMARY/THREAD is used, this column is blank for all threads other than the initial thread. |
| State | Meaning |
|---|---|
| COM | Computable and resident in memory |
| COMO | Computable, but outswapped |
| CUR nnn | Currently executing on CPU ID nnn |
| CEF | Waiting for a common event flag |
| LEF | Waiting for a local event flag |
| LEFO | Outswapped and waiting for a local event flag |
| HIB | Hibernating |
| HIBO | Hibernating and outswapped |
| SUSP | Suspended |
| SUSPO | Suspended and outswapped |
| PFW | Waiting for a page that is not in memory (page-fault wait) |
| FPG | Waiting to add a page to its working set (free-page wait) |
| COLPG | Waiting for a page collision to be resolved (collided-page wait); this usually occurs when several processes cause page faults on the same shared page |
| MWAIT | Miscellaneous wait |
| RWxxx | Waiting for system resource xxx. These states represent additional interpretation by SDA of one of the 14 scheduler states. |
| TBS | Waiting "To Be Scheduled" by class scheduler. These states represent additional interpretation by SDA of one of the 14 scheduler states. |
| TBSO | Waiting "To Be Scheduled" and outswapped. These states represent additional interpretation by SDA of one of the 14 scheduler states. |
| TBSP | "To Be Scheduled" state is pending. These states represent additional interpretation by SDA of one of the 14 scheduler states. |
| TBSPO | "To Be Scheduled" state is pending and outswapped. These states represent additional interpretation by SDA of one of the 14 scheduler states. |
| WTBYT | Waiting for BYTCNT quota. These states represent additional interpretation by SDA of one of the 14 scheduler states. |
| WTTQE | Waiting for TQCNT quota. These states represent additional interpretation by SDA of one of the 14 scheduler states. |
Examples
SDA> SHOW SUMMARY Current process summary ----------------------- Extended Indx Process name Username State Pri PCB/KTB PHD Wkset -- PID -- ---- --------------- ----------- ------- --- -------- -------- ------ 00000041 0001 SWAPPER HIB 16 80C641D0 80C63E00 0 00000045 0005 IPCACP SYSTEM HIB 10 80DC0780 81266000 39 00000046 0006 ERRFMT SYSTEM HIB 8 80DC2240 8126C000 57 00000047 0007 OPCOM SYSTEM HIB 8 80DC3340 81272000 31 00000048 0008 AUDIT_SERVER AUDIT$SERVER HIB 10 80D61280 81278000 152 00000049 0009 JOB_CONTROL SYSTEM HIB 10 80D620C0 8127E000 50 0000004A 000A SECURITY_SERVER SYSTEM HIB 10 80DC58C0 81284000 253 0000004B 000B TP_SERVER SYSTEM HIB 10 80DC8900 8128A000 75 0000004C 000C NETACP DECNET HIB 10 80DBFE00 8125A000 78 0000004D 000D EVL DECNET HIB 6 80DCA080 81290000 76 0000004E 000E REMACP SYSTEM HIB 8 80DE4E00 81296000 14 00000050 0010 DECW$SERVER_0 SYSTEM HIB 8 80DEF940 812A2000 739 00000051 0011 DECW$LOGINOUT <login> LEF 4 80DF0F00 812A8000 273 00000052 0012 SYSTEM SYSTEM LEF 9 80D772C0 81260000 75
The SHOW SUMMARY command describes all active processes in the system at the time of the system failure. Note that there was no process in the CUR state at the time of the failure.
SDA> SHOW SUMMARY /IMAGE/PAGES/THREADS/TOTALS Current process summary ----------------------- Extended Indx Process name Username State Pri PCB/KTB PHD Wkset -- PID -- ---- --------------- ----------- ------- --- -------- -------- ------ 00000201 0001 SWAPPER SYSTEM HIB 16 8230CD48 8230C000 4 Process pages: 4 Global pages: 0 . . . 00000212 0012 ACME_SERVER SYSTEM HIB 8 83673540 87740000 553 Process pages: 505 Global pages: 48 $30$DKB400:[SYS0.SYSCOMMON.][SYSEXE]ACME_SERVER.EXE 00000412 1 HIB 10 83684DC0 . . . 00000224 0024 LATACP SYSTEM HIB 14 83760BC0 8775C000 170 Process pages: 170 Global pages: 0 $30$DKB400:[SYS0.SYSCOMMON.][SYSEXE]LATACP.EXE Total Pages Process Global --------------------- ------------- ------------- Resident Processes 4490 842 Nonresident Processes 0 0 Scheduling Resident Nonresident State Threads Threads Total ------- ----------- ----------- ----------- LEF 1 0 1 HIB 20 0 20 CUR 1 0 1 ------- ----------- ----------- ----------- Total 22 0 22This example shows the output from SHOW SUMMARY when all the qualifiers (/image /pages /threads /totals) that display additional data are used.
4.74. SHOW SWIS (IA-64 Only)
Displays the SWIS (SoftWare Interrupt Services) data structure addresses or the SWIS ring buffer.
Format
SHOW SWIS [/RING_BUFFER [/CPU=(m,n,...)]]
Qualifiers
- /CPU=(m,n,...)
When used with /RING_BUFFER, displays only the entries for the specified CPUs. If you specify only one CPU, you can omit the parentheses.
- /RING_BUFFER
Displays the SWIS ring buffer (also known as the SWIS log), with the most recent entry first, and assigns meaning to certain values, such as trap type and system service invoked. For best results, execute READ/EXEC or READ/IMAGE SYS$PUBLIC_VECTORS first so that the system service codes are recognized.
Examples
SDA> read/exec
SDA> define ssentry 8692B8F0
SDA> define intstk 8692B9F0
SDA> show swis/ring_buffer
SWIS ring buffer for all CPUs
-----------------------------
8192. entries: Most recent first
Clock Data 1 Data 2 Data 3 CPU Ident *** See below. ***
-------- -------- -------- ----------------- --- --------
2CEDAD3C 82D66400a 83814080 FFFFFFFF.86B04000 00 SWPCXout
2CEDA929 82D66400a 83814080 FFFFF802.0EE370A8 00 SWPCTXin
2CED9F16 0000001F 0000001F FFFFFFFF.8046C270a 00 RaisIPL
2CED928F 8692B8F0a 00000000 FFFFFFFF.8046B760b 00 SSSwRet
2CED8FED 8692B8E0 00000000 0000002C.DC0351F2 00 RetKSrvc
2CED8B2E 8692B8F0a 06900660b FFFFFFFF.8046B760c 00 EntKSrvc
EntKSrvc
2CED72C1 8692B9F0a 00000000 FFFFFFFF.8692BFC0b 00 ExcpDsp2
2CED70B4 8692B9F0a 00000041b FFFFFFFF.80322F50c 00 ExcpDisp
ExcpDisp
2CED6E84 00000001 00000000 00000000.0001001Fa 00 GetDpth
2CED6822 00000016 0000001F FFFFFFFF.80322EB0a 00 RSetIPL
2CED62F0 8692BCF0a 00000003 FFFFFFFF.8066C000b 00 IPDisp
Symbolized value 'a' Symbolized value 'b' & 'c'
--------------------------- -----------------------------------
BUG$GQ_HWPCB
BUG$GQ_HWPCB
EXE$BUGCHECK_SWAPPED_C+000E0
SSENTRY EXE$BUGCHECK_CONTINUE_C+003C0
SSENTRY SYS$RPCC_64_C
EXE$BUGCHECK_CONTINUE_C+003C0
INTSTK INTSTK+005D
INTSTK Bugcheck Breakpoint Trap
SYSTEM_SYNCHRONIZATION_MIN+42F50
LNM$C_DEL_OVERLAY+0001B
SYSTEM_SYNCHRONIZATION_MIN+42EB0
INTSTK+00300 SCH$IDLE_C+00290
.
.
.The SHOW SWIS example displays the most recent entries in the SWIS log at the time of a system crash. Note the a, b, c alongside the data values. These indicate which column contains the symbolization for the value. 'a' is always in the first column; 'b' is in the second column, and 'c' is also in the second column on the next line. If some or all data values cannot be symbolized, the columns are left blank or there is no continuation line.
4.75. SHOW SYMBOL
Displays the hexadecimal value of a symbol and, if the value is equal to an address location, the contents of that location.
Format
SHOW SYMBOL [/ALL [/ALPHA|/VALUE]] [/BASE_ADDRESS=n] symbol-name
Parameter
- symbol-name
Name of the symbol to be displayed. You must provide a symbol-name, unless you specify the /ALL qualifier. Symbols that include lowercase letters must be enclosed in quotation marks. symbol-name may include wildcards unless /ALL is also specified.
Qualifiers
- /ALL
Displays information on all symbols whose names begin with the characters specified in symbol-name. If no symbol name is given, all symbols are displayed.
- /ALPHA
When used with the /ALL qualifier, displays the symbols sorted only in alphabetical order. The default is to display the symbols twice, sorted alphabetically and then by value.
When used with a wildcard symbol name, displays the symbols in alphabetical order. This is the default action.
- /BASE_ADDRESS=n
The given address is added to the value of each matching symbol to construct the address used when obtaining the contents of the symbol's location. By default, SDA uses the actual value of the symbol as the address to be used. See the description of SHOW SYMBOL for more information.
- /VALUE
When used with the /ALL qualifier, displays the symbols sorted only in value order. The default is to display the symbols twice, sorted alphabetically and then by value.
When used with a wildcard symbol name, displays the symbols in value order.
Description
The SHOW SYMBOL command with the /ALL qualifier outputs all symbols whose names begin with the characters specified in symbol-name in both alphabetical order and in value order. If no symbol-name is given, all symbols are output.
The SHOW SYMBOL/ALL command is useful for determining the values of symbols that belong to a symbol set, as illustrated in the second example below.
The SHOW SYMBOL command without the /ALL qualifier allows for standard wildcards in the symbol-name parameter. By default, matching symbols are displayed only in alphabetical order. If you specify SHOW SYMBOL/VALUE, then matching symbols are output sorted by value. If you specify SHOW SYMBOL/ALPHA/VALUE, then matching symbols are displayed twice, sorted alphabetically and then by value.
The SHOW SYMBOL command without the /ALL qualifier and no wildcards in the symbol-name parameter outputs the value associated with the given symbol.
When displaying any symbol value, SDA also treats the value as an address (having added the value from /BASE_ADDRESS if specified) and attempts to obtain the contents of the location. If successful, the contents are also displayed.
Examples
SDA> SHOW SYMBOL G G = FFFFFFFF.80000000 : 6BFA8001.201F0104
The SHOW SYMBOL command evaluates the symbol G as FFFFFFFF.8000000016 and displays the contents of address FFFFFFFF.8000000016 as 6BFA8001.201F010416.
SDA> SHOW SYMBOL/ALL BUG Symbols sorted by name ---------------------- BUG$L_BUGCHK_FLAGS = FFFFFFFF.804031E8 : 00000000.00000001 BUG$L_FATAL_SPSAV = FFFFFFFF.804031F0 : 00000000.00000001 BUG$REBOOT = FFFFFFFF.8042E320 : 00000000.00001808 BUG$REBOOT_C = FFFFFFFF.8004F4D0 : 47FB041D.47FD0600 . . . Symbols sorted by value ---------------------- BUG$REBOOT_C = FFFFFFFF.8004F4D0 :47FB041D.47FD0600 BUG$L_BUGCHK_FLAGS = FFFFFFFF.804031E8 :00000000.00000001 BUG$L_FATAL_SPSAV = FFFFFFFF.804031F0 :00000000.00000001 BUG$REBOOT = FFFFFFFF.8042E320 :00000000.00001808 . . .
This example shows the display produced by the SHOW SYMBOL/ALL command. SDA searches its symbol table for all symbols that begin with the string "BUG" and displays the symbols and their values. Although certain values equate to memory addresses, it is doubtful that the contents of those addresses are actually relevant to the symbol definitions in this instance.
4.76. SHOW TQE
Displays the entries in the timer queue. The default output is a summary display of all timer queue entries (TQEs) in chronological order.
Format
SHOW TQE [/ADDRESS=n] [/ALL] [/BACKLINK]
[/PID=n]
[/ROUTINE=n]
Parameters
None.
Qualifiers
- /ADDRESS=n
Outputs a detailed display of the TQE at the specified address.
- /ALL
Outputs a detailed display of all TQEs.
- /BACKLINK
Outputs the display of TQEs, either detailed (/ALL) or brief (default), in reverse order, starting at the entry furthest into the future.
- /PID=n
Limits the display to the TQEs that affect the process with the specified internal PID. The PID format required is the entire internal PID, including both the process index and the sequence number, and not the extended PID or process index alone, as used elsewhere in SDA. You can also display TQEs specific to a process using SHOW PROCESS/TQE.
- /ROUTINE=n
Limits the display to the TQEs for which the specified address is the fork PC.
Description
The SHOW TQE command allows the timer queue to be displayed. By default a summary display of all TQEs is output in chronological order, beginning with the next entry to become current.
The /ADDRESS, /PID, and /ROUTINE qualifiers are mutually exclusive. The /ADDRESS and /BACKLINK qualifiers are mutually exclusive.
In the summary display, the TQE type is given as a six-character code, as shown in the table below.
| Column | Symbol | Meaning |
|---|---|---|
| 1 | T | Timer ($SETIMR) entry |
| S | System subroutine entry | |
| W | Scheduled wakeup ($SCHDWK) entry | |
| 2 | S | Single-shot entry |
| R | Repeated entry | |
| 3 | D | Delta time |
| A | Absolute time | |
| 4 | C | CPU time |
| -- | Elapsed time | |
| 5 | E | Extended format (64-bit TQE) |
| -- | 32-bit TQE | |
| 6 | N | TQE not to be deallocated at AST completion |
| -- | TQE to be deallocated at AST completion |
Examples
SDA> SHOW TQE Timer queue entries ------------------- System time: 15-NOV-2001 15:09:06.92 First TQE time: 15-NOV-2001 15:09:06.92 TQE PID/ address Expiration Time Type routine -------- ----------------------------------------- ------ -------- 815AB8C0 00A0516F.EF279B0F 15-NOV-2001 15:09:06.92 SSD--- 835FCC48 TCPIP$INTERNET_SERVICES+9EC48 812CB3C0 00A0516F.EF279B0F 15-NOV-2001 15:09:06.92 SRD--- 812CCEC8 SYS$PPPDRIVER+0EEC8 81514140 00A0516F.EF29FD5F 15-NOV-2001 15:09:06.94 TSD--- 0001000F SECUURITY_SERVER 815C8040 00A0516F.EF2B2E87 15-NOV-2001 15:09:06.95 SRD--- 81361BA0 SYS$LTDRIVER+31BA0 8148CF98 00A0516F.EF2C52AD 15-NOV-2001 15:09:06.95 SRD--- 812786B0 LAN$CREATE_LAN+000B0 81318290 00A0516F.EF2FDC84 15-NOV-2001 15:09:06.98 SRD--- 813187B8 PWIPDRIVER+047B8 814FB080 00A0516F.EF3238D0 15-NOV-2001 15:09:06.99 TSD--- 0001000F SECURITY_SERVER 8140FF40 00A0516F.EF32851A 15-NOV-2001 15:09:06.99 TSD--- 0001000F SECURITY_SERVER ... 81503100 00A05177.0AED8000 15-NOV-2001 16:00:00.00 TSA--- 0001000C JOB_CONTROL 815030C0 00A0C160.63CD14D9 7-APR-2002 02:00:00.91 TSA--- 0001000C JOB_CONTROLThis example shows the summary display of all TQEs.
SDA> SHOW TQE/ADDRESS=898DA1A8 Timer queue entry 898DA1A8 -------------------------- TQE address: 898DA1A8 Type: 00000005 SYSTEM_SUBROUTINE REPEAT Requestor process ID: 00000000 Access mode: 00000000 Expiration time: 00A97229.C9E5FF60 6-JAN-2010 07:24:47.06 +20000 Delta repeat time: 00000000.00030D40 0 00:00:00.02 Fork PC: 88520460 SYS$GHDRIVER+50260 Fork R3: 898D9540.00000000 Fork R4: 00000000.00000000This example shows the detailed display for a single TQE.
4.77. SHOW TQEIDX
Displays the contents of the timer queue entry index (TQEIDX) structures. The default display is a summary of all TQEIDX structures.
Format
SHOW TQEIDX [/ADDRESS=address | /ALL]
Parameters
None.
Qualifiers
- /ADDRESS=address
Causes SDA to output a detailed display of the contents of the TQEIDX at the specified address. Cannot be specified with /ALL.
- /ALL
Causes SDA to output a detailed display of the contents of all TQEIDX structures. Cannot be specified with /ADDRESS.
Description
The SHOW TQEIDX command allows the timer queue entry index structures to be displayed. The default display is a summary of all TQEIDX structures. The /ADDRESS and /ALL qualifiers are mutually exclusive.
Examples
SDA> show tqeidx Timer queue index buckets ------------------------- Time index buckets ------------------ TQEIDX Free address Level Parent count Maximum key -------- -------- -------- -------- ----------------- 872B6700 00000001 00000000 0000003C FFFFFFFF.FFFFFFFF 875ED640 00000000 872B6700 00000005 00A39404.827C01CF 87312E80 00000000 872B6700 00000032 00A39A11.9DABF957 8726A300 00000000 872B6700 0000003D FFFFFFFF.FFFFFFFF Time index overflow list is empty ID index buckets ---------------- TQEIDX Free address Level Parent count Maximum key -------- -------- -------- -------- ----------------- 872AF900 00000001 00000000 0000003D FFFFFFFF.FFFFFFFF 86C29C80 00000000 872AF900 00000016 0002C000.83374030 872FD780 00000000 872AF900 0000001F FFFFFFFF.FFFFFFFF ID index overflow list is empty
This example shows the summary TQEIDX display.
4.78. SHOW UNWIND (IA-64 Only)
Displays the master unwind table for system space (by default) or for a specified target.
Format
SHOW UNWIND [address | /ALL | /IMAGE=name ]
Parameters
- address
Address of the program counter (PC) (IIP) whose unwind data is to be displayed. The address can be in system space or process space.
Qualifiers
- /ALL
Displays the details of every system unwind descriptor.
- /IMAGE
Displays the details of every unwind descriptor for the specified system images (wildcards allowed).
Description
Displays the master unwind table for system space. This is the default. If /ALL is given, the details of every system unwind descriptor are displayed. If an address is given, the unwind descriptor for the program counter (PC) (IIP) is located and displayed. The address can be in system space or process space.
Also see SHOW PROCESS/UNWIND.
Examples
SDA> show unwind System Unwind Table ------------------- Page Header VA Entries Region ID ----------------- ----------------- ----------------- FFFFFFFF.7FFFC000 00000000.00000018 00000000.00000000 FFFFFFFF.7FFFA000 00000000.00000018 00000000.00000000 FFFFFFFF.7FFF8000 00000000.00000018 00000000.00000000 FFFFFFFF.7FF44000 00000000.00000018 00000000.00000000 FFFFFFFF.7F7A0000 00000000.00000018 00000000.00000000 FFFFFFFF.7F56C000 00000000.00000006 00000000.00000000 Image name Code Base VA UT Base VA Unwind Info Base Flags MUTE VA Mode Code End VA UT Size GP ------------------------------------- ----------------- ----------------- ----------------- ---------- EXCEPTION_MON FFFFFFFF.80480000 FFFFFFFF.82D53800 FFFFFFFF.82D53800 FFFFFFFF.7FFFC020 00000000 FFFFFFFF.8055CDCF 00000000.00002AD8 FFFFFFFF.82F6F400 EXCEPTION_MON FFFFFFFF.86AB0000 FFFFFFFF.86AB4000 FFFFFFFF.86AB4000 Obsolete FFFFFFFF.7FFFC170 00000000 FFFFFFFF.86AB207F 00000000.00000060 FFFFFFFF.82F6F400 IO_ROUTINES_MON FFFFFFFF.80560000 FFFFFFFF.82D78600 FFFFFFFF.82D78600 FFFFFFFF.7FFFC2C0 00000000 FFFFFFFF.8064A7AF 00000000.00004B00 FFFFFFFF.82FA2800 IO_ROUTINES_MON FFFFFFFF.86AB6000 FFFFFFFF.86AB8000 FFFFFFFF.86AB8000 Obsolete FFFFFFFF.7FFFC410 00000000 FFFFFFFF.86AB73AF 00000000.000000A8 FFFFFFFF.82FA2800 SYSDEVICE FFFFFFFF.80650000 FFFFFFFF.82DA7A00 FFFFFFFF.82DA7A00 FFFFFFFF.7FFFC560 00000000 FFFFFFFF.8065E90F 00000000.00000240 FFFFFFFF.82FA9400This example shows the master unwind table for the system, the pages that are being read and the images whose unwind data is present.
SDA> show unwind 00000000.00020130 Unwind Table Entry for 00000000.00020130 --------------------------------------- Image name: X MUTE VA: 000007FD.BFFC62C0 Mode: 00000001 Code Base VA: 00000000.00020000 Code End VA: 00000000.000201FF UT Base VA: 00000000.00030000 UT Size: 00000000.00000030 Unwind Info Base: 00000000.00030000 GP: 00000000.00240000 Flags: 0000 Unwind Descriptor: 00000000.00030090 PC range = 00000000.00020130:00000000.000201DF Unwind Descriptor flags: No handler present, No OSSD present Unwind descriptor records: R1 Region Header: Short Prologue, PC range = 00000000.00020130:00000000.00020131 P7: MEM_STACK_V PC=00000000.00020131 P3: PSP_GR R41 P3: PFS_GR R40 R1 Region Header: Short Body, PC range = 00000000.00020132:00000000.000201B0 B1: Short Label_State LABEL=00000001 B2: Short Epilogue ECOUNT=00000000 PC=00000000.000201A0 R1 Region Header: Short Body, PC range = 00000000.000201B1:00000000.000201D1 B1: Short Copy_State LABEL=00000001This example shows the unwind data for PC 20130, giving image name, location of unwind data and all unwind descriptors. For an explanation of the unwind descriptors, see the appendixes in the VSI OpenVMS Calling Standard.
4.79. SHOW VHPT (IA-64 Only)
Displays data from the Virtual Hash Page Table.
Format
SHOW VHPT [ /CPU = {n|*} [/ALL]
[range] ]
Parameters
- range
The entry or range of entries to be displayed, expressed using the following syntax:
m Displays the VHPT entry m m:n Displays the VHPT entries from m to n m;n Displays n VHPT entries starting at m A range can be provided only if a single CPU is specified with the /CPU qualifier.
Qualifiers
- /CPU = {n|*}
Indicates that the detailed contents of the VHPT for one or all CPUs is to be displayed. The default action is for a summary of VHPT information to be displayed.
- /ALL
Displays all VHPTs for the specified CPUs. Without /ALL, only entries that have a valid tag are displayed.
Description
Displays contents of the Virtual Hash Page Table on an OpenVMS IA-64 system. By default, a summary of the VHPT entries is displayed. If CPUs are specified, details of individual VHPT entries are displayed for the CPUs. If a single CPU is specified, specific VHPT entries for that CPU are displayed.
In the detailed display, the columns are as follows:
| Column | Contents |
|---|---|
| Entry | VHPT Entry Number |
| Bits |
One or more of the following flags: P---Present A---Accessed D---Dirty E---Exception deferral I---Tag invalid (only seen if /ALL is specified) |
| MA |
One of the following memory attributes: WB---Write Back UC---Uncacheable UCE---Uncacheable Exported WC---Write Coalescing NaT---NaTPage |
| AR/PL | The access rights and privilege level of the page. Consists of a number (0-7) and a letter (K, E, S, or U) that determines access to the page in each mode. |
| KESU |
The access allowed to the page in each mode. This is an interpretation of the AR/PL values in the previous column. For an explanation of the access codes, refer to Section 2.8, ''Page Protections and Access Rights''. |
| Physical address | The starting physical address for this VHPT entry. |
| Page size | The size of the page represented by this VHPT entry. Page sizes for VHPT entries range from 4KB to 4GB. Not all possible pages sizes are used by OpenVMS IA-64. |
| Tag | The translation tag for the VHPT entry. |
| Quad4 | Information recorded by OpenVMS IA-64 for debugging purposes. The contents of this quadword are subject to change. |
Examples
SDA> SHOW VHPT Virtual Hash Page Table Summary ------------------------------- CPU 0000 -------- VHPT address: FFFFFFFF.7FFF0000 Translation registers: 00000002 VHPT page size: 0000000E CPU 0001 -------- VHPT address: FFFFFFFF.7FF88000 Translation registers: 00000002 VHPT page size: 0000000E
This example shows the default behavior of the SHOW VHPT command.
SDA> SHOW VHPT /CPU=0 Virtual Hash Page Table for CPU 0000 ------------------------------------ VHPT address: FFFFFFFF.7FFF0000 Translation registers: 00000002 VHPT page size: 0000000E Page Entry Bits MA AR/PL KESU Physical Address Size Tag Quad4 -------- ---- -- ----- ---- ----------------- ---- ----------------- ----------------- 00000000 PADE WB 4 E wr-- 00000000.09806000 4MB 0000FE7F.FFFC2C03 FF000003.85806004 00000001 PADE WB 4 E wr-- 00000000.09804000 4MB 0000FE7F.FFFC2C02 FF000003.85805184 00000002 PADE WB 4 E wr-- 00000000.09802000 4MB 0000FE7F.FFFC2C01 FF000003.85803184 00000003 PADE WB 4 E wr-- 00000000.09800000 4MB 0000FE7F.FFFC2C00 FF000003.858008C4 00000004 PADE WB 2 K w--- 00000000.03726000 8KB 0000FE7F.FFFA0007 FF000003.4000FAB8 00000005 PADE WB 2 K w--- 00000000.03724000 8KB 0000FE7F.FFFA0006 FF000003.4000C478 00000006 PADE WB 2 K w--- 00000000.03722000 8KB 0000FE7F.FFFA0005 FF000003.4000A988 00000007 PADE WB 2 K w--- 00000000.071DA000 8KB 0000FE7F.FFFA1804 FF000003.43008000 00000008 PADE WB 2 K w--- 00000000.0372E000 8KB 0000FE7F.FFFA000B FF000003.40017C30 00000009 PADE WB 4 E wr-- 00000000.03356000 8KB 0000FE7F.FFFBFC0A FF000003.7F814CCC 0000000E PADE WB 3 U WWWW 00000000.10E78000 8KB 7FFD7C80.000002F7 00FFFAF9.005EE004 00000012 PADE WB 4 E wr-- 00000000.03348000 8KB 0000FE7F.FFFBFC11 FF000003.7F823B28 ... 000003FD PADE WB 5 U WRRR 00000000.00004000 8KB 0000FE7F.FFFBFFFE FF000003.7FFFC020 000003FE PADE WB 5 U WRRR 00000000.00078000 8KB 0000FE7F.FFFBFFFD FF000003.7FFFA020 000003FF PADE WB 2 K w--- 00000000.0717C000 8KB 0000FE7F.FFFA17FC FF000003.42FF8000This example shows the detailed contents of all the VHPT entries for CPU 0 that have a valid tag.
4.80. SHOW WORKING_SET_LIST
Displays the system working set list without changing the current process context. You can specify SHOW WORKING_SET_LIST or SHOW WSL. The two commands are equivalent.
Format
SHOW WORKING_SET_LIST [/ALL (d) | /ENTRY=n |
/GPT
| /LOCKED | /MODIFIED | /SYSTEM]
SHOW WSL [/ALL (d) | /ENTRY=n |
/GPT
| /LOCKED | /MODIFIED | /SYSTEM]
Parameters
None.
Qualifiers
- /ALL
Displays all working set list entries. This is the default.
- /ENTRY=n
Displays a specific working set entry, where n is the working set list index (WSLX) of the entry of interest.
- /GPT
Displays working set list entries only for global page table pages.
- /LOCKED
Displays working set list entries only for pageable system pages that are locked in the system working set.
- /MODIFIED
Displays working set list entries only for pageable system pages that are marked modified.
- /SYSTEM
Displays working set list entries only for pageable system pages.
Description
The SHOW WORKING_SET_LIST command displays the contents of requested entries in the system working set list. The SHOW WORKING_SET_LIST command is equivalent to the SHOW PROCESS/SYSTEM/WORKING_SET_LIST command, but the SDA current process context returns to the prior process upon completion. See the SHOW PROCESS command and Table 4.17, ''Working Set List Entry Information in the SHOW PROCESS Display'' for more information.
4.81. SHOW WSL
See SHOW WORKING_SET_LIST.
4.82. SPAWN
Creates a subprocess of the process currently running SDA, copying the context of the current process to the subprocess and, optionally, executing a specified command within the subprocess.
Format
SPAWN [/qualifier[,...]] [command]
Parameter
- command
Name of the command that you want the subprocess to execute.
Qualifiers
- /INPUT=filespec
Specifies an input file containing one or more command strings to be executed by the spawned subprocess. If you specify a command string with an input file, the command string is processed before the commands in the input file. When processing is complete, the subprocess is terminated.
- /NOLOGICAL_NAMES
Specifies that the logical names of the parent process are not to be copied to the subprocess. The default behavior is that the logical names of the parent process are copied to the subprocess.
- /NOSYMBOLS
Specifies that the DCL global and local symbols of the parent process are not to be passed to the subprocess. The default behavior is that these symbols are passed to the subprocess.
- /NOTIFY
Specifies that a message is to be broadcast to SYS$OUTPUT when the subprocess either completes processing or aborts. The default behavior is that such a message is not sent to SYS$OUTPUT.
- /NOWAIT
Specifies that the system is not to wait until the subprocess is completed before allowing more commands to be entered. This qualifier allows you to input new SDA commands while the spawned subprocess is running. If you specify /NOWAIT, use /OUTPUT to direct the output of the subprocess to a file to prevent more than one process from simultaneously using your terminal.
The default behavior is that the system waits until the subprocess is completed before allowing more SDA commands to be entered.
- /OUTPUT=filespec
Specifies an output file to which the results of the SPAWN operation are written. To prevent output from the spawned subprocess from being displayed while you are specifying new commands, specify an output other than SYS$OUTPUT whenever you specify /NOWAIT. If you omit the /OUTPUT qualifier, output is written to the current SYS$OUTPUT device.
- /PROCESS=process-name
Specifies the name of the subprocess to be created. The default name of the subprocess is USERNAME_n, where USERNAME is the user name of the parent process. The variable n represents the subprocess number.
Examples
SDA> SPAWN $ MAIL . . . $ DIR . . . $ LO Process SYSTEM_1 logged out at 5-JAN-1993 15:42:23.59 SDA>
This example uses the SPAWN command to create a subprocess that issues DCL commands to invoke the Mail utility. The subprocess then lists the contents of a directory before logging out to return to the parent process executing SDA.
4.83. UNDEFINE
Removes the specified symbol from SDA's symbol table.
Format
UNDEFINE symbol
Parameter
- symbol
The name of the symbol to be deleted from SDA's symbol table. A symbol name is required. Symbols that include lowercase letters must be enclosed in quotation marks.
Qualifiers
None.
4.84. VALIDATE PFN_LIST
Validates that the page counts on lists are correct.
Format
VALIDATE PFN_LIST {/ALL (d) | [/BAD | /FREE | /MODIFIED | /PRIVATE |
/UNTESTED | /ZERO]}
Parameters
None.
Qualifiers
- /ALL
Validates all the PFN lists: bad, free, modified, untested, zeroed free pages, and private pages.
- /BAD
Validates the bad page list.
- /FREE
Validates the free page list.
- /MODIFIED
Validates the modified page list.
- /PRIVATE
Validates all private page lists.
- /UNTESTED
Validates the untested page list that was set up for deferred memory testing.
- /ZERO
Validates the zeroed free page list.
Description
The VALIDATE PFN_LIST command validates the specified PFN list by counting the number of entries in the list and comparing that to the running count of entries for each list maintained by the system.
Examples
SDA> VALIDATE PFN_LIST Free page list validated: 1433 pages (excluding zeroed free page list with expected size 103 pages) Zeroed free page list validated: 103 pages Modified page list validated: 55 pages Bad page list validated: 0 pages Untested page list validated: 0 pages Private page list at 81486340 validated: 2 pagesThis example shows the default behavior of VALIDATE PFN_LIST, checking all lists.
SDA> VALIDATE PFN_LIST/FREE Free page list validated: 1433 pages (excluding zeroed free page list with expected size 103 pages)This example shows the validation of only the free list.
4.85. VALIDATE POOL
Checks all free pool packets for POOLCHECK-style corruption, using the same algorithm as the system pool allocation routines when generating a POOLCHECK bugcheck and system dump.
Format
VALIDATE POOL { /ALL (d) | /BAP | /NONPAGED | /PAGED } [ /HEADER |
/MAXIMUM_BYTES [=n] /SUMMARY ]
Parameters
None.
Qualifiers
- /ALL
Checks free packets for all pool types (nonpaged pool, paged pool, and bus addressable pool). This is the default.
- /BAP
Checks free packets in bus addressable pool.
- /HEADER
Displays only the first 16 bytes of any corrupted free packets found.
- /MAXIMUM_BYTES[=n]
Displays only the first n bytes of any corrupted free packets found. If you specify /MAXIMUM_BYTES without a value, the default is 64 bytes.
- /NONPAGED
Checks free packets in nonpaged pool.
- /PAGED
Checks free packets in paged pool.
- /SUMMARY
Displays only a summary of corrupted pool packets found.
Description
The VALIDATE POOL command displays information about corrupted free pool packets. It is useful only if pool checking has been enabled using either the POOLCHECK or the SYSTEM_CHECK system parameters. (For information on these system parameters, refer to the VSI OpenVMS System Management Utilities Reference Manual or to the Sys_Parameters online help topic.)
Examples
SDA> VALIDATE POOL Non-Paged Dynamic Storage Pool: no free packet corruption detected Paged Dynamic Storage Pool: no free packet corruption detected
This example shows the default behavior of VALIDATE POOL, checking all dynamic storage pools.
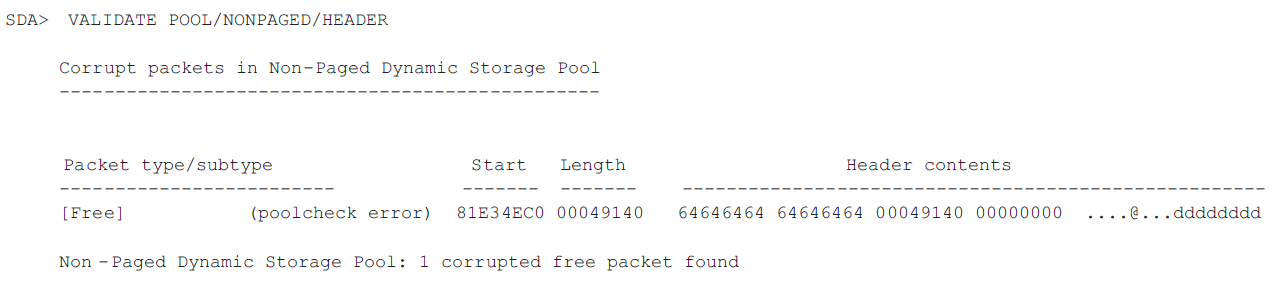
This example shows the validation of nonpaged pool only, and displays the header of the corrupted block found.
4.86. VALIDATE PROCESS
Performs validation of process data structures. Currently, the only validation available is to check free process pool packets for POOLCHECK-style corruption, using the same algorithm as the system pool allocation routines when generating a POOLCHECK bugcheck and system dump.
Format
VALIDATE PROCESS/POOL [= {P0 | P1 | IMGACT | ALL (d)} ]
[/ADDRESS=pcb-address | process-name | ALL | /ID=nn | /INDEX=nn | /NEXT |
/SYSTEM]
[/HEADER | /MAXIMUM_BYTES[=n] | /SUMMARY]
Parameters
- ALL
Indicates that all processes in the system are to be validated.
- process name
Name of the process to be validated. The process name can contain up to 15 uppercase letters, numerals, underscore (_), dollar sign ($), colon (:), and some other printable characters. If it contains any other characters (including lowercase letters), you might need to enclose the process name in quotation marks (" ").
Qualifiers
- /ADDRESS = pcb address
Specifies the process control block (PCB) address of the process to be validated.
- /HEADER
Displays only the first 16 bytes of any corrupted free packets found.
- /ID = nn/INDEX = nn
Specifies the process to be validated by its index into the system's list of software process control blocks (PCBs), or by its process identification. You can supply the following values for nn:
The process index itself.
A process identification (PID) or extended PID longword, from which SDA extracts the correct index. The PID or extended PID of any thread of a process with multiple kernel threads can be specified. Any thread-specific data displayed by further commands is for the given thread.
To obtain these values for any given process, issue the SDA command SHOW SUMMARY/THREADS. The /ID=nn and /INDEX=nn qualifiers can be used interchangeably.
- /MAXIMUM_BYTES[=n]
Displays only the first n bytes of any corrupted free packets found. If you specify /MAXIMUM_BYTES without a value, the default is 64 bytes.
- /NEXT
Causes SDA to locate the next process in the process list and validate that process. If there are no further processes in the process list, SDA returns an error.
- /POOL [= {P0 | P1 | IMGACT | ALL (d)} ]
(Required) Causes process pool validation to be performed. Use of a keyword on the /POOL qualifier allows the user to specify which process pool is to be validated (P0, P1, Image Activator Pool, or ALL). Default: ALL
- /SUMMARY
Displays only a summary of the corrupted pool packets found.
- /SYSTEM
This qualifier is provided for compatibility with SET PROCESS/SYSTEM and SHOW PROCESS/SYSTEM. There is no pool associated with the system process that can be validated. SDA sets its current process context to the system process and outputs the text:
Options ignored for System process: POOL
Description
The VALIDATE PROCESS command validates the process indicated by one of the following: process-name, the process specified in the /ID or /INDEX qualifier, the next process in the system's process list, the system process, or all processes. The VALIDATE PROCESS command performs an implicit SET PROCESS command under certain uses of its qualifiers and parameters, as noted in Section 2.5, ''SDA Context''. By default, the VALIDATE PROCESS command validates the SDA current process, as defined in Section 2.5, ''SDA Context''.
Currently, the only validation available is to check free pool packets for POOLCHECK-style corruption. The command is useful only if pool checking has been enabled using either the POOLCHECK or the SYSTEM_CHECK system parameters. (For information on these system parameters, refer to the VSI OpenVMS System Management Utilities Reference Manual or to the Sys_Parameters online help topic.)
If a process is specified using process-name, /ADDRESS, /ID, /INDEX, /NEXT, or /SYSTEM, that process becomes the SDA current process for future commands.
Examples
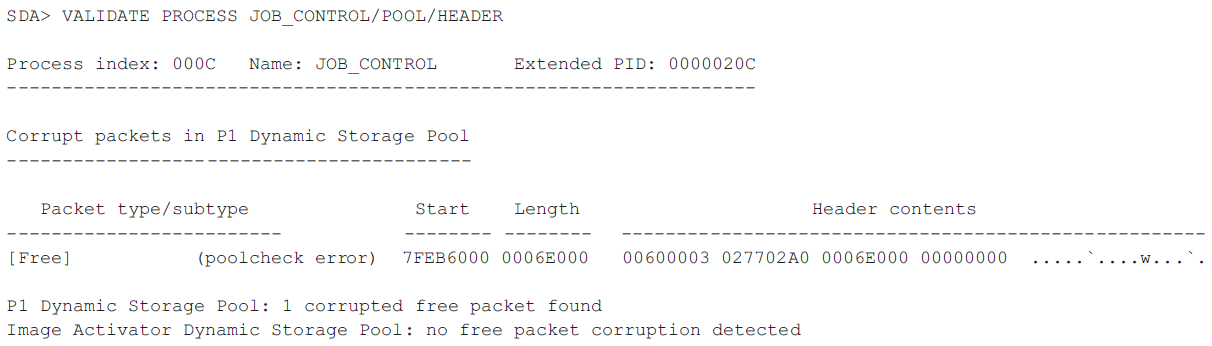
This example shows the default behavior of VALIDATE PROCESS/POOL, checking all process storage pools, and displaying only the header of the corrupted block found.
4.87. VALIDATE QUEUE
Validates the integrity of the specified queue by checking the pointers in the queue.
Format
VALIDATE QUEUE [address]
[/BACKLINK | /LIST | /PHYSICAL
| /QUADWORD | /SELF_RELATIVE | /SINGLY_LINKED]
Parameter
- address
Address of an element in a queue.
If you specify the period (.) as the address, SDA uses the last evaluated expression as the queue element's address.
If you do not specify an address, the VALIDATE QUEUE command determines the address from the last issued VALIDATE QUEUE command in the current SDA session.
If you do not specify an address, and no queue has previously been specified, SDA displays the following error message:
%SDA-E-NOQUEUE, no queue has been specified for validation
Qualifiers
- /BACKLINK
Allows doubly linked lists to be validated from the tail of the queue. If the queue is found to be broken when validated from the head of the queue, you can use /BACKLINK to narrow the list of corrupted entries.
- /LIST
Displays the address of each element in the queue.
- /PHYSICAL
Allows validation of queues whose header and links are physical addresses.
- /QUADWORD
Allows the validate operation to occur on queues with linked lists of quadword addresses.
- /SELF_RELATIVE
Specifies that the selected queue is a self-relative queue.
- /SINGLY_LINKED
Allows validation of queues that have no backward pointers.
Description
The VALIDATE QUEUE command uses the forward and, optionally, backward pointers in each element of the queue to make sure that all such pointers are valid and that the integrity of the queue is intact. If the queue is intact, SDA displays the following message:
Queue is complete, total of n elements in the queue
In these messages, n represents the number of entries the VALIDATE QUEUE command has found in the queue.
If SDA discovers an error in the queue, it displays one of the following error messages:
Error in forward queue linkage at address nnnnnnnn after tracing x elements Error comparing backward link to previous structure address (nnnnnnnn) Error occurred in queue element at address oooooooo after tracing pppp elements
These messages can appear frequently when you use the VALIDATE QUEUE command within an SDA session that is analyzing a running system. In a running system, the composition of a queue can change while the command is tracing its links, thus producing an error message.
If there are no entries in the queue, SDA displays this message:
The queue is empty
Examples
SDA> VALIDATE QUEUE/SELF_RELATIVE IOC$GQ_POSTIQ Queue is complete, total of 159 elements in the queue
This example validates the self-relative queue IOC$GQ_POSTIQ. The validation is successful and the system determines that there are 159 IRPs in the list.
SDA> VALIDATE QUEUE/QUADWORD FFFFFFFF80D0E6CO/LIST Entry Address Flink Blink ----- ------- ------ ----- Header FFFFFFFF80D0E6CO FFFFFFFF80D03780 FFFFFFFF80D0E800 1. FFFFFFFF80D0E790 FFFFFFFF80D0E7CO FFFFFFFF80D0E6C0 2. FFFFFFFF80D0E800 FFFFFFFF80D0E6C0 FFFFFFFF80D0E7C0 Queue is complete, total of 3 elements in the queueThis example shows the validation of quadword elements in a list.
SDA> VALIDATE QUEUE/SINGLY_LINKED EXE$GL_NONPAGED+4 Queue is zero-terminated, total of 95 elements in the queue
This example shows the validation of singly linked elements in the queue. The forward link of the final element is zero instead of being a pointer back to the queue header.
4.88. VALIDATE SHM_CPP
Validates all the shared memory common property partitions (CPPs) and the counts and ranges of attached PFNs; optionally, it can validate the contents of the database for each PFN.
Format
VALIDATE SHM_CPP [/qualifiers]
Parameters
None.
Qualifiers
- /ADDRESS=n
Validates the counts and ranges for a single shared memory CPP given the address of the SHM_CPP structure.
- /ALL
Validates all the shared memory CPPs. This is the default.
- /IDENT=n
Validates the counts and ranges for a single shared memory CPP.
- /PFN
Validates the PFN database contents for each attached PFN. The default is all lists (free, bad, untested) plus the PFN database pages and the complete range of PFNs in the CPP.
You can limit which lists are validated by specifying one or more keywords from the following table. If you specify multiple keywords, enclose them in parentheses and separate keywords with a comma.ALL_FRAGMENTS Validates the complete range of PFNs in the CPP. BAD Validates only the bad page list. FREE Validates only the free page list. PFNDB Validates the PFNs containing the PFN database. UNTESTED Validates only the untested page list. If you specify the /PFN without /ALL, /IDENT, or /ADDRESS, the system validates the PFN lists from the last shared memory CPP.
Examples
SDA> VALIDATE SHM_CPP
Not validating SHM_CPP 0000 at FFFFFFFF.7F2BA140, VALID flag clear
Not validating SHM_CPP 0001 at FFFFFFFF.7F2BA380, VALID flag clear
Not validating SHM_CPP 0002 at FFFFFFFF.7F2BA5C0, VALID flag clear
Validating SHM_CPP 0003 at FFFFFFFF.7F2BA800 ...
Validating counts and ranges in the free page list ...
... o.k.
Not validating the bad page list, list is empty
Not validating the untested page list, list is empty
Not validating SHM_CPP 0004 at FFFFFFFF.7F2BAA40, VALID flag clear
Not validating SHM_CPP 0005 at FFFFFFFF.7F2BAC80, VALID flag clear
Not validating SHM_CPP 0006 at FFFFFFFF.7F2BAEC0, VALID flag clearThis example shows the default output for the VALIDATE SHM_CPP command.
4.89. VALIDATE TQEIDX
Validates all the data structures associated with timer queue entry index (TQEIDX) structures.
Format
VALIDATE TQEIDX
Parameters
None.
Qualifiers
None.
Description
TQEs are linked together with index blocks that point to TQEs or to another level of index block. VALIDATE TQEIDX checks that all the index blocks are correctly linked together.
Examples
SDA> VALIDATE TQEIDX
Validating time index buckets...
... o.k.
Validating ID index buckets...
... o.k.
Validating 1st time...
... o.k.
Validating counts...
... o.k.This example shows the output from a successful VALIDATE TQEIDX command.
4.90. WAIT
Causes SDA to wait for the specified length of time.
Format
WAIT [wait-time]
Parameter
- wait-time
The wait time is given as a delta time: [[hh:]mm:]ss[.t[h]]. If omitted, the default wait time is one second.
Qualifiers
None.
Description
The WAIT command can be used in command procedures such as scripts collecting performance data. See Chapter 8 for a sample procedure.
Examples
SDA> WAIT 00:00:15
SDA waits 15 seconds before accepting the next command.
Chapter 5. SDA CLUE Extension
The SDA CLUE command invokes the Crash Log Utility Extractor, which captures specific crash dump information and, upon system reboot, preserves it in a file with the following naming scheme:
CLUE$nodename_ddmmyy_hhmm.LIS
You enter CLUE extension commands at the SDA prompt. For example:
SDA> CLUE CONFIG
You can get full help on CLUE by entering HELP CLUE at the SDA> prompt.
5.1. Overview of SDA CLUE Extension
SDA CLUE (Crash Log Utility Extractor) commands automate the analysis of crash dumps and maintain a history of all fatal bugchecks on either a standalone or cluster system. You can use SDA CLUE commands in conjunction with SDA to collect and decode additional dump file information not readily accessible through standard SDA commands. SDA CLUE extension commands can summarize information provided by certain standard SDA commands and provide additional detail for some SDA commands. For example, SDA CLUE extension commands can quickly provide detailed extended QIO processor (XQP) summaries. You can also use SDA CLUE commands interactively on a running system to help identify performance problems.
You can use all CLUE commands when analyzing crash dumps; the only CLUE commands that are not allowed when analyzing a running system are CLUE CRASH, CLUE ERRLOG, CLUE HISTORY, and CLUE STACK.
When you reboot the system after a system failure, you automatically invoke SDA by default. To facilitate better crash dump analysis, SDA CLUE commands automatically capture and archive summary dump file information in a CLUE listing file.
A startup command procedure initiates commands that do the following:
Invoke SDA
Issue an SDA CLUE HISTORY command
Create a listing file called CLUE$nodename_ddmmyy_hhmm.LIS
The CLUE HISTORY command adds a one-line summary entry to a history file and saves the following output from SDA CLUE commands in the listing file:
Crash dump summary information
System configuration
Stack decoder
Page and swap files
Memory management statistics
Process DCL recall buffer
Active XQP processes
XQP cache header
The contents of this CLUE list file can help you analyze a system failure. If these files accumulate more space than the threshold allows (default is 5000 blocks), the oldest files are deleted until the threshold limit is reached. You can also customize this threshold using the CLUE$MAX_BLOCKS logical name.
For additional information on the contents of the CLUE listing file, see the reference section on CLUE HISTORY.
It is important to remember that CLUE$nodename_ddmmyy_hhmm.LIS contains only an overview of the crash dump and does not always contain enough information to determine the cause of the crash. The dump itself should always be saved using the procedures described in Section 2.2.2, ''Saving System Dumps'' and Section 2.2.4, ''Invoking SDA When Rebooting the System''.
To inhibit the running of CLUE at system startup, define the logical CLUE$INHIBIT in the SYLOGICALS.COM file as /SYS TRUE.
5.2. Displaying Data with CLUE
To invoke a CLUE command, enter the command at the SDA prompt. For example:
SDA> CLUE CONFIG
5.3. Using CLUE with DOSD
DOSD (Dump Off System Disk) allows you to write the system dump file to a device other than the system disk. For SDA CLUE to be able to correctly find the dump file to be analyzed after a system crash, you need to perform the following steps:
Modify the command procedure SYS$MANAGER:SYCONFIG.COM to add the system logical name CLUE$DOSD_DEVICE to point to the device where the dump file resides. You need to supply only the physical or logical device name without a file specification.
Modify the command procedure SYS$MANAGER:SYCONFIG.COM to mount systemwide the device where the dump file resides. Otherwise, SDA CLUE cannot access and analyze the dump file.
In the following example, the dump file has been placed on device $3$DUA25, which has the label DMP$DEV. You need to add the following commands to SYS$MANAGER:SYCONFIG.COM:
$ MOUNT/SYSTEM/NOASSIST $3$DUA25: DMP$DEV DMP$DEV $ DEFINE/SYSTEM CLUE$DOSD_DEVICE DMP$DEV
5.4. SDA CLUE Extension Commands
The following pages describe the SDA CLUE extension commands.
5.4.1. CLUE CALL_FRAME (Alpha Only)
Displays key information, such as the PC of the caller, from the active call frames at the time of the crash.
Format
CLUE CALL_FRAME [/CPU [cpu-id|ALL]
|/PROCESS [/ADDRESS=n|INDEX=n
|/IDENTIFICATION=n|process-name|ALL]]
Parameters
- ALL
When used with /CPU, it requests information about all CPUs in the system. When used with /PROCESS, it requests information about all processes that exist in the system.
- cpu-id
When used with /CPU, it gives the number of the CPU for which information is to be displayed. Use of the cpu-id parameter causes the CLUE CALL_FRAME command to perform an implicit SET CPU command, making the indicated CPU the current CPU for subsequent SDA commands.
- process-name
When used with /PROCESS, it gives the name of the process for which information is to be displayed. Use of the process-name parameter, the /ADDRESS qualifier, the /INDEX qualifier, or the /IDENTIFICATION qualifier causes the CLUE CALL_FRAME command to perform an implicit SET PROCESS command, making the indicated process the current process for subsequent SDA commands. You can determine the names of the processes in the system by issuing a SHOW SUMMARY command.
The process-name can contain up to 15 letters and numerals, including the underscore (_) and dollar sign ($). If it contains any other characters, you must enclose the process-name in quotation marks (" ").
Qualifiers
- /ADDRESS=n
Specifies the PCB address of the desired process when used with CLUE CALL_FRAME/PROCESS.
- /CPU [cpu-id|ALL]
Indicates that the call frame for a CPU is required. Specify the CPU by its number or use ALL to indicate all CPUs.
- /IDENTIFICATION=n
Specifies the identification of the desired process when used with CLUE CALL_FRAME/PROCESS.
- /INDEX=n
Specifies the index of the desired process when used with CLUE CALL_FRAME/PROCESS.
- /PROCESS [process-name|ALL]
Indicates that the call frame for a process is required. The process should be specified with either one of the qualifiers /ADDRESS, /IDENTIFICATION, or /INDEX, or by its name, or by using ALL to indicate all processes.
Description
The CLUE CALL_FRAME command displays call chain information for a process or a CPU. The process context calls work on both the running system and dump file; the CPU context calls only on dump files.
If neither /CPU nor /PROCESS is specified, the parameter (CPU-id or process-name) is ignored and the call frame for the SDA current process is displayed.
Examples
SDA> CLUE CALL/PROCESS IPCACP Call Chain: Process index: 000B Process name: IPCACP PCB: 8136EF00 ----------------------------------------------------------------------- Procedure Frame Procedure Entry Return Address --------------- ---------------------------------- --------------------------- 7FFA1CA0 Null 800C8C90 SCH$WAIT_PROC_C 7FFA1D00 Stack 800D9250 SYS$HIBER_C 0003045C IPCACP+0003045C 7FFA1D50 Stack 00030050 IPCACP+00030050 800D11C8 EXE$CMKRNL_C+000D8 7FFA1E60 Null 800B6120 EXE$BLDPKTSWPR_C 7FFA1E78 Null 800B6120 EXE$BLDPKTSWPR_C 7FFA1EC0 Null 80248120 NSA$CHECK_PRIVILEGE_C 7FFA1F00 Null 80084640 EXE$CMODEXECX_C 7FFA1F70 Stack 800D10F0 EXE$CMKRNL_C 80084CC8 EXE$CMODKRNL_C+00198 7B01FAB0 Stack 00030010 IPCACP+00030010 83EA3454 SYS$IMGSTA_C+00154 7B01FB10 Stack 83EA3300 SYS$IMGSTA_C 83D99CC4 EXE$PROC_IMGACT_C+00384 7B01FBA0 Stack 83D99BA0 EXE$PROC_IMGACT_C+00260 83D99B9C EXE$PROC_IMGACT_C+0025C
In this example, the CLUE CALL_FRAME command displays the call frame from the process IPCACP.
SDA> CLUE CALL/CPU ALL Call Chain: Process index: 0000 Process name: NULL PCB: 827377C0 (CPU 0) ------------------------------------------------------------------- Procedure Frame Procedure Entry Return Address --------------- ---------------------------------- --------------------------- 8F629D28 Null 80205E00 SYS$SCS+05E00 8F629D68 Null 8020A850 SCS$REC_MSGREC_C 8F629D98 Null 914A5340 SYS$PBDRIVER+07340 8F629DB8 Null 914A4FD0 SYS$PBDRIVER+06FD0 8F629DE0 Stack 914AACF0 SYS$PBDRIVER+0CCF0 914AE5CC SYS$PBDRIVER+105CC 8F629E50 Stack 914AE418 SYS$PBDRIVER+10418 800503B0 EXE_STD$QUEUE_FORK_C+00350 8F629F88 Null 800E95F4 SCH$WAIT_ANY_MODE_C 8F629FD0 Stack 800D0F80 SCH$IDLE_C 800E92D0 SCH$INTERRUPT+00BB0 Call Chain: Process index: 0000 Process name: NULL PCB: 827377C0 (CPU 2) ------------------------------------------------------------------- Procedure Frame Procedure Entry Return Address --------------- -------------------------------- --------- 90FCBF88 Null 800E95F4 SCH$WAIT_ANY_MODE_C 90FCBFC8 Null 800E95F4 SCH$WAIT_ANY_MODE_C 90FCBFD0 Stack 800D0F80 SCH$IDLE_C 800E92D0 SCH$INTERRUPT+00BB0 Call Chain: Process index: 0000 Process name: NULL PCB: 827377C0 (CPU 6) ------------------------------------------------------------------- Procedure Frame Procedure Entry Return Address --------------- ------------------------------ --------------------------- 90FCBF88 Null 800E95FA SCH$WAIT_ANY_MORE_c 90FD9F88 Null 800E95F4 SCH$WAIT_ANY_MODE_C 90FD9FD0 Stack 800D0F80 SCH$IDLE_C 800E92D0 SCH$INTERRUPT+00BB0
In this example, CLUE/CPU ALL shows the call frame for all CPUs.
5.4.2. CLUE CLEANUP
Performs housekeeping operations to conserve disk space.
Format
CLUE CLEANUP
Parameters
None.
Qualifiers
None.
Description
CLUE CLEANUP performs housekeeping operations to conserve disk space. To avoid filling up the system disk with listing files generated by CLUE, CLUE CLEANUP is run during system startup to check the overall disk space used by all CLUE$*.LIS files.
If the CLUE$COLLECT:CLUE$*.LIS files occupy more space than the logical CLUE$MAX_BLOCKS allows, then the oldest files are deleted until the threshold is reached. If this logical name is not defined, a default value of 5,000 disk blocks is assumed. A value of zero disables housekeeping and no check on the disk space is performed.
Examples
SDA> CLUE CLEANUP %CLUE-I-CLEANUP, housekeeping started... %CLUE-I-MAXBLOCK, maximum blocks allowed 5000 blocks %CLUE-I-STAT, total of 4 CLUE files, 192 blocks.
In this example, the CLUE CLEANUP command displays that the total number of blocks of disk space used by CLUE files does not exceed the maximum number of blocks allowed. No files are deleted.
5.4.3. CLUE CONFIG
Displays the system, memory, and device configurations.
Format
CLUE CONFIG
Parameters
None.
Qualifiers
- /ADAPTER
Displays only the part of the system configuration that contains information about the adapters and devices on the system.
- /CPU
Displays only the part of the system configuration that contains information about the CPUs.
- /MEMORY
Displays only the part of the system configuration that contains information about the layout of physical memory.
Description
CLUE CONFIG displays the system, memory, and device configurations. If no qualifier is specified, the entire system configuration is displayed (memory, CPUs, adapters, and devices), plus additional system information.
5.4.4. CLUE CRASH
Displays a crash dump summary.
Format
CLUE CRASH
Parameters
None.
Qualifiers
None.
Description
CLUE CRASH displays a crash dump summary, which includes the following items:
Bugcheck type
Current process and image
Failing PC and PS
Executive image section name and offset
General registers
Failing instructions
Exception frame, signal and mechanism arrays (if available)
CPU state information (spinlock related bugchecks only)
Examples
SDA> CLUE CRASH Crash Time: 30-AUG-1996 13:13:46.83 Bugcheck Type: SSRVEXCEPT, Unexpected system service exception Node: SWPCTX (Standalone) CPU Type: DEC 3000 Model 400 VMS Version: X6AF-FT2 Current Process: SYSTEM Current Image: $31$DKB0:[SYS0.][SYSMGR]X.EXE;1 Failing PC: 00000000.00030078 SYS$K_VERSION_01+00078 Failing PS: 00000000.00000003 Module: X Offset: 00030078 Boot Time: 30-AUG-1996 09:06:22.00 System Uptime: 0 04:07:24.83 Crash/Primary CPU: 00/00 System/CPU Type: 0402 Saved Processes: 18 Pagesize: 8 KByte (8192 bytes) Physical Memory: 64 MByte (8192 PFNs, contiguous memory) Dumpfile Pagelets: 98861 blocks Dump Flags: olddump,writecomp,errlogcomp,dump_style Dump Type: raw,selective EXE$GL_FLAGS: poolpging,init,bugdump Paging Files: 1 Pagefile and 1 Swapfile installed Stack Pointers: KSP = 00000000.7FFA1C98 ESP = 00000000.7FFA6000 SSP = 00000000.7FFAC100 USP = 00000000.7AFFBAD0 General Registers: R0 = 00000000.00000000 R1 = 00000000.7FFA1EB8 R2 = FFFFFFFF.80D0E6C0 R3 = FFFFFFFF.80C63460 R4 = FFFFFFFF.80D12740 R5 = 00000000.000000C8 R6 = 00000000.00030038 R7 = 00000000.7FFA1FC0 R8 = 00000000.7FFAC208 R9 = 00000000.7FFAC410 R10 = 00000000.7FFAD238 R11 = 00000000.7FFCE3E0 R12 = 00000000.00000000 R13 = FFFFFFFF.80C6EB60 R14 = 00000000.00000000 R15 = 00000000.009A79FD R16 = 00000000.000003C4 R17 = 00000000.7FFA1D40 R18 = FFFFFFFF.80C05C38 R19 = 00000000.00000000 R20 = 00000000.7FFA1F50 R21 = 00000000.00000000 R22 = 00000000.00000001 R23 = 00000000.7FFF03C8 R24 = 00000000.7FFF0040 AI = 00000000.00000003 RA = FFFFFFFF.82A21080 PV = FFFFFFFF.829CF010 R28 = FFFFFFFF.8004B6DC FP = 00000000.7FFA1CA0 PC = FFFFFFFF.82A210B4 PS = 18000000.00000000 Exception Frame: R2 = 00000000.00000003 R3 = FFFFFFFF.80C63460 R4 = FFFFFFFF.80D12740 R5 = 00000000.000000C8 R6 = 00000000.00030038 R7 = 00000000.7FFA1FC0 PC = 00000000.00030078 PS = 00000000.00000003 Signal Array: 64-bit Signal Array: Arg Count = 00000005 Arg Count = 00000005 Condition = 0000000C Condition = 00000000.0000000C Argument #2 = 00010000 Argument #2 = 00000000.00010000 Argument #3 = 00000000 Argument #3 = 00000000.00000000 Argument #4 = 00030078 Argument #4 = 00000000.00030078 Argument #5 = 00000003 Argument #5 = 00000000.00000003 Mechanism Array: Arguments = 0000002C Establisher FP = 00000000.7AFFBAD0 Flags = 00000000 Exception FP = 00000000.7FFA1F00 Depth = FFFFFFFD Signal Array = 00000000.7FFA1EB8 Handler Data = 00000000.00000000 Signal64 Array = 00000000.7FFA1ED0 R0 = 00000000.00020000 R1 = 00000000.00000000 R16 = 00000000.00020004 R17 = 00000000.00010050 R18 = FFFFFFFF.FFFFFFFF R19 = 00000000.00000000 R20 = 00000000.7FFA1F50 R21 = 00000000.00000000 R22 = 00000000.00010050 R23 = 00000000.00000000 R24 = 00000000.00010051 R25 = 00000000.00000000 R26 = FFFFFFFF.8010ACA4 R27 = 00000000.00010050 R28 = 00000000.00000000 System Registers: Page Table Base Register (PTBR) 00000000.00001136 Processor Base Register (PRBR) FFFFFFFF.80D0E000 Privileged Context Block Base (PCBB) 00000000.003FE080 System Control Block Base (SCBB) 00000000.000001DC Software Interrupt Summary Register (SISR) 00000000.00000000 Address Space Number (ASN) 00000000.0000002F AST Summary / AST Enable (ASTSR_ASTEN) 00000000.0000000F Floating-Point Enable (FEN) 00000000.00000000 Interrupt Priority Level (IPL) 00000000.00000000 Machine Check Error Summary (MCES) 00000000.00000000 Virtual Page Table Base Register (VPTB) FFFFFFFC.00000000 Failing Instruction: SYS$K_VERSION_01+00078: LDL R28,(R28) Instruction Stream (last 20 instructions): SYS$K_VERSION_01+00028: LDQ R16,#X0030(R13) SYS$K_VERSION_01+0002C: LDQ R27,#X0048(R13) SYS$K_VERSION_01+00030: LDA R17,(R28) SYS$K_VERSION_01+00034: JSR R26,(R26) SYS$K_VERSION_01+00038: LDQ R26,#X0038(R13) SYS$K_VERSION_01+0003C: BIS R31,SP,SP SYS$K_VERSION_01+00040: BIS R31,R26,R0 SYS$K_VERSION_01+00044: BIS R31,FP,SP SYS$K_VERSION_01+00048: LDQ R28,#X0008(SP) SYS$K_VERSION_01+0004C: LDQ R13,#X0010(SP) SYS$K_VERSION_01+00050: LDQ FP,#X0018(SP) SYS$K_VERSION_01+00054: LDA SP,#X0020(SP) SYS$K_VERSION_01+00058: RET R31,(R28) SYS$K_VERSION_01+0005C: BIS R31,R31,R31 SYS$K_VERSION_01+00060: LDA SP,#XFFE0(SP) SYS$K_VERSION_01+00064: STQ FP,#X0018(SP) SYS$K_VERSION_01+00068: STQ R27,(SP) SYS$K_VERSION_01+0006C: BIS R31,SP,FP SYS$K_VERSION_01+00070: STQ R26,#X0010(SP) SYS$K_VERSION_01+00074: LDA R28,(R31) SYS$K_VERSION_01+00078: LDL R28,(R28) SYS$K_VERSION_01+0007C: BEQ R28,#X000007 SYS$K_VERSION_01+00080: LDQ R26,#XFFE8(R27) SYS$K_VERSION_01+00084: BIS R31,R26,R0 SYS$K_VERSION_01+00088: BIS R31,FP,SP
5.4.5. CLUE ERRLOG
Extracts the error log buffers from the dump file and places them into the binary file called CLUE$ERRLOG.SYS.
Format
CLUE ERRLOG [/OLD]
Parameters
None.
Qualifier
- /OLD
Dumps the errorlog buffers into a file using the old errorlog format. The default action, if /OLD is not specified, is to dump the errorlog buffers in the common event header format.
Description
CLUE ERRLOG extracts the error log buffers from the dump file and places them into the binary file called CLUE$ERRLOG.SYS.
These buffers contain messages not yet written to the error log file at the time of the failure. When you analyze a failure on the same system on which it occurred, you can run the Error Log utility on the actual error log file to see these error log messages. When analyzing a failure from another system, use the CLUE ERRLOG command to create a file containing the failing system's error log messages just prior to the failure. System failures are often triggered by hardware problems, so determining what, if any, hardware errors occurred prior to the failure can help you troubleshoot a failure.
You can define the logical CLUE$ERRLOG to any file specification if you want error log information written to a file other than CLUE$ERRLOG.SYS.
Note
You need at least DECevent V2.9 to analyze the new common event header (CEH) format file. The old format file can be analyzed by ANALYZE/ERROR or any version of DECevent.
Examples
SDA> CLUE ERRLOG
Sequence Date Time
-------- ----------- -----------
128 11-MAY-1994 00:39:31.30
129 11-MAY-1994 00:39:32.12
130 11-MAY-1994 00:39:44.83
131 11-MAY-1994 00:44:38.97 * Crash EntryIn addition to writing the error log buffers into CLUE$ERRLOG.SYS, the CLUE ERRLOG command displays the sequence, date, and time of each error log buffer extracted from the dump file.
5.4.6. CLUE FRU
Outputs the Field Replacement Unit (FRU) table to a file for display by DECevent.
Format
CLUE FRU
Parameters
None.
Qualifiers
None.
Description
The FRU command extracts the FRU table into an output file (CLUE$FRU.SYS), which can then be displayed by DECevent. This command works on the running system, as well as on dump files.
5.4.7. CLUE HISTORY
Updates history file and generates crash dump summary output.
Format
CLUE HISTORY [/qualifier]
Parameters
None.
Qualifier
- /OVERDRIVE
Allows execution of this command even if the dump file has already been analyzed (DMP$V_OLDDUMP bit set).
Description
This command updates the history file pointed to by the logical name CLUE$HISTORY with a one-line entry and the major crash dump summary information. If CLUE$HISTORY is not defined, a file CLUE$HISTORY.DAT in your default directory will be created.
In addition, a listing file with summary information about the system failure is created in the directory pointed to by CLUE$COLLECT. The file name is of the form CLUE$node_ddmmyy_hhmm.LIS where the timestamp (hhmm) corresponds to the system failure time and not the time when the file was created.
The listing file contains summary information collected from the following SDA commands:
CLUE CRASH
CLUE CONFIG
CLUE MEMORY/FILES
CLUE MEMORY/STATISTIC
CLUE PROCESS/RECALL
CLUE XQP/ACTIVE
Refer to the reference section for each of these commands to see examples of the displayed information.
The logical name CLUE$FLAG controls how much information is written to the listing file.
Bit 0---Include crash dump summary
Bit 1---Include system configuration
Bit 2---Include stack decoding information
Bit 3---Include page and swap file usage
Bit 4---Include memory management statistics
Bit 5---Include process DCL recall buffer
Bit 6---Include active XQP process information
Bit 7---Include XQP cache header
If this logical name is undefined, all bits are set by default internally and all information is written to the listing file. If the value is zero, no listing file is generated. The value has to be supplied in hexadecimal form (for example, DEFINE CLUE$FLAG 81 will include the crash dump summary and the XQP cache header information).
If the logical name CLUE$SITE_PROC points to a valid and existing file, it will be executed as the final step of the CLUE HISTORY command (for example, automatic saving of the dump file during system startup). If used, this file should contain only valid SDA commands.
Refer to Section 2.2.4, ''Invoking SDA When Rebooting the System'' for more information on site-specific command files.
5.4.8. CLUE MCHK
This command is obsolete.
Format
CLUE MCHK
Parameters
None.
Qualifiers
None.
Description
The CLUE MCMK command has been withdrawn. Issuing the command produces the following output, explaining the correct way to obtain MACHINECHECK information from a crash dump.
Please use the following commands in order to extract the errorlog buffers from the dumpfile header and analyze the machine check entry: $ analyze/crash sys$system:sysdump.dmp SDA> clue errlog SDA> exit $ diagnose clue$errlog
5.4.9. CLUE MEMORY
Displays memory- and pool-related information.
Format
CLUE MEMORY [/qualifier[,...]]
Parameters
None.
Qualifiers
- /FILES
Displays information about page and swap file usage.
- /FREE
Validates and displays dynamic nonpaged free packet list queue. (See also /FULL.)
- /FULL
Ignored except when used with /FREE or /GH. When used with /FREE, the first 16 bytes of each entry on the free packet list is displayed. When used with /GH, a list of the images that use each granularity hint region is displayed.
- /GH
Displays information about the granularity hint regions. (See also /FULL.)
- /LAYOUT
Decodes and displays much of the system virtual address space layout.
- /LOOKASIDE
Validates the lookaside list queue heads and counts the elements for each list.
- /STATISTIC
Displays systemwide performance data such as page fault, I/O, pool, lock manager, MSCP, and file system cache.
Description
The CLUE MEMORY command displays memory- and pool-related information.
Examples
SDA> CLUE MEMORY/FILES Paging File Usage (blocks): --------------------------- Swapfile (Index 1) Device DKA0: PFL Address FFFFFFFF.81531340 UCB Address FFFFFFFF.814AAF00 Free Blocks 44288 Bitmap FFFFFFFF.815313E0 Total Size (blocks) 44288 Flags inited,swap_file Total Write Count 0 Total Read Count 0 Smallest Chunk (pages) 2768 Largest Chunk (pages) 2768 Chunks GEQ 64 Pages 1 Chunks LT 64 Pages 0 Pagefile (Index 254) Device DKA0: PFL Address FFFFFFFF.8152E440 UCB Address FFFFFFFF.814AAF00 Free Blocks 1056768 Bitmap FFFFFFFF.6FB16008 Total Size (blocks) 1056768 Flags inited Total Write Count 0 Total Read Count 0 Smallest Chunk (pages) 66048 Largest Chunk (pages) 66048 Chunks GEQ 64 Pages 1 Chunks LT 64 Pages 0 Summary: 1 Pagefile and 1 Swapfile installed Total Size of all Swap Files: 44288 blocks Total Size of all Paging Files: 1056768 blocks Total Committed Paging File Usage: 344576 blocks
This example shows the display produced by the CLUE MEMORY/FILES command.
SDA> CLUE MEMORY/FREE/FULL Non-Paged Dynamic Storage Pool - Variable Free Packet Queue: ------------------------------------------------------------ CLASSDR FFFFFFFF.80D157C0 : 64646464 64646464 00000040 80D164C0 ÀdÑ.@...dddddddd CLASSDR FFFFFFFF.80D164C0 : 64646464 64646464 00000080 80D17200 .rÑ.....dddddddd CLASSDR FFFFFFFF.80D17200 : 64646464 64646464 00000080 80D21AC0 À.Ò.....dddddddd CLASSDR FFFFFFFF.80D21AC0 : 64646464 64646464 00000080 80D228C0 À(Ò.....dddddddd VCC FFFFFFFF.80D228C0 : 801CA5E8 026F0040 00000040 80D23E40 @>Ò.@...@.o.è¥.. CLASSDR FFFFFFFF.80D23E40 : 64646464 64646464 00000040 80D24040 @@Ò.@...dddddddd CLASSDR FFFFFFFF.80D24040 : 64646464 64646464 00000040 80D26FC0 ÀoÒ.@...dddddddd CLASSDR FFFFFFFF.80D26FC0 : 64646464 64646464 00000080 80D274C0 ÀtÒ.....dddddddd CLASSDR FFFFFFFF.80D274C0 : 64646464 64646464 00000040 80D2E200 .âÒ.@...dddddddd CLASSDR FFFFFFFF.80D2E200 : 64646464 64646464 00000080 80D2E440 @äÒ.....dddddddd CLASSDR FFFFFFFF.80D2E440 : 64646464 64646464 00000040 80D2F000 .Ò.@...dddddddd CLASSDR FFFFFFFF.80D2F000 : 64646464 64646464 00000080 80D2F400 .ôÒ.....dddddddd . . . CLASSDR FFFFFFFF.80E91D40 : 64646464 64646464 00000500 80E983C0 À.é.....dddddddd CLASSDR FFFFFFFF.80E983C0 : 64646464 64646464 00031C40 00000000 ....@...dddddddd Free Packet Queue, Status: Valid, 174 elements Largest free chunk: 00031C40 (hex) 203840 (dec) bytes Total free dynamic space: 0003D740 (hex) 251712 (dec) bytes
The CLUE MEMORY/FREE/FULL command validates and displays dynamic nonpaged free packet list queue.
SDA> CLUE MEMORY/GH/FULL Granularity Hint Regions - Huge Pages: -------------------------------------- Execlet Code Region Pages/Slices Base/End VA FFFFFFFF.80000000 FFFFFFFF.80356000 Current Size 427/ 427 Base/End PA 00000000.00400000 00000000.00756000 Free / 0 Total Size 00000000.00356000 3.3 MB In Use / 427 Bitmap VA/Size FFFFFFFF.80D17CC0 00000000.00000040 Initial Size 512/ 512 Slice Size 00000000.00002000 Released 85/ 85 Next free Slice 00000000.000001AB Image Base End Length SYS$PUBLIC_VECTORS FFFFFFFF.80000000 FFFFFFFF.80001A00 00001A00 SYS$BASE_IMAGE FFFFFFFF.80002000 FFFFFFFF.8000D400 0000B400 SYS$CNBTDRIVER FFFFFFFF.8000E000 FFFFFFFF.8000F000 00001000 SYS$NISCA_BTDRIVER FFFFFFFF.80010000 FFFFFFFF.8001FA00 0000FA00 SYS$ESBTDRIVER FFFFFFFF.80020000 FFFFFFFF.80022400 00002400 SYS$OPDRIVER FFFFFFFF.80024000 FFFFFFFF.80027C00 00003C00 SYSTEM_DEBUG FFFFFFFF.80028000 FFFFFFFF.80050200 00028200 SYSTEM_PRIMITIVES FFFFFFFF.80052000 FFFFFFFF.80089000 00037000 SYSTEM_SYNCHRONIZATION FFFFFFFF.8008A000 FFFFFFFF.80095400 0000B400 ERRORLOG FFFFFFFF.80096000 FFFFFFFF.80099200 00003200 SYS$CPU_ROUTINES_0402 FFFFFFFF.8009A000 FFFFFFFF.800A3A00 00009A00 EXCEPTION_MON FFFFFFFF.800A4000 FFFFFFFF.800BC800 00018800 IO_ROUTINES_MON FFFFFFFF.800BE000 FFFFFFFF.800E2000 00024000 SYSDEVICE FFFFFFFF.800E2000 FFFFFFFF.800E5C00 00003C00 PROCESS_MANAGEMENT_MON FFFFFFFF.800E6000 FFFFFFFF.8010B000 00025000 SYS$VM FFFFFFFF.8010C000 FFFFFFFF.80167200 0005B200 SHELL8K FFFFFFFF.80168000 FFFFFFFF.80169200 00001200 LOCKING FFFFFFFF.8016A000 FFFFFFFF.8017BE00 00011E00 MESSAGE_ROUTINES FFFFFFFF.8017C000 FFFFFFFF.80182A00 00006A00 LOGICAL_NAMES FFFFFFFF.80184000 FFFFFFFF.80186C00 00002C00 F11BXQP FFFFFFFF.80188000 FFFFFFFF.80190400 00008400 SYSLICENSE FFFFFFFF.80192000 FFFFFFFF.80192400 00000400 IMAGE_MANAGEMENT FFFFFFFF.80194000 FFFFFFFF.80197A00 00003A00 SECURITY FFFFFFFF.80198000 FFFFFFFF.801A0E00 00008E00 SYSGETSYI FFFFFFFF.801A2000 FFFFFFFF.801A3A00 00001A00 SYS$TRANSACTION_SERVICES FFFFFFFF.801A4000 FFFFFFFF.801C5000 00021000 SYS$UTC_SERVICES FFFFFFFF.801C6000 FFFFFFFF.801C7000 00001000 SYS$VCC_MON FFFFFFFF.801C8000 FFFFFFFF.801D4E00 0000CE00 SYS$IPC_SERVICES FFFFFFFF.801D6000 FFFFFFFF.80214A00 0003EA00 SYSLDR_DYN FFFFFFFF.80216000 FFFFFFFF.80219200 00003200 SYS$MME_SERVICES FFFFFFFF.8021A000 FFFFFFFF.8021B000 00001000 SYS$TTDRIVER FFFFFFFF.8021C000 FFFFFFFF.8022FE00 00013E00 SYS$PKCDRIVER FFFFFFFF.80230000 FFFFFFFF.80240400 00010400 SYS$DKDRIVER FFFFFFFF.80242000 FFFFFFFF.80251600 0000F600 RMS FFFFFFFF.80252000 FFFFFFFF.802C5E00 00073E00 SYS$GXADRIVER FFFFFFFF.802C6000 FFFFFFFF.802CE000 00008000 SYS$ECDRIVER FFFFFFFF.802CE000 FFFFFFFF.802D1000 00003000 SYS$LAN FFFFFFFF.802D2000 FFFFFFFF.802D8E00 00006E00 SYS$LAN_CSMACD FFFFFFFF.802DA000 FFFFFFFF.802E6600 0000C600 SYS$MKDRIVER FFFFFFFF.802E8000 FFFFFFFF.802F1C00 00009C00 SYS$YRDRIVER FFFFFFFF.802F2000 FFFFFFFF.802F9600 00007600 SYS$SODRIVER FFFFFFFF.802FA000 FFFFFFFF.802FF000 00005000 SYS$INDRIVER FFFFFFFF.80300000 FFFFFFFF.8030EA00 0000EA00 NETDRIVER FFFFFFFF.80310000 FFFFFFFF.80310200 00000200 NETDRIVER FFFFFFFF.80312000 FFFFFFFF.80329E00 00017E00 SYS$IMDRIVER FFFFFFFF.8032A000 FFFFFFFF.8032EA00 00004A00 SYS$IKDRIVER FFFFFFFF.80330000 FFFFFFFF.8033AC00 0000AC00 NDDRIVER FFFFFFFF.8033C000 FFFFFFFF.8033F800 00003800 SYS$WSDRIVER FFFFFFFF.80340000 FFFFFFFF.80341600 00001600 SYS$CTDRIVER FFFFFFFF.80342000 FFFFFFFF.8034D200 0000B200 SYS$RTTDRIVER FFFFFFFF.8034E000 FFFFFFFF.80351800 00003800 SYS$FTDRIVER FFFFFFFF.80352000 FFFFFFFF.80354200 00002200 Execlet Data Region Pages/Slices Base/End VA FFFFFFFF.80C00000 FFFFFFFF.80CC0000 Current Size 96/ 1536 Base/End PA 00000000.00800000 00000000.008C0000 Free / 11 Total Size 00000000.000C0000 0.7 MB In Use / 1525 Bitmap VA/Size FFFFFFFF.80D17D00 00000000.00000100 Initial Size 128/ 2048 Slice Size 00000000.00000200 Released 32/ 512 Next free Slice 00000000.000005F5 Image Base End Length SYS$PUBLIC_VECTORS FFFFFFFF.80C00000 FFFFFFFF.80C05000 00005000 SYS$BASE_IMAGE FFFFFFFF.80C05000 FFFFFFFF.80C25E00 00020E00 SYS$CNBTDRIVER FFFFFFFF.80C25E00 FFFFFFFF.80C26200 00000400 SYS$NISCA_BTDRIVER FFFFFFFF.80C26200 FFFFFFFF.80C29400 00003200 SYS$ESBTDRIVER FFFFFFFF.80C29400 FFFFFFFF.80C29800 00000400 SYS$OPDRIVER FFFFFFFF.80C29800 FFFFFFFF.80C2A200 00000A00 SYSTEM_DEBUG FFFFFFFF.80C2A200 FFFFFFFF.80C4E400 00024200 SYSTEM_PRIMITIVES FFFFFFFF.80C4E400 FFFFFFFF.80C58200 00009E00 SYSTEM_SYNCHRONIZATION FFFFFFFF.80C58200 FFFFFFFF.80C5A000 00001E00 ERRORLOG FFFFFFFF.80C5A000 FFFFFFFF.80C5A600 00000600 SYS$CPU_ROUTINES_0402 FFFFFFFF.80C5A600 FFFFFFFF.80C5CA00 00002400 EXCEPTION_MON FFFFFFFF.80C5CA00 FFFFFFFF.80C64C00 00008200 IO_ROUTINES_MON FFFFFFFF.80C64C00 FFFFFFFF.80C6AA00 00005E00 SYSDEVICE FFFFFFFF.80C6AA00 FFFFFFFF.80C6B600 00000C00 PROCESS_MANAGEMENT_MON FFFFFFFF.80C6B600 FFFFFFFF.80C72600 00007000 SYS$VM FFFFFFFF.80C72600 FFFFFFFF.80C79000 00006A00 SHELL8K FFFFFFFF.80C79000 FFFFFFFF.80C7A000 00001000 LOCKING FFFFFFFF.80C7A000 FFFFFFFF.80C7BA00 00001A00 MESSAGE_ROUTINES FFFFFFFF.80C7BA00 FFFFFFFF.80C7D000 00001600 LOGICAL_NAMES FFFFFFFF.80C7D000 FFFFFFFF.80C7E200 00001200 F11BXQP FFFFFFFF.80C7E200 FFFFFFFF.80C7FA00 00001800 SYSLICENSE FFFFFFFF.80C7FA00 FFFFFFFF.80C7FE00 00000400 IMAGE_MANAGEMENT FFFFFFFF.80C7FE00 FFFFFFFF.80C80600 00000800 SECURITY FFFFFFFF.80C80600 FFFFFFFF.80C83000 00002A00 SYSGETSYI FFFFFFFF.80C83000 FFFFFFFF.80C83200 00000200 SYS$TRANSACTION_SERVICES FFFFFFFF.80C83200 FFFFFFFF.80C89E00 00006C00 SYS$UTC_SERVICES FFFFFFFF.80C89E00 FFFFFFFF.80C8A200 00000400 SYS$VCC_MON FFFFFFFF.80C8A200 FFFFFFFF.80C8BC00 00001A00 SYS$IPC_SERVICES FFFFFFFF.80C8BC00 FFFFFFFF.80C91000 00005400 SYSLDR_DYN FFFFFFFF.80C91000 FFFFFFFF.80C92200 00001200 SYS$MME_SERVICES FFFFFFFF.80C92200 FFFFFFFF.80C92600 00000400 SYS$TTDRIVER FFFFFFFF.80C92600 FFFFFFFF.80C94C00 00002600 SYS$PKCDRIVER FFFFFFFF.80C94C00 FFFFFFFF.80C96A00 00001E00 SYS$DKDRIVER FFFFFFFF.80C96A00 FFFFFFFF.80C99800 00002E00 RMS FFFFFFFF.80C99800 FFFFFFFF.80CAAC00 00011400 RECOVERY_UNIT_SERVICES FFFFFFFF.80CAAC00 FFFFFFFF.80CAB000 00000400 SYS$GXADRIVER FFFFFFFF.80CAB000 FFFFFFFF.80CAF000 00004000 SYS$ECDRIVER FFFFFFFF.80CAF000 FFFFFFFF.80CAFC00 00000C00 SYS$LAN FFFFFFFF.80CAFC00 FFFFFFFF.80CB0800 00000C00 SYS$LAN_CSMACD FFFFFFFF.80CB0800 FFFFFFFF.80CB1800 00001000 SYS$MKDRIVER FFFFFFFF.80CB1800 FFFFFFFF.80CB3000 00001800 SYS$YRDRIVER FFFFFFFF.80CB3000 FFFFFFFF.80CB3C00 00000C00 SYS$SODRIVER FFFFFFFF.80CB3C00 FFFFFFFF.80CB4E00 00001200 SYS$INDRIVER FFFFFFFF.80CB4E00 FFFFFFFF.80CB5E00 00001000 NETDRIVER FFFFFFFF.80CB5E00 FFFFFFFF.80CB8800 00002A00 SYS$IMDRIVER FFFFFFFF.80CB8800 FFFFFFFF.80CB9400 00000C00 SYS$IKDRIVER FFFFFFFF.80CB9400 FFFFFFFF.80CBAA00 00001600 NDDRIVER FFFFFFFF.80CBAA00 FFFFFFFF.80CBB400 00000A00 SYS$WSDRIVER FFFFFFFF.80CBB400 FFFFFFFF.80CBBC00 00000800 SYS$CTDRIVER FFFFFFFF.80CBBC00 FFFFFFFF.80CBD800 00001C00 SYS$RTTDRIVER FFFFFFFF.80CBD800 FFFFFFFF.80CBE200 00000A00 SYS$FTDRIVER FFFFFFFF.80CBE200 FFFFFFFF.80CBEA00 00000800 11 free Slices FFFFFFFF.80CBEA00 FFFFFFFF.80CC0000 00001600 S0/S1 Executive Data Region Pages/Slices Base/End VA FFFFFFFF.80D00000 FFFFFFFF.80ECA000 Current Size 229/ 229 Base/End PA 00000000.00900000 00000000.00ACA000 Free / 0 Total Size 00000000.001CA000 1.7 MB In Use / 229 Bitmap VA/Size FFFFFFFF.80D17E00 00000000.00000020 Initial Size 229/ 229 Slice Size 00000000.00002000 Released 0/ 0 Next free Slice 00000000.00000007 Item Base End Length System Header FFFFFFFF.80D00000 FFFFFFFF.80D0A000 0000A000 Error Log Allocation Buffers FFFFFFFF.80D0A000 FFFFFFFF.80D0C000 00002000 Nonpaged Pool (initial size) FFFFFFFF.80D0E000 FFFFFFFF.80ECA000 001BC000 Resident Image Code Region Pages/Slices Base/End VA FFFFFFFF.80400000 FFFFFFFF.80C00000 Current Size 1024/ 1024 Base/End PA 00000000.00C00000 00000000.01400000 Free / 223 Total Size 00000000.00800000 8.0 MB In Use / 801 Bitmap VA/Size FFFFFFFF.80D17E20 00000000.00000080 Initial Size 1024/ 1024 Slice Size 00000000.00002000 Released 0/ 0 Next free Slice 00000000.00000321 Image Base End Length LIBRTL FFFFFFFF.80400000 FFFFFFFF.8049EA00 0009EA00 LIBOTS FFFFFFFF.804A0000 FFFFFFFF.804AEC00 0000EC00 CMA$TIS_SHR FFFFFFFF.804B0000 FFFFFFFF.804B2600 00002600 DPML$SHR FFFFFFFF.804B4000 FFFFFFFF.8050B600 00057600 DECC$SHR FFFFFFFF.8050C000 FFFFFFFF.80657000 0014B000 SECURESHRP FFFFFFFF.80658000 FFFFFFFF.80676000 0001E000 SECURESHR FFFFFFFF.80676000 FFFFFFFF.8068C000 00016000 SECURESHR FFFFFFFF.8068C000 FFFFFFFF.8068C200 00000200 LBRSHR FFFFFFFF.8068E000 FFFFFFFF.806A3E00 00015E00 DECW$TRANSPORT_COMMON FFFFFFFF.806A4000 FFFFFFFF.806B0C00 0000CC00 CDE$UNIX_ROUTINES FFFFFFFF.806B2000 FFFFFFFF.806C1E00 0000FE00 DECW$XLIBSHR FFFFFFFF.806C2000 FFFFFFFF.80781C00 000BFC00 DECW$XTLIBSHRR5 FFFFFFFF.80782000 FFFFFFFF.807C7600 00045600 DECW$XMLIBSHR12 FFFFFFFF.807C8000 FFFFFFFF.8096AE00 001A2E00 DECW$MRMLIBSHR12 FFFFFFFF.8096C000 FFFFFFFF.80994200 00028200 DECW$DXMLIBSHR12 FFFFFFFF.80996000 FFFFFFFF.80A40400 000AA400 223 free Slices FFFFFFFF.80A42000 FFFFFFFF.80C00000 001BE000 S2 Executive Data Region Pages/Slices Base/End VA FFFFFFFE.00000000 FFFFFFFE.00050000 Current Size 40/ 8 Base/End PA 00000000.00350000 00000000.003A0000 Free / 0 Total Size 00000000.00050000 0.3 MB In Use / 8 Bitmap VA/Size FFFFFFFF.80D17EA0 00000000.00000008 Initial Size 40/ 8 Slice Size 00000000.0000A000 Released 0/ 0 Next free Slice 00000000.00000008 Item Base End Length PFN Database FFFFFFFE.00000000 FFFFFFFE.00050000 00050000
The CLUE MEMORY/GH/FULL command displays data structures that describe granularity hint regions and huge pages.
SDA> CLUE MEMORY/LAYOUT System Virtual Address Space Layout: ------------------------------------ Item Base End Length System Virtual Base Address FFFFFEFE.00000000 PFN Database FFFFFEFE.00000000 FFFFFEFE.00280000 00280000 Permanent Mapping of System L1PT FFFFFEFE.00280000 FFFFFEFE.00282000 00002000 Global Page Table (GPT) FFFFFEFE.00282000 FFFFFEFE.0089CD38 0061AD38 Resource Hash Table FFFFFFFF.6FC1A000 FFFFFFFF.6FC22000 00008000 Lock ID Table FFFFFFFF.6FC22000 FFFFFFFF.70000000 003DE000 Execlet Code Region FFFFFFFF.80000000 FFFFFFFF.80800000 00800000 Resident Image Code Region FFFFFFFF.80800000 FFFFFFFF.81000000 00800000 System Header FFFFFFFF.81400000 FFFFFFFF.8140E000 0000E000 Error Log Allocation Buffers FFFFFFFF.8140E000 FFFFFFFF.81414000 00006000 Nonpaged Pool (initial size) FFFFFFFF.81414000 FFFFFFFF.817C8000 003B4000 Nonpaged Pool Expansion Area FFFFFFFF.817C8000 FFFFFFFF.82664000 00E9C000 Execlet Data Region FFFFFFFF.81000000 FFFFFFFF.81400000 00400000 Fork Buffers Secondary to Primary FFFFFFFF.8268C000 FFFFFFFF.8268E000 00002000 Erase Pattern Buffer Page FFFFFFFF.8268E000 FFFFFFFF.82690000 00002000 363 Balance Slots, 33 pages each FFFFFFFF.826A0000 FFFFFFFF.88436000 05D96000 Paged Pool FFFFFFFF.88436000 FFFFFFFF.887E4000 003AE000 System Control Block (SCB) FFFFFFFF.887E4000 FFFFFFFF.887EC000 00008000 Restart Parameter Block (HWRPB) FFFFFFFF.88832000 FFFFFFFF.88832B48 00000B48 Erase Pattern Page Table Page FFFFFFFF.82690000 FFFFFFFF.82692000 00002000 Posix Cloning Parent Page Mapping FFFFFFFF.88B1E000 FFFFFFFF.88B20000 00002000 Posix Cloning Child Page Mapping FFFFFFFF.88B20000 FFFFFFFF.88B22000 00002000 Swapper Process Kernel Stack FFFFFFFF.88B56000 FFFFFFFF.88B5A000 00004000 Swapper Map FFFFFFFF.88B60000 FFFFFFFF.88B82000 00022000 Idle Loop's Mapping of Zero Pages FFFFFFFF.88C5E000 FFFFFFFF.88C60000 00002000 PrimCPU Machine Check Logout Area FFFFFFFF.88C60400 FFFFFFFF.88C60800 00000400 PrimCPU Sys Context Kernel Stack FFFFFFFF.88C58000 FFFFFFFF.88C5C000 00004000 Tape Mount Verification Buffer FFFFFFFF.88C62000 FFFFFFFF.88C66000 00004000 Mount Verification Buffer FFFFFFFF.88C66000 FFFFFFFF.88C68000 00002000 Demand Zero Optimization Page FFFFFFFF.88E68000 FFFFFFFF.88E6A000 00002000 Executive Mode Data Page FFFFFFFF.88E6A000 FFFFFFFF.88E6C000 00002000 System Space Expansion Region FFFFFFFF.8C000000 FFFFFFFF.FFDF0000 73DF0000 System Page Table Window FFFFFFFF.FFDF0000 FFFFFFFF.FFFF0000 00200000 N/A Space FFFFFFFF.FFFF0000 FFFFFFFF.FFFFFFFF 00010000
The CLUE MEMORY/LAYOUT command decodes and displays the sytem virtual address space layout.
SDA> CLUE MEMORY/LOOKASIDE Non-Paged Dynamic Storage Pool - Lookaside List Queue Information: ------------------------------------------------------------------ Listhead Addr: FFFFFFFF.80C50400 Size: 64 Status: Valid, 11 elements Listhead Addr: FFFFFFFF.80C50408 Size: 128 Status: Valid, 1 element Listhead Addr: FFFFFFFF.80C50410 Size: 192 Status: Valid, 29 elements Listhead Addr: FFFFFFFF.80C50418 Size: 256 Status: Valid, 3 elements Listhead Addr: FFFFFFFF.80C50420 Size: 320 Status: Valid, 7 elements Listhead Addr: FFFFFFFF.80C50428 Size: 384 Status: Valid, 1 element Listhead Addr: FFFFFFFF.80C50430 Size: 448 Status: Valid, 1 element Listhead Addr: FFFFFFFF.80C50438 Size: 512 Status: Valid, 1 element Listhead Addr: FFFFFFFF.80C50440 Size: 576 Status: Valid, 6 elements Listhead Addr: FFFFFFFF.80C50448 Size: 640 Status: Valid, 1 element Listhead Addr: FFFFFFFF.80C50450 Size: 704 Status: Valid, 5 elements Listhead Addr: FFFFFFFF.80C50458 Size: 768 Status: Valid, 1 element Listhead Addr: FFFFFFFF.80C50460 Size: 832 Status: Valid, empty Listhead Addr: FFFFFFFF.80C50468 Size: 896 Status: Valid, 1 element Listhead Addr: FFFFFFFF.80C50470 Size: 960 Status: Valid, 1 element Listhead Addr: FFFFFFFF.80C50478 Size: 1024 Status: Valid, 6 elements Listhead Addr: FFFFFFFF.80C50480 Size: 1088 Status: Valid, 1 element Listhead Addr: FFFFFFFF.80C50488 Size: 1152 Status: Valid, 1 element Listhead Addr: FFFFFFFF.80C50490 Size: 1216 Status: Valid, 1 element Listhead Addr: FFFFFFFF.80C50498 Size: 1280 Status: Valid, 2 elements Listhead Addr: FFFFFFFF.80C504A0 Size: 1344 Status: Valid, 2 elements Listhead Addr: FFFFFFFF.80C504A8 Size: 1408 Status: Valid, 1 element Listhead Addr: FFFFFFFF.80C504B0 Size: 1472 Status: Valid, 1 element Listhead Addr: FFFFFFFF.80C504B8 Size: 1536 Status: Valid, 1 element Listhead Addr: FFFFFFFF.80C504C0 Size: 1600 Status: Valid, 1 element Listhead Addr: FFFFFFFF.80C504C8 Size: 1664 Status: Valid, 1 element Listhead Addr: FFFFFFFF.80C504D0 Size: 1728 Status: Valid, 1 element Listhead Addr: FFFFFFFF.80C504D8 Size: 1792 Status: Valid, 1 element Listhead Addr: FFFFFFFF.80C504E0 Size: 1856 Status: Valid, empty Listhead Addr: FFFFFFFF.80C504E8 Size: 1920 Status: Valid, empty Listhead Addr: FFFFFFFF.80C504F0 Size: 1984 Status: Valid, 1 element Listhead Addr: FFFFFFFF.80C504F8 Size: 2048 Status: Valid, 1 element Listhead Addr: FFFFFFFF.80C50500 Size: 2112 Status: Valid, 1 element Listhead Addr: FFFFFFFF.80C50508 Size: 2176 Status: Valid, 15 elements Listhead Addr: FFFFFFFF.80C50510 Size: 2240 Status: Valid, empty Listhead Addr: FFFFFFFF.80C50518 Size: 2304 Status: Valid, 1 element . . . Total free space: 00016440 (hex) 91200 (dec) bytes
The CLUE MEMORY/LOOKASIDE command summarizes the state of nonpageable lookaside lists. For each list, an indication of whether the queue is well formed is given. If a queue is not well formed or is invalid, messages indicating what is wrong with the queue are displayed. This command is analogous to the SDA command VALIDATE QUEUE.
These messages can also appear frequently when you use the VALIDATE QUEUE command within an SDA session that is analyzing a running system. In a running system, the composition of a queue can change while the command is tracing its links, thus producing an error message.
SDA> CLUE MEMORY/STATISTIC Memory Management Statistics: ----------------------------- Pagefaults: Non-Paged Pool: Total Page Faults 1060897 Successful Expansions 32 Total Page Reads 393414 Unsuccessful Expansions 0 I/O's to read Pages 163341 Failed Pages Accumulator 0 Modified Pages Written 121 Total Alloc Requests 55596 I/O's to write Mod Pages 19 Failed Alloc Requests 0 Demand Zero Faults 281519 Global Valid Faults 378701 Paged Pool: Modified Faults 236189 Total Failures 0 Read Faults 0 Failed Pages Accumulator 0 Execute Faults 28647 Total Alloc Requests 10229 Failed Alloc Requests 0 Direct I/O 591365 Cur Mapped Gbl Sections 653 Buffered I/O 589652 Max Mapped Gbl Sections 654 Split I/O 213 Cur Mapped Gbl Pages 12193 Hits 83523 Max Mapped Gbl Pages 12196 Logical Name Transl 1805476 Maximum Processes 46 Dead Page Table Scans 0 Sched Zero Pages Created 0 Distributed Lock Manager: Local Incoming Outgoing $ENQ New Lock Requests 674059 0 0 $ENQ Conversion Requests 497982 0 0 $DEQ Dequeue Requests 671626 0 0 Blocking ASTs 26 0 0 Directory Functions 0 0 Deadlock Messages 0 0 $ENQ Requests that Wait 822 Deadlock Searches Performed 0 $ENQ Requests not Queued 3 Deadlocks Found 0 MSCP Statistics: Total IOs 0 Count of VC Failures 0 Split IOs 0 Count of Hosts Served 0 IOs that had to Wait (Buf) 0 Count of Disks Served 10 Requests in MemWait Queue 0 MSCP_BUFFER (SYSGEN) 128 Max Req ever in MemWait 0 MSCP_CREDITS (SYSGEN) 8 File System Cache: Current SYSGEN Param Hits Misses Hitrate File Header Cache (ACP_HDRCACHE = 726) 196207 1214 99.3% Storage Bitmap Cache (ACP_MAPCACHE = 181) 38 9 80.8% Directory Data Cache (ACP_DIRCACHE = 726) 153415 199 99.8% Directory LRU (ACP_DINDXCACHE= 181) 138543 106 99.9% FID Cache (ACP_FIDCACHE = 64) 119 6 95.2% Extent Cache (ACP_EXTCACHE = 64) 229 9 96.2% Quota Cache (ACP_QUOCACHE = 365) 0 0 0.0% Volume Synch Locks 958 Window Turns 1464 Volume Synch Locks Wait 0 Currently Open Files 630 Dir/File Synch Locks 432071 Total Count of OPENs 52903 Dir/file Synch Locks Wait 746 Total Count of ERASE QIOs 186 Access Locks 151648 Free Space Cache Wait 12608 Global Pagefile Quota 785957 GBLPAGFIL (SYSGEN) Limit 786688The CLUE MEMORY/STATISTIC command displays systemwide performance data such as page fault, I/O, pool, lock manager, MSCP, and file system cache statistics.
5.4.10. CLUE PROCESS
Displays process-related information from the current process context.
Format
CLUE PROCESS [/qualifier[,...]]
Parameters
None.
Qualifiers
- /ALL
Ignored except when specified with /BUFFER. Displays the buffer objects for all processes (that is, all existing buffer objects).
- /BUFFER
Displays the buffer objects for the current process or for all processes if /ALL is specified.
- /LAYOUT
Displays the process P1 virtual address space layout.
- /LOGICAL
Displays the process logical names and equivalence names, if they can be accessed.
- /RECALL
Displays the DCL recall buffer, if it can be accessed.
Description
The CLUE PROCESS command displays process-related information from the current process context. Much of this information is in pageable address space and thus may not be present in a dump file.
Examples
SDA> CLUE PROCESS/LOGICAL Process Logical Names: ---------------------- "SYS$OUTPUT" = "_CLAWS$LTA5004:" "SYS$OUTPUT" = "_CLAWS$LTA5004:" "SYS$DISK" = "WORK1:" "BACKUP_FILE" = "_$65$DUA6" "SYS$PUTMSG" = "...À...À.." "SYS$COMMAND" = "_CLAWS$LTA5004:" "TAPE_LOGICAL_NAME" = "_$1$MUA3:" "TT" = "LTA5004:" "SYS$INPUT" = "_$65$DUA6:" "SYS$INPUT" = "_CLAWS$LTA5004:" "SYS$ERROR" = "21C00303.LOG" "SYS$ERROR" = "_CLAWS$LTA5004:" "ERROR_FILE" = "_$65$DUA6"
The CLUE PROCESS/LOGICAL command displays logical names for each running process.
SDA> CLUE PROCESS/RECALL Process DCL Recall Buffer: -------------------------- Index Command 1 ana/sys 2 @login 3 mc sysman io auto /log 4 show device d 5 sea <.x>*.lis clue$ 6 tpu <.x>*0914.lis 7 sh log *hsj* 8 xd <.x>.lis 9 mc ess$ladcp show serv 10 tpu clue_cmd.cld 11 ana/sys
The CLUE PROCESS/RECALL command displays a listing of the DCL commands that have been executed most recently.
5.4.11. CLUE REGISTER
Displays the active register set for the crash CPU. The CLUE REGISTER command is valid only when analyzing crash dumps.
Format
CLUE REGISTER [/CPU [cpu-id|ALL]
|/PROCESS
[/ADDRESS=n|INDEX=n
|/IDENTIFICATION=n|process-name|ALL]]
Parameters
- ALL
When used with /CPU, it requests information about all CPUs in the system. When used with /PROCESS, it requests information about all processes that exist in the system.
- cpu-id
When used with /CPU, it gives the number of the CPU for which information is to be displayed. Use of the cpu-id parameter causes the CLUE REGISTER command to perform an implicit SET CPU command, making the indicated CPU the current CPU for subsequent SDA commands.
- progress-name
When used with /PROCESS, it gives the name of the process for which information is to be displayed. Use of the process-name parameter, the /ADDRESS qualifier, the /INDEX qualifier, or the /IDENTIFICATION qualifier causes the CLUE REGISTER command to perform an implicit SET PROCESS command, making the indicated process the current process for subsequent SDA commands. You can determine the names of the processes in the system by issuing a SHOW SUMMARY command.
The process-name can contain up to 15 letters and numerals, including the underscore (_) and dollar sign ($). If it contains any other characters, you must enclose the process-name in quotation marks (" ").
Qualifiers
- /ADDRESS=n
Specifies the PCB address of the desired process when used with CLUE REGISTER/PROCESS.
- /CPU [cpu-id|ALL]
Indicates that the registers for a CPU are required. Specify the CPU by its number or use ALL to indicate all CPUs.
- /IDENTIFICATION=n
Specifies the identification of the desired process when used with CLUE REGISTER/PROCESS.
- /INDEX=n
Specifies the index of the desired process when used with CLUE REGISTER/PROCESS.
- /PROCESS [process-name|ALL]
Indicates that the registers for a process are required. The process should be specified with either one of the qualifiers /ADDRESS, /IDENTIFICATION, or /INDEX, or by its name, or by using ALL to indicate all processes.
Description
The CLUE REGISTER command displays the active register set of the crash CPU. It also identifies any known data structures, symbolizes any system virtual addresses, interprets the processor status (PS), and attempts to interpret R0 as a condition code.
If neither /CPU nor /PROCESS is specified, the parameter (cpu-id or process-name) is ignored and the registers for the SDA current process are displayed.
Examples
SDA> CLUE REGISTER Current Registers: Process index: 0042 Process name: BATCH_3 PCB: 817660C0 (CPU 1) ------------------------------------------------------------- R0 = 00000000.00000000 R1 = FFFFFFFF.814A2C80 MP_CPU (CPU Id 1) R2 = 00000000.00000000 R3 = 00000000.23D6BBEE R4 = 00000000.00000064 R5 = FFFFFFFF.831F8000 PHD R6 = 00000000.12F75475 R7 = 00000000.010C7A70 R8 = 00000000.00000001 R9 = 00000000.00000000 R10 = 00000000.00000000 R11 = FFFFFFFF.814A2C80 MP_CPU (CPU Id 1) R12 = FFFFFFFF.810AA5E0 SYSTEM_SYNCHRONIZATION+293E0 R13 = FFFFFFFF.810AC408 SMP$TIMEOUT R14 = FFFFFFFF.810AED00 SMP$GL_SCHED R15 = 00000000.7FFA1DD8 R16 = 00000000.0000078C R17 = 00000000.00000000 R18 = FFFFFFFF.810356C0 SYS$CPU_ROUTINES_2208+1D6C0 R19 = FFFFFFFF.81006000 EXE$GR_SYSTEM_DATA_CELLS R20 = FFFFFFFF.80120F00 SCH$QEND_C+00080 R21 = 00000000.00000000 R22 = FFFFFFFF.00000000 R23 = 00000000.00000000 R24 = 00000000.00000000 AI = FFFFFFFF.81006000 EXE$GR_SYSTEM_DATA_CELLS RA = 00000000.00000000 PV = 00000000.00000000 R28 = FFFFFFFF.810194A0 EXE$GL_TIME_CONTROL FP = 00000000.7FFA1F90 PC = FFFFFFFF.800863A8 SMP$TIMEOUT_C+00068 PS = 18000000.00000804 Kernel Mode, IPL 8, Interrupt
5.4.12. CLUE SCSI
Displays information related to SCSI and Fibre Channel.
Format
CLUE SCSI {/CONNECTION=n
|/PORT=n|/REQUEST=n|/SUMMARY}
Qualifiers
- /CONNECTION=scdt-address
Displays information about SCSI connections and decodes the SCSI connection descriptor data structure identified by the SCDT address.
- /PORT=spdt-address
Displays all or a specific port descriptor identified by its SPDT address.
- /REQUEST=scdrp-address
Displays information about SCSI requests and decodes the SCSI class driver request packet identified by the SCDRP address.
- /SUMMARY
Displays a summary of all SCSI and FC ports and devices and their type and revisions.
Description
The CLUE SCSI command displays information about SCSI and Fibre Channel.
Examples
SDA> CLUE SCSI/SUMMARY SCSI Summary Configuration: --------------------------- SPDT Port STDT SCSI-Id SCDT SCSI-Lun Device UCB Type Rev -------------- -------------- -------------- -------- -------- ------ --- 854EB840 PKB0 8549B000 PKA0 8549D880 0 8549DA80 0 DKA0 854C2B00 36.4G HPC5 85250040 FGB0 8549CC80 1 8549D500 0 GGA41 8569EDC0 MSA100 85537A40 2 DGA10 85537C00 MSA100 4.48 85538F00 3 DGA20 855390C0 MSA100 4.48 8553A040 4 DGA30 8553A200 MSA100 4.48 8553B340 6 DGA31 8553B500 MSA100 4.48 8553C480 7 DGA21 8553C640 MSA100 4.48 8553D140 11 DGA50 8553D300 MSA100 4.48 8553DE00 12 DGA51 8553DFC0 MSA100 4.48 8553EF40 21 DGA40 8553F100 MSA100 4.48 851BED80 FGA0 851BBE00 1 851BFA80 0 GGA40 8569E780 MSA100 851C2040 7 DGA21 851A9740 MSA100 4.48 85512840 2 DGA10 85512CC0 MSA100 4.48 85513380 3 DGA20 85513540 MSA100 4.48 85513D80 4 DGA30 85529EC0 MSA100 4.48 8552CA40 6 DGA31 8552CC00 MSA100 4.48 8552F640 11 DGA50 8552F800 MSA100 4.48 85532240 12 DGA51 85532400 MSA100 4.48 85534E40 21 DGA40 85535000 MSA100 4.48This example shows a full summary report, which includes all SCSI and FC ports and devices and their type and revisions.
SDA> CLUE SCSI/PORT=851BED80 SCSI Port Descriptor (SPDT): ---------------------------- FGA0: Driver SYS$PGQDRIVER SPDT Address 851BED80 Port Type QLogic ISP23xx FibreChannel ADP Address 85189E00 Adapter PCI UCB Address 8519B4C0 Device 00000000.00000000 () Busarray Address 8518A180 Port Host SCSI Id 0 Port Flags mapping_reg,dir_dma,luns,cmdq,port_autosense,smart_port Port Device Status online Port Dev Status at DIPL stdt_scdt Target inited Bus Resets 0 Number of Events 0 Retry Attempts 0 Curr I/Os on all Ports 0 Stray Interrupts 0 Curr I/Os on all Devices 0 Unexpected Interrupts 0 Total Outstanding I/Os 0 Reselections 0 CRAB Address 8515DD00 Port Wait Queue empty Port CRAM Address 00000000 Nonpg Pool FKB Que empty Port IDB Address 85151340 Bus Reset Waiters empty
This example shows a report for the PORT with SPDT address 851BED80.
SDA> CLUE SCSI/CONNECTION=85512840 SCSI Connection Descriptor (SCDT): ---------------------------------- SCDT Connection Descriptor 85512840 Device DGA10 STDT Target Descriptor 851BBE00 Type MSA1000 VOLUME SPDT Port Descriptor 851BED80 Revision 4.48 Port UCB Address 8519B4C0 Target SCSI Id 1 Device UCB Address 85512CC0 Device SCSI Lun 512 Connection State open Capability Mask scsi_2,cmdq Connection Flags ena_discon Queue Flags - DIPL Queue Flags - Total Outstanding I/Os 0 Number of Commands sent 0 Outstanding Port I/Os 0 Number of Messages sent 0 Outstanding Device I/Os 0 Number of Bytes sent 0 Arbitration Failures 0 Parity Errors 0 Selection Failures 0 Missing Phase Errors 0 Count of Controller Errors 0 Bad Phase Errors 0 Count of Bus Errors 0 Count of Retries 0
This report includes information about SCSI connections and decodes the SCSI connection descriptor data structure identified by the SCDT address 85512840.
5.4.13. CLUE SG
Displays the scatter-gather map.
Format
CLUE SG [/CRAB=address]
Parameters
None.
Qualifiers
- /CRAB=address
Displays the ringbuffer for the specified Counted Resource Allocation Block (CRAB). The default action is to display the ringbuffer for all CRABs.
Description
CLUE SG decodes and displays the scatter/gather ringbuffer entries.
Examples
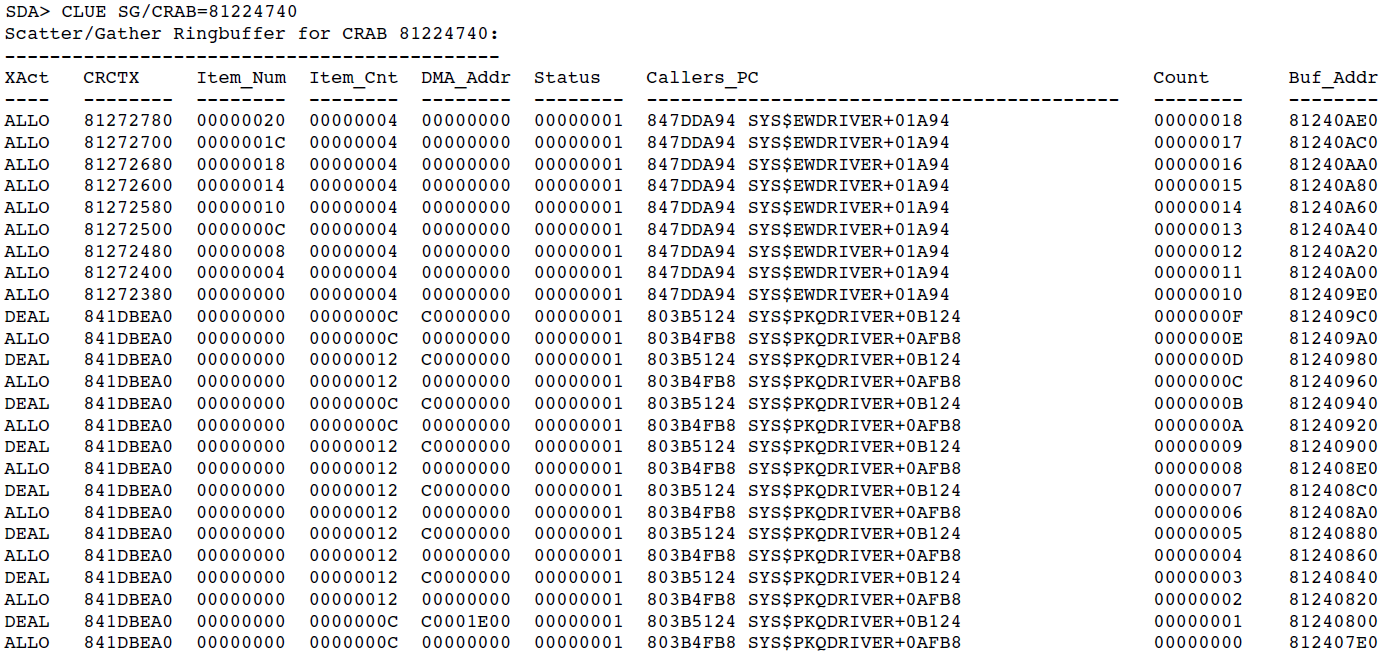
In this example, the scatter-gather ring buffer for the CRAB at address 81224740 is displayed.

In this example, the scatter-gather ring buffer for the CRAB address 8120D600 is displayed.
5.4.14. CLUE STACK
On Alpha, CLUE STACK identifies and displays the current stack. On IA-64, CLUE STACK only identifies the current stack without displaying it. Use the SDA command SHOW STACK on both Alpha and IA-64 to display and decode the whole stack for the more common bugcheck types.
Format
CLUE STACK
Parameters
None.
Qualifiers
None.
Description
The CLUE STACK command identifies and displays the current stack together with the upper and lower stack limits. In case of a FATALEXCPT, INVEXCEPTN, SSRVEXCEPT, UNXSIGNAL, or PGFIPLHI bugcheck, CLUE STACK tries to decode the whole stack.
Examples
SDA> CLUE STACK
Stack Decoder:
--------------
Normal Process Kernel Stack:
Stack Pointer 00000000.7FFA1C98
Stack Limits (low) 00000000.7FFA0000
(high) 00000000.7FFA2000
SSRVEXCEPT Stack:
-----------------
Stack Pointer SP => 00000000.7FFA1C98
Information saved by Bugcheck:
a(Signal Array) 00000000.7FFA1C98 00000000.00000000
EXE$EXCPTN[E] Temporary Storage:
EXE$EXCPTN[E] Stack Frame:
PV 00000000.7FFA1CA0 FFFFFFFF.829CF010 EXE$EXCPTN
Entry Point FFFFFFFF.82A21000 EXE$EXCPTN_C
return PC 00000000.7FFA1CA8 FFFFFFFF.82A2059C SYS$CALL_HANDL_C+0002C
saved R2 00000000.7FFA1CB0 00000000.00000000
saved FP 00000000.7FFA1CB8 00000000.7FFA1CD0
SYS$CALL_HANDL Temporary Storage:
00000000.7FFA1CC0 FFFFFFFF.829CEDA8 SYS$CALL_HANDL
00000000.7FFA1CC8 00000000.00000000
SYS$CALL_HANDL Stack Frame:
PV 00000000.7FFA1CD0 FFFFFFFF.829CEDA8 SYS$CALL_HANDL
Entry Point FFFFFFFF.82A20570 SYS$CALL_HANDL_C
00000000.7FFA1CD8 00000000.00000000
return PC 00000000.7FFA1CE0 FFFFFFFF.82A1E930 CHF_REI+000DC
saved FP 00000000.7FFA1CE8 00000000.7FFA1F40
Fixed Exception Context Area:
Linkage Pointer 00000000.7FFA1CF0 FFFFFFFF.80C63780 EXCEPTION_MON_NPRW+06D80
a(Signal Array) 00000000.7FFA1CF8 00000000.7FFA1EB8
a(Mechanism Array) 00000000.7FFA1D00 00000000.7FFA1D40
a(Exception Frame) 00000000.7FFA1D08 00000000.7FFA1F00
Exception FP 00000000.7FFA1D10 00000000.7FFA1F40
Unwind SP 00000000.7FFA1D18 00000000.00000000
Reinvokable FP 00000000.7FFA1D20 00000000.00000000
Unwind Target 00000000.7FFA1D28 00000000.00020000 SYS$K_VERSION_04
#Sig Args/Byte Cnt 00000000.7FFA1D30 00000005.00000250 BUG$_NETRCVPKT
a(Msg)/Final Status 00000000.7FFA1D38 829CE050.000008F8 BUG$_SEQ_NUM_OVF
Mechanism Array:
Flags/Arguments 00000000.7FFA1D40 00000000.0000002C
a(Establisher FP) 00000000.7FFA1D48 00000000.7AFFBAD0
reserved/Depth 00000000.7FFA1D50 FFFFFFFF.FFFFFFFD
a(Handler Data) 00000000.7FFA1D58 00000000.00000000
a(Exception Frame) 00000000.7FFA1D60 00000000.7FFA1F00
a(Signal Array) 00000000.7FFA1D68 00000000.7FFA1EB8
saved R0 00000000.7FFA1D70 00000000.00020000 SYS$K_VERSION_04
saved R1 00000000.7FFA1D78 00000000.00000000
saved R16 00000000.7FFA1D80 00000000.00020004 UCB$M_NI_PRM_MLT+00004
saved R17 00000000.7FFA1D88 00000000.00010050 SYS$K_VERSION_16+00010
saved R18 00000000.7FFA1D90 FFFFFFFF.FFFFFFFF
saved R19 00000000.7FFA1D98 00000000.00000000
saved R20 00000000.7FFA1DA0 00000000.7FFA1F50
saved R21 00000000.7FFA1DA8 00000000.00000000
saved R22 00000000.7FFA1DB0 00000000.00010050 SYS$K_VERSION_16+00010
saved R23 00000000.7FFA1DB8 00000000.00000000
saved R24 00000000.7FFA1DC0 00000000.00010051 SYS$K_VERSION_16+00011
saved R25 00000000.7FFA1DC8 00000000.00000000
saved R26 00000000.7FFA1DD0 FFFFFFFF.8010ACA4 AMAC$EMUL_CALL_NATIVE_C+000A4
saved R27 00000000.7FFA1DD8 00000000.00010050 SYS$K_VERSION_16+00010
saved R28 00000000.7FFA1DE0 00000000.00000000
FP Regs not valid [...............]
a(Signal64 Array) 00000000.7FFA1EA0 00000000.7FFA1ED0
SP Align = 10(hex) [...............]
Signal Array:
Arguments 00000000.7FFA1EB8 00000005
Condition 00000000.7FFA1EBC 0000000C
Argument #2 00000000.7FFA1EC0 00010000 LDRIMG$M_NPAGED_LOAD
Argument #3 00000000.7FFA1EC4 00000000
Argument #4 00000000.7FFA1EC8 00030078 SYS$K_VERSION_01+00078
Argument #5 00000000.7FFA1ECC 00000003
64-bit Signal Array:
Arguments 00000000.7FFA1ED0 00002604.00000005
Condition 00000000.7FFA1ED8 00000000.0000000C
Argument #2 00000000.7FFA1EE0 00000000.00010000 LDRIMG$M_NPAGED_LOAD
Argument #3 00000000.7FFA1EE8 00000000.00000000
Argument #4 00000000.7FFA1EF0 00000000.00030078 SYS$K_VERSION_01+00078
Argument #5 00000000.7FFA1EF8 00000000.00000003
Interrupt/Exception Frame:
saved R2 00000000.7FFA1F00 00000000.00000003
saved R3 00000000.7FFA1F08 FFFFFFFF.80C63460 EXCEPTION_MON_NPRW+06A60
saved R4 00000000.7FFA1F10 FFFFFFFF.80D12740 PCB
saved R5 00000000.7FFA1F18 00000000.000000C8
saved R6 00000000.7FFA1F20 00000000.00030038 SYS$K_VERSION_01+00038
saved R7 00000000.7FFA1F28 00000000.7FFA1FC0
saved PC 00000000.7FFA1F30 00000000.00030078 SYS$K_VERSION_01+00078
saved PS 00000000.7FFA1F38 00000000.00000003 IPL INT CURR PREV
SP Align = 00(hex) [...............] 00 0 Kern User
Stack Frame:
PV 00000000.7FFA1F40 00000000.00010050 SYS$K_VERSION_16+00010
Entry Point 00000000.00030060 SYS$K_VERSION_01+00060
00000000.7FFA1F48 00000000.00010000 LDRIMG$M_NPAGED_LOAD
return PC 00000000.7FFA1F50 FFFFFFFF.8010ACA4 AMAC$EMUL_CALL_NATIVE_C+000A4
saved FP 00000000.7FFA1F58 00000000.7FFA1F70
Stack (not decoded):
00000000.7FFA1F60 00000000.00000001
00000000.7FFA1F68 FFFFFFFF.800EE81C RM_STD$DIRCACHE_BLKAST_C+005AC
Stack Frame:
PV 00000000.7FFA1F70 FFFFFFFF.80C6EBA0 EXE$CMKRNL
Entry Point FFFFFFFF.800EE6C0 EXE$CMKRNL_C
00000000.7FFA1F78 00000000.829CEDE8 EXE$SIGTORET
00000000.7FFA1F80 00010050.00000002
00000000.7FFA1F88 00000000.00020000 SYS$K_VERSION_04
00000000.7FFA1F90 00000000.00030000 SYS$K_VERSION_01
return PC 00000000.7FFA1F98 FFFFFFFF.800A4D64 __RELEASE_LDBL_EXEC_SERVICE+00284
saved R2 00000000.7FFA1FA0 00000000.00000003
saved R4 00000000.7FFA1FA8 FFFFFFFF.80D12740 PCB
saved R13 00000000.7FFA1FB0 00000000.00010000 LDRIMG$M_NPAGED_LOAD
saved FP 00000000.7FFA1FB8 00000000.7AFFBAD0
Interrupt/Exception Frame:
saved R2 00000000.7FFA1FC0 00000000.7FFCF880 MMG$IMGHDRBUF+00080
saved R3 00000000.7FFA1FC8 00000000.7B0E9851
saved R4 00000000.7FFA1FD0 00000000.7FFCF818 MMG$IMGHDRBUF+00018
saved R5 00000000.7FFA1FD8 00000000.7FFCF938 MMG$IMGHDRBUF+00138
saved R6 00000000.7FFA1FE0 00000000.7FFAC9F0
saved R7 00000000.7FFA1FE8 00000000.7FFAC9F0
saved PC 00000000.7FFA1FF0 FFFFFFFF.80000140 SYS$CLREF_C
saved PS 00000000.7FFA1FF8 00000000.0000001B IPL INT CURR PREV
SP Align = 00(hex) [...............] 00 0 User User
CLUE STACK identifies and displays the current stack and its upper and lower limit. It then decodes the current stack if it is one of the more common bugcheck types. In this case, CLUE STACK tries to decode the entire INVEXCEPTN stack.
5.4.15. CLUE SYSTEM
Displays the contents of the shared logical name tables in the system.
Format
CLUE SYSTEM /LOGICAL
Parameters
None.
Qualifiers
- /LOGICAL
Displays all the shared logical names.
Description
The CLUE SYSTEM/LOGICAL command displays the contents of the shared logical name tables in the system.
Examples
SDA> CLUE SYSTEM/LOGICAL Shareable Logical Names: ------------------------ "XMICONBMSEARCHPATH" = "CDE$HOME_DEFAULTS:[ICONS]%B%M.BM" "MTHRTL_TV" = "MTHRTL_D53_TV" "SMGSHR_TV" = "SMGSHR" "DECW$DEFAULT_KEYBOARD_MAP" = "NORTH_AMERICAN_LK401AA" "CONVSHR_TV" = "CONVSHR" "XDPS$INCLUDE" = "SYS$SYSROOT:[XDPS$INCLUDE]" "DECW$SYSTEM_DEFAULTS" = "SYS$SYSROOT:[DECW$DEFAULTS.USER]" "SYS$PS_FONT_METRICS" = "SYS$SYSROOT:[SYSFONT.PS_FONT_METRICS.USER]" "SYS$TIMEZONE_NAME" = "???" "STARTUP$STARTUP_VMS" = "SYS$STARTUP:VMS$VMS.DAT" "PASMSG" = "PAS$MSG" "UCX$HOST" = "SYS$COMMON:[SYSEXE]UCX$HOST.DAT;1" "SYS$SYLOGIN" = "SYS$MANAGER:SYLOGIN" "DNS$SYSTEM" = "DNS$SYSTEM_TABLE" "IPC$ACP_ERRMBX" = "d.Ú." "CDE$DETACHED_LOGICALS" = "DECW$DISPLAY,LANG" "DECW$SERVER_SCREENS" = "GXA0" "DNS$_COTOAD_MBX" = "ä<â." "DNS$LOGICAL" = "DNS$SYSTEM" "OSIT$MAILBOX" = "äAë." "XNL$SHR_TV" = "XNL$SHR_TV_SUPPORT.EXE" "MOM$SYSTEM" = "SYS$SYSROOT:[MOM$SYSTEM]" "MOP$LOAD" = "SYS$SYSROOT:<MOM$SYSTEM>" . . .
5.4.16. CLUE VCC
Displays virtual I/O cache-related information. If extended file cache (XFC) is enabled, the CLUE VCC command is disabled.
Format
CLUE VCC [/qualifier[,...]]
Parameters
None.
Qualifiers
- /CACHE
Decodes and displays the cache lines that are used to correlate the file virtual block numbers (VBNs) with the memory used for caching. Note that the cache itself is not dumped in a selective dump. Use of this qualifier with a selective dump produces the following message:
%CLUE-I-VCCNOCAC, Cache space not dumped because DUMPSTYLE is selective
- /LIMBO
Walks through the limbo queue (LRU order) and displays information for the cached file header control blocks (FCBs).
- /STATISTIC
Displays statistical and performance information related to the virtual I/O cache.
- /VOLUME
Decodes and displays the cache volume control blocks (CVCB).
Examples
SDA> CLUE VCC/STATISTIC Virtual I/O Cache Statistics: ----------------------------- Cache State pak,on,img,data,enabled Cache Flags on,protocol_only Cache Data Area 80855200 Total Size (pages) 400 Total Size (MBytes) 3.1 MB Free Size (pages) 0 Free Size (MBytes) 0.0 MB Read I/O Count 34243 Read I/O Bypassing Cache 3149 Read Hit Count 15910 Read Hit Rate 46.4% Write I/O Count 4040 Write I/O Bypassing Cache 856 IOpost PID Action Rtns 40829 IOpost Physical I/O Count 28 IOpost Virtual I/O Count 0 IOpost Logical I/O Count 7 Read I/O past File HWM 124 Cache Id Mismatches 44 Count of Cache Block Hits 170 Files Retained 100 Cache Line LRU 82B11220 82B11620 Oldest Cache Line Time 00001B6E Limbo LRU Queue 80A97E3C 80A98B3C Oldest Limbo Queue Time 00001B6F Cache VCB Queue 8094DE80 809AA000 System Uptime (seconds) 00001BB0
SDA> CLUE VCC/VOLUME Virtual I/O Cache - Cache VCB Queue: ------------------------------------ CacheVCB RealVCB LockID IRP Queue CID LKSB Ocnt State -------- -------- -------- ----------------- ---- ---- ---- --------------- 8094DE80 80A7E440 020007B2 8094DEBC 8094DEBC 0000 0001 0002 on 809F3FC0 809F97C0 0100022D 809F3FFC 809F3FFC 0000 0001 0002 on 809D0240 809F7A40 01000227 809D027C 809D027C 0000 0001 0002 on 80978B80 809F6C00 01000221 80978BBC 80978BBC 0000 0001 0002 on 809AA000 809A9780 01000005 809AA83C 809AA03C 0007 0001 0002 on
SDA> CLUE VCC/LIMBO Virtual I/O Cache - Limbo Queue: -------------------------------- CFCB CVCB FCB CFCB IOerrors FID (hex) -------- -------- -------- -Status- -------- -------------- 80A97DC0 809AA000 80A45100 00000200 00000000 (076B,0001,00) 80A4E440 809AA000 809CD040 00000200 00000000 (0767,0001,00) 80A63640 809AA000 809FAE80 00000200 00000000 (0138,0001,00) 80AA2540 80978B80 80A48140 00000200 00000000 (0AA5,0014,00) 80A45600 809AA000 80A3AC00 00000200 00000000 (0C50,0001,00) 80A085C0 809AA000 809FA140 00000200 00000000 (0C51,0001,00) 80A69800 809AA000 809FBA00 00000200 00000000 (0C52,0001,00) 80951000 809AA000 80A3F140 00000200 00000000 (0C53,0001,00) 80A3E580 809AA000 80A11A40 00000200 00000000 (0C54,0001,00) 80A67F80 809AA000 80978F00 00000200 00000000 (0C55,0001,00) 809D30C0 809AA000 809F4CC0 00000200 00000000 (0C56,0001,00) 809D4B80 809AA000 8093E540 00000200 00000000 (0C57,0001,00) [......] 80A81600 809AA000 8094B2C0 00000200 00000000 (0C5D,0001,00) 80AA3FC0 809AA000 80A2DEC0 00000200 00000000 (07EA,000A,00) 80A98AC0 809AA000 8093C640 00000200 00000000 (0C63,0001,00)
SDA> CLUE VCC/CACHE Virtual I/O Cache - Cache Lines: -------------------------------- CL VA CVCB CFCB FCB CFCB IOerrors FID (hex) -------- -------- -------- -------- -------- -Status- -------- ------------ 82B11200 82880000 809D0240 809D7000 80A01100 00000200 00000000 (006E,0003,00) 82B15740 82AAA000 809AA000 80A07A00 80A24240 00000000 00000000 (0765,0001,00) 82B14EC0 82A66000 809AA000 80A45600 80A3AC00 00000200 00000000 (0C50,0001,00) 82B12640 82922000 809D0240 809D7000 80A01100 00000200 00000000 (006E,0003,00) 82B123C0 8290E000 809AA000 80A45600 80A3AC00 00000200 00000000 (0C50,0001,00) 82B13380 8298C000 809D0240 809D7000 80A01100 00000200 00000000 (006E,0003,00) 82B15A40 82AC2000 809AA000 80A45600 80A3AC00 00000200 00000000 (0C50,0001,00) 82B15F40 82AEA000 809D0240 809D7000 80A01100 00000200 00000000 (006E,0003,00) 82B12AC0 82946000 809D0240 809D7000 80A01100 00000200 00000000 (006E,0003,00) 82B12900 82938000 809D0240 809D7000 80A01100 00000200 00000000 (006E,0003,00) 82B10280 82804000 809AA000 80A45600 80A3AC00 00000200 00000000 (0C50,0001,00) 82B122C0 82906000 809AA000 80A1AC00 80A48000 00000000 00000000 (0164,0001,00) 82B14700 82A28000 809AA000 809FFEC0 809F8DC0 00000004 00000000 (07B8,0001,00) 82B11400 82890000 809AA000 80A113C0 80A11840 00000000 00000000 (00AF,0001,00) [......] 82B11380 8288C000 809AA000 809DA0C0 809C99C0 00002000 00000000 (00AB,0001,00) 82B130C0 82976000 809AA000 809DA0C0 809C99C0 00002000 00000000 (00AB,0001,00) 82B11600 828A0000 809AA000 809DA0C0 809C99C0 00002000 00000000 (00AB,0001,00)
5.4.17. CLUE XQP
Displays XQP-related information.
Format
CLUE XQP [/qualifier[,...]]
Parameters
None.
Qualifiers
- /ACTIVE
Displays all active XQP processes. (See also /FULL.)
- /AQB
Displays any current I/O request packets (IRPs) waiting at the interlocked queue.
- /BFRD=index
Displays the buffer descriptor (BFRD) referenced by the index specified. The index is identical to the hash value.
- /BFRL=index
Displays the buffer lock block descriptor (BFRL) referenced by the index specified. The index is identical to the hash value.
- /BUFFER=(n,m)
Displays the BFRDs for a given pool. Specify either 0, 1, 2 or 3, or a combination of these in the parameter list. (See also /FULL.)
- /CACHE_HEADER
Displays the block buffer cache header.
- /FCB=address
Displays all file header control blocks (FCBs) with a nonzero DIRINDX for a given volume. If no address is specified, the current volume of the current process is used. (See also /FULL.)
The address specified can also be either a valid volume control block (VCB), unit control block (UCB), or window control block (WCB) address.
- /FILE=address
Decodes and displays file header (FCB), window (WCB), and cache information for a given file. The file can be identified by either its FCB or WCB address.
- /FULL
Ignored except when used with certain other qualifiers. When used with /ACTIVE, CLUE displays additional data on the XQP's caller (for Alpha only). When used with /BUFFER or /VALIDATE, CLUE displays additional data on each buffer descriptor. When used with /FCB, CLUE displays all FCBs, including any that are unused.
- /GLOBAL
Displays the global XQP area for a given process.
- /LBN_HASH=lbn
Calculates and displays the hash value for a given logical block number (LBN).
- /LIMBO
Searches through the limbo queue and displays FCB information from available, but unused file headers.
- /LOCK=lockbasis
Displays all file system serialization, arbitration, and cache locks found for the specified lockbasis.
- /THREAD=n
Displays the XQP thread area for a given process. The specified thread number is checked for validity. If no thread number is specified, the current thread is displayed. If no current thread, but only one single thread is in use, then that thread is displayed. If more than one thread exists or an invalid thread number is specified, then a list of currently used threads is displayed.
- /VALIDATE=(n,m)
Performs certain validation checks on the block buffer cache to detect corruption. Specify 1, 2, 3, 4, or a combination of these in the parameter list. If an inconsistency is found, a minimal error message is displayed. (See also /FULL.)
Description
The CLUE XQP command displays XQP information. XQP is part of the I/O subsystem.
Examples
SDA> CLUE XQP/CACHE_HEADER Block Buffer Cache Header: -------------------------- Cache_Header 8437DF90 BFRcnt 000005D2 FreeBFRL 843916A0 Bufbase 8439B400 BFRDbase 8437E080 BFRLbase 8438F7E0 Bufsize 000BA400 LBNhashtbl 84398390 BFRLhashtbl 84399BC8 Realsize 000D78A0 LBNhashcnt 0000060E BFRLhashcnt 0000060E Pool #0 #1 #2 #3 Pool_LRU 8437E5C0 84385F40 84387E90 8438EEB0 8437F400 84385D60 8438AC80 8438EE20 Pool_WAITQ 8437DFE0 8437DFE8 8437DFF0 8437DFF8 8437DFE0 8437DFE8 8437DFF0 8437DFF8 Waitcnt 00000000 00000000 00000000 00000000 Poolavail 00000094 00000252 00000251 00000094 Poolcnt 00000095 00000254 00000254 00000095 AmbigQFL 00000000 Process_Hits 00000000 Cache_Serial 00000000 AmbigQBL 00000000 Valid_Hits 00000000 Cache_Stalls 00000000 Disk_Reads 00000000 Invalid_Hits 00000000 Buffer_Stalls 00000000 Disk_Writes 00000000 Misses 00000000The SDA command CLUE XQP/CACHE_HEADER displays the block buffer cache header.
SDA> CLUE XQP/VALIDATE=(1,4) Searching BFRD Array for possible Corruption... Searching Lock Basis Hashtable for possible Corruption...
In this example, executing the CLUE XQP/VALIDATE=(1,4) command indicated that no corruption was detected in either the BFRD Array or the Lock Basis Hashtable.
Chapter 6. SDA FLT Extension
The Alignment Fault Utility (FLT) finds alignment faults and records them in a ring buffer, which can be sized when starting alignment fault tracing. The summary screen displays the results sorted by the program counter (PC) that has incurred the most alignment faults. The detailed trace output also shows the process identification (PID) of the process that caused the alignment fault, with the virtual address that triggered the fault.
Output can be directed to a file using the SDA SET OUTPUT command.
FLT can be started and stopped as required without the need for a system reboot.
6.1. FLT Commands
The table below summarizes the commands for the FLT utility.
| Commands | Description |
|---|---|
| FLT LOAD | Loads the FLT$DEBUG execlet. |
| FLT UNLOAD | Unloads the FLT$DEBUG execlet. |
| FLT START TRACE | Starts alignment fault tracing. |
| FLT | Lists the FLT commands. |
| FLT STOP TRACE | Stops tracing. |
| FLT SHOW TRACE | Displays detailed information about the trace. |
The end of this chapter has an example of how you might use these FLT commands.
6.1.1. FLT
When entered with no keywords, lists the FLT commands.
Format
FLT
Parameters
None.
Qualifiers
None.
6.1.2. FLT LOAD
Loads the FLT$DEBUG execlet. Do this before starting alignment fault tracing.
Format
FLT LOAD
Parameters
None.
Qualifiers
None.
6.1.3. FLT SHOW TRACE
Displays detail about the trace.
Format
FLT SHOW TRACE [/SUMMARY [/RATES (d) | /TOTALS]]
Parameters
None.
Qualifiers
- /RATES
When used with /SUMMARY, the alignment fault rate per second for each PC during the collection interval is displayed. This is the default.
- /SUMMARY
Displays the results sorted by the program counter (PC) that has incurred the most alignment faults.
- /TOTALS
When used with /SUMMARY, the total number of alignment faults for each PC during the collection interval is displayed.
6.1.4. FLT START TRACE
Starts alignment fault tracing. By default, all PCs are traced.
Format
START TRACE [/BUFFER=pages] [/BEGIN=pc_range_low]
[/CALLER] [/END=pc_range_high]
[/INDEX=pid] [MODE=(mode,...)]
Parameters
None.
Qualifiers
- /BUFFER=pages
The number of pages to size the trace buffer. The default is 128 pages or 1MB.
- /BEGIN=pc_range_low
Start of range of PCs to trace.
- /CALLER
For each alignment fault, in addition to recording the PC that incurred the fault, FLT also records the PCs of the caller, the callers caller, and so on, for up to 10 call frames.
- /END=pc_range_high
End of range of PCs to trace.
- /INDEX=pid
Only trace alignment faults for the specified process. You can specify the process index itself, or the process identification or extended process identification, from which the process index is extracted.
- /MODE=(mode,...)
Only trace alignment faults that occur in the specified modes. Allowed modes are KERNEL, EXEC, SUPER and USER. If you specify only one mode, you can omit the parentheses.
6.1.5. FLT STOP TRACE
Stops tracing.
Format
FLT STOP TRACE
Parameters
None.
Qualifiers
None.
6.1.6.
Unloads the FLT$DEBUG execlet.
Format
FLT UNLOAD
Parameters
None.
Qualifiers
None.
Example
SDA> flt load SDA> flt start trace . . . SDA> flt show trace /summary Fault Trace Information: (at 12-OCT-2004 16:09:29.43, trace time 00:00:55.145335) --------------------------------------------------------------------------------- Exception PC Count Exception PC Module Offset ----------------- ------------ -------------------------------------- ---------------------------------- FFFFFFFF.86214790 973 RDMSHRP72+0019E790 RDMSHRP72 0019E790 FFFFFFFF.86214791 871 RDMSHRP72+0019E791 RDMSHRP72 0019E791 FFFFFFFF.8620B261 700 RDMSHRP72+00195261 RDMSHRP72 00195261 FFFFFFFF.8620B260 700 RDMSHRP72+00195260 RDMSHRP72 00195260 FFFFFFFF.841C3451 208 LIBRTL+00195451 LIBRTL 00195451 FFFFFFFF.818E43E0 193 NET$TRANSPORT_NSP+303E0 NET$TRANSPORT_NSP 000303E0 FFFFFFFF.818E4400 193 NET$TRANSPORT_NSP+30400 NET$TRANSPORT_NSP 00030400 FFFFFFFF.818E4430 193 NET$TRANSPORT_NSP+30430 NET$TRANSPORT_NSP 00030430 FFFFFFFF.818E4450 193 NET$TRANSPORT_NSP+30450 NET$TRANSPORT_NSP 00030450 FFFFFFFF.818E44B1 193 NET$TRANSPORT_NSP+304B1 NET$TRANSPORT_NSP 000304B1 FFFFFFFF.818E44D0 193 NET$TRANSPORT_NSP+304D0 NET$TRANSPORT_NSP 000304D0 FFFFFFFF.818E6720 186 NET$TRANSPORT_NSP+32720 NET$TRANSPORT_NSP 00032720 FFFFFFFF.818E64C0 179 NET$TRANSPORT_NSP+324C0 NET$TRANSPORT_NSP 000324C0 FFFFFFFF.818E6520 179 NET$TRANSPORT_NSP+32520 NET$TRANSPORT_NSP 00032520 FFFFFFFF.86DE9480 166 RDMSHRP72+00D73480 RDMSHRP72 00D73480 FFFFFFFF.807814A1 162 EXE$SETOPR_C+00841 MESSAGE_ROUTINES 0001D7A1 FFFFFFFF.86DE8C90 146 RDMSHRP72+00D72C90 RDMSHRP72 00D72C90 FFFFFFFF.86DE8EC0 146 RDMSHRP72+00D72EC0 RDMSHRP72 00D72EC0 FFFFFFFF.8701C340 146 RDMSHRP72+00FA6340 RDMSHRP72 00FA6340 FFFFFFFF.862026E1 100 RDMSHRP72+0018C6E1 RDMSHRP72 0018C6E1 FFFFFFFF.86202580 100 RDMSHRP72+0018C580 RDMSHRP72 0018C580 FFFFFFFF.862025B0 100 RDMSHRP72+0018C5B0 RDMSHRP72 0018C5B0 FFFFFFFF.8701B900 83 RDMSHRP72+00FA5900 RDMSHRP72 00FA5900 00000000.000EE990 37 00000000.000EEA51 37 00000000.000EE8D1 37 FFFFFFFF.807359C1 28 LOCKING+253C1 LOCKING 000253C1 FFFFFFFF.807359F1 28 LOCKING+253F1 LOCKING 000253F1 FFFFFFFF.80732EE0 27 LCK$FILL_RSB_CACHE_C+008F0 LOCKING 000228E0 FFFFFFFF.86DE8690 18 RDMSHRP72+00D72690 RDMSHRP72 00D72690 FFFFFFFF.80B388A0 15 SECURITY+461A0 SECURITY 000461A0 FFFFFFFF.80B213F0 13 NSA$SIZE_NSAB_C+00840 SECURITY 0002ECF0 FFFFFFFF.86DFE9E0 12 RDMSHRP72+00D889E0 RDMSHRP72 00D889E0 [...............] SDA> flt show trace Unaligned Data Fault Trace Information: --------------------------------------- Timestamp CPU Unaligned VA Exception PC Access EPID Trace Buffer ---------------------- --- ----------------- -------------------------------------- -------- -------- ----------------- 12-OCT 16:09:56.439499 02 00000000.014A4F8A 86214791 RDMSHRP72+0019E791 Exec 39C004DC FFFFFFFF.74921610 12-OCT 16:09:56.439493 02 00000000.023DFFD4 86214790 RDMSHRP72+0019E790 Exec 39C004DC FFFFFFFF.749215E8 12-OCT 16:09:56.439486 02 00000000.014A4F42 86214790 RDMSHRP72+0019E790 Exec 39C004DC FFFFFFFF.749215C0 12-OCT 16:09:56.439480 02 00000000.014A4F8A 86214790 RDMSHRP72+0019E790 Exec 39C004DC FFFFFFFF.74921598 12-OCT 16:09:56.439254 02 00000000.0154F1DC 807814A1 EXE$SETOPR_C+00841 Exec 39C004DC FFFFFFFF.74921570 12-OCT 16:09:56.431606 02 00000000.014A4F5A 86214791 RDMSHRP72+0019E791 Exec 39C004DC FFFFFFFF.74921548 12-OCT 16:09:56.431601 02 00000000.022DEE44 86214790 RDMSHRP72+0019E790 Exec 39C004DC FFFFFFFF.74921520 12-OCT 16:09:56.431594 02 00000000.014A4F42 86214790 RDMSHRP72+0019E790 Exec 39C004DC FFFFFFFF.749214F8 12-OCT 16:09:56.431588 02 00000000.014A4F5A 86214790 RDMSHRP72+0019E790 Exec 39C004DC FFFFFFFF.749214D0 12-OCT 16:09:56.430255 02 00000000.0155BDDC 807814A1 EXE$SETOPR_C+00841 Exec 39C004DC FFFFFFFF.749214A8 12-OCT 16:09:56.426878 02 00000000.014A4F72 86214791 RDMSHRP72+0019E791 Exec 39C004DC FFFFFFFF.74921480 12-OCT 16:09:56.426872 02 00000000.02394ED4 86214790 RDMSHRP72+0019E790 Exec 39C004DC FFFFFFFF.74921458 12-OCT 16:09:56.426865 02 00000000.014A4F42 86214790 RDMSHRP72+0019E790 Exec 39C004DC FFFFFFFF.74921430 12-OCT 16:09:56.426859 02 00000000.014A4F72 86214790 RDMSHRP72+0019E790 Exec 39C004DC FFFFFFFF.74921408 12-OCT 16:09:56.426583 02 00000000.0154A97C 807814A1 EXE$SETOPR_C+00841 Exec 39C004DC FFFFFFFF.749213E0 12-OCT 16:09:56.421244 02 00000000.014A4F52 86214791 RDMSHRP72+0019E791 Exec 39C004DC FFFFFFFF.749213B8 12-OCT 16:09:56.421238 02 00000000.02296824 86214790 RDMSHRP72+0019E790 Exec 39C004DC FFFFFFFF.74921390 12-OCT 16:09:56.421232 02 00000000.014A4F42 86214790 RDMSHRP72+0019E790 Exec 39C004DC FFFFFFFF.74921368 12-OCT 16:09:56.421226 02 00000000.014A4F52 86214790 RDMSHRP72+0019E790 Exec 39C004DC FFFFFFFF.74921340 12-OCT 16:09:56.420916 02 00000000.0156405C 807814A1 EXE$SETOPR_C+00841 Exec 39C004DC FFFFFFFF.74921318 12-OCT 16:09:56.413932 02 00000000.014A4F52 86214791 RDMSHRP72+0019E791 Exec 39C004DC FFFFFFFF.749212F0 12-OCT 16:09:56.413926 02 00000000.023C10D4 86214790 RDMSHRP72+0019E790 Exec 39C004DC FFFFFFFF.749212C8 12-OCT 16:09:56.413918 02 00000000.014A4F42 86214790 RDMSHRP72+0019E790 Exec 39C004DC FFFFFFFF.749212A0 12-OCT 16:09:56.413913 02 00000000.014A4F52 86214790 RDMSHRP72+0019E790 Exec 39C004DC FFFFFFFF.74921278 12-OCT 16:09:56.413645 02 00000000.01564E9C 807814A1 EXE$SETOPR_C+00841 Exec 39C004DC FFFFFFFF.74921250 12-OCT 16:09:56.403972 02 00000000.014A4F52 86214791 RDMSHRP72+0019E791 Exec 39C004DC FFFFFFFF.74921228 12-OCT 16:09:56.403966 02 00000000.023036C4 86214790 RDMSHRP72+0019E790 Exec 39C004DC FFFFFFFF.74921200 12-OCT 16:09:56.403960 02 00000000.014A4F42 86214790 RDMSHRP72+0019E790 Exec 39C004DC FFFFFFFF.749211D8 12-OCT 16:09:56.403954 02 00000000.014A4F52 86214790 RDMSHRP72+0019E790 Exec 39C004DC FFFFFFFF.749211B0 12-OCT 16:09:56.403689 02 00000000.0155E47C 807814A1 EXE$SETOPR_C+00841 Exec 39C004DC FFFFFFFF.74921188 12-OCT 16:09:56.395575 02 00000000.014A4F8A 86214791 RDMSHRP72+0019E791 Exec 39C004DC FFFFFFFF.74921160 12-OCT 16:09:56.395569 02 00000000.02448D24 86214790 RDMSHRP72+0019E790 Exec 39C004DC FFFFFFFF.74921138 12-OCT 16:09:56.395562 02 00000000.014A4F42 86214790 RDMSHRP72+0019E790 Exec 39C004DC FFFFFFFF.74921110 [....................]
Chapter 7. SDA OCLA Extension (Alpha Only)
The Alpha EV7 On-Chip Logic Analyzer (OCLA) utility collects Program Counter (PC) traces in a portion of the Alpha EV7 cache. This data enables the user to tell which instructions each Alpha EV7 CPU on the system has executed.
7.1. Overview of OCLA
OCLA enables the user to tell which instructions each Alpha EV7 CPU has executed by setting aside one seventh of the Alpha EV7 cache as acquisition memory which stores the virtual addresses of instructions executed by the Alpha EV7 CPU. The acquisition memory in the cache can later be analyzed with an SDA extension.
The acquisition of instructions can be enabled or disabled while the system is running, thereby allowing the acquisition of instruction streams for a given period of time without the need to restart the system.
If the OCLA is enabled and started, and your system subsequently fails due to a crash, the current acquisition memory is automatically saved to the system dump file. The instructions executed by each CPU prior to the system failure can then be analyzed with SDA. Upon restart of the system, the acquisition memory in the EV7 is still there and can be copied into system memory using the OCLA ENABLE and OCLA DUMP commands.
If the STOP/CPU command is issued on a CPU for which OCLA has been enabled, OCLA is automatically disabled if the CPU is allowed to leave the active set. When a CPU is started with the START/CPU command, OCLA is not automatically enabled; rather, it must be enabled using SDA.
Table 7.1, ''SDA Commands for the OCLA Utility'' summarizes the SDA commands and qualifiers for the OCLA utility.
7.2. SDA OCLA Commands
| Commands | Description |
|---|---|
| OCLA ENABLE | Enables the OCLA. The command reserves one seventh of the EV7 cache as acquisition memory for instructions. |
| OCLA DISABLE | Disables the OCLA and returns the cache set to the Alpha EV7 CPU. |
| OCLA DUMP | Copies the acquisition memory in the Alpha EV7 cache to a region in system space for later analysis by SDA. |
| OCLA HELP | Provides online help about OCLA commands. |
| OCLA LOAD | Loads the OCLA$PCTRACE execlet. This must be done prior to enabling any OCLA. |
| OCLA SET REGISTER/RESET | Resets OCLA registers to the default values. |
| OCLA SHOW REGISTER | Displays detailed information about the OCLA registers. |
| OCLA SHOW STATUS | Displays the status of an OCLA. |
| OCLA SHOW TRACE | Decodes the acquired compressed instruction stream and displays it. |
| OCLA START | Starts the acquisition of instructions into the acquisition memory. |
| OCLA STOP | Stops the acquisition of instructions. |
| OCLA UNLOAD | Unloads the OCLA$PCTRACE execlet and returns the acquisition buffers to the system. |
7.2.1. OCLA DISABLE
Disables the OCLA and returns the cache set to the Alpha EV7 CPU.
Format
OCLA DISABLE [/CPU=n]
Parameters
None.
Qualifier
- /CPU=n
Specifies the CPU on which OCLA should be disabled. If this qualifier is omitted, OCLA is disabled on every CPU in the system.
7.2.2. OCLA DUMP
Copies the acquisition memory in the Alpha EV7 cache to a region in system space for later analysis by SDA. When a system fails, data collected in the EV7 cache is automatically saved in the system dump file for each enabled CPU. (See the OCLA SHOW TRACE command for more information.)
Format
OCLA DUMP [/CPU=n]
Parameters
None.
Qualifier
- /CPU=n
Specifies the CPU for which to dump the acquisition memory. If this qualifier is omitted, the acquisition memory is dumped for all CPUs.
7.2.3. OCLA ENABLE
Enables the OCLA. Reserves one-seventh of the EV7 cache as acquisition memory for instructions.
Format
OCLA ENABLE [/CPU=n] [/RESET]
Parameters
None.
Qualifiers
- /CPU=n
Specifies the CPU on which to enable OCLA. If this qualifier is omitted, OCLA is enabled on every CPU in the system.
- /RESET
Initializes the OCLA to default values.
Under certain circumstances, the OCLA might not be initialized properly when the system is powered on. For more information, see the OCLA SHOW REGISTER command.
If you wish to reset only certain registers to default values, use the OCLA SET REGISTER/RESET command.
7.2.4. OCLA HELP
Provides online help on OCLA commands.
Format
OCLA HELP
Parameters
None.
Qualifiers
None.
7.2.5. OCLA LOAD
Loads the OCLA$PCTRACE execlet. This must be done before enabling any OCLA.
Format
OCLA LOAD
Parameters
None.
Qualifiers
None.
7.2.6. OCLA SET REGISTER
Resets a specified OCLA register to its default value. The /RESET qualifier is required for this operation.
Format
OCLA SET REGISTER /RESET keyword
Parameter
- keyword
Specifies which OCLA register to reset to its default value. The valid keywords are as follows:
MISC OCLA 1 miscellaneous register OCLA1_CTL OCLA 1 control register PC_CTL OCLA 1 PC control register SMASK OCLA 1 select mask register SMATCH OCLA 1 select match register TMASK OCLA 1 trigger mask register TMATCH OCLA 1 trigger match register Note
You cannot reset all registers using a single command if OCLA has already been enabled. You must first disable OCLA using the OCLA DISABLE command. You can then reset all the registers by performing an OCLA ENABLE/RESET command.
Qualifier
- /RESET
This qualifier is required to reset the specified register to its default value.
7.2.7. OCLA SHOW REGISTER
Displays detailed information about OCLA registers.
Format
OCLA SHOW REGISTER [/CPU=n]
Parameter
None.
Qualifier
- /CPU=n
Specifies the CPU for which to display registers. If this qualifier is omitted, registers are displayed for all CPUs.
Example
SDA> SHOW REGISTER/CPU=7
OCLA EV7 CPU Registers for CPU: 07
----------------------------------
ZBOX control register for CPU 07: 00000000ffffffff
CBOX control register for CPU 07: 078000001024a807
OCLA 1 MISC register for CPU 07: 0000000000000000
OCLA 1 TMATCH: 40000002ffffffff
OCLA 1 SMATCH: 0000000000000000
OCLA 1 PC_TMATCH: 0000000000000000
OCLA 1 PC_SMATCH: 0000000000000000
OCLA 1 TMASK: 4000000000000000
OCLA 1 SMASK: 0000000000000000
OCLA 1 PC_TMASK: 0000000000000000
OCLA 1 PC_SMASK: 0000000000000000
OCLA 1 control register for CPU 07: 8000210000000000
Enab Run RDRST ITRIG IFULL TAG_EN TS_EN PDAT_EN SFILT TMODE IRQF IRQT TIHANG
1 0 0 0 0 0 0 0 00 00 0 0 0
TAG_SRC EXT_SRC TS_FORCE EIO WRAP SREL AMATCH AADDR
000 004 0 0 1 0 00000 00000
OCLA 1 PC Control register for CPU 07: 000000000000003f
STGSEL TRGSEL OUTSEL CDEPTH CMASK CAMEN
03 03 03 00 00000 0This command displays all OCLA-related registers on the EV7 CPU. This particular CPU was enabled with the /RESET qualifier, so the values have default settings.
7.2.8. OCLA SHOW STATUS
Displays the status of an OCLA.
Format
OCLA SHOW STATUS [/CPU=n]
Parameters
None.
Qualifiers
- /CPU=n
Specifies the CPU for which to show OCLA status. If this qualifier is omitted, status is displayed for all CPUs.
Example
SDA> OCLA SHOW STATUS EV7 OCLA status --------------- CPU 00 is enabled, no entries, no dump done CPU 01 is enabled, no entries, no dump done CPU 02 is enabled, no entries, no dump done CPU 03 is enabled, no entries, no dump done CPU 04 is enabled, no entries, no dump done CPU 05 is enabled, no entries, no dump done CPU 06 is enabled, no entries, no dump done CPU 07 is enabled, running, no entries, no dump done
7.2.9. OCLA SHOW TRACE
Decodes the acquired compressed instruction stream and displays it.
Format
OCLA SHOW TRACE [/CPU=n]
[/LAST=n][/NOPAL][/REVERSE][/SUMMARY][/SYMBOLIZE]
Parameters
None.
Qualifiers
- /CPU=n
Specifies the CPU for which to show data. If this qualifier is omitted, trace data is displayed for all CPUs.
- /LAST=n
Displays the last n instructions. If this qualifier is omitted, trace data is displayed for all instructions.
- /NOPAL
Do not include PAL code when displaying instructions.
- /REVERSE
Displays the instructions in reverse order.
- /SUMMARY
Displays the last 42 instructions.
- /SYMBOLIZE
Attempts to symbolize each instruction.
Example
SDA> OCLA SHOW TRACE/CPU=7/SUMMARY/SYMBOLIZE OCLA PC trace information for CPU 07 ------------------------------------ CPU 07 has 16384 valid entries 42 PC values displayed 0000002c00030358 ,PAL Code 0000002c0003035c ,PAL Code ffffffff81244c94 OCLA$DEBUG+00C94 ffffffff81244c98 OCLA$DEBUG+00C98 ffffffff81244c9c OCLA$DEBUG+00C9C ffffffff81244ca0 OCLA$DEBUG+00CA0 ffffffff81244ca4 OCLA$DEBUG+00CA4 ffffffff81244ca8 OCLA$DEBUG+00CA8 ffffffff81244cac OCLA$DEBUG+00CAC ffffffff81244cb0 OCLA$DEBUG+00CB0 ffffffff81244cd0 OCLA$DEBUG+00CD0 ffffffff81244cd4 OCLA$DEBUG+00CD4 ffffffff81244cd8 OCLA$DEBUG+00CD8 ffffffff81244cdc OCLA$DEBUG+00CDC ffffffff81244ce0 OCLA$DEBUG+00CE0 ...
This example shows a summary of the last PC instructions executed by CPU 7 and symbolizes the PC values.
In this example, lines of PAL code are identified by ",PAL Code".
7.2.10. OCLA START
Starts the acquisition of instructions into acquisition memory.
Format
OCLA START [/CPU=n]
Parameters
None.
Qualifiers
- /CPU=n
The CPU on which to start instruction acquisition. If this qualifier is omitted, instruction acquisition is started on all CPUs.
7.2.11. OCLA STOP
Stops the acquisition of instructions.
Format
OCLA STOP [/CPU=n]
Parameters
None.
Qualifiers
- /CPU=n
Specifies the CPU on which to stop acquisition. If this qualifier is omitted, acquisition is stopped on all CPUs.
7.2.12. OCLA UNLOAD
Unloads the OCLA$PCTRACE execlet and returns the acquisition buffers to the system.
Format
OCLA UNLOAD
Parameters
None.
Qualifiers
None.
Examples
SDA> OCLA DUMP OCLA PC trace performed for 8 CPUs SDA> OCLA SHOW TRACE/SUMMARY/SYMBOLIZE/CPU=0 OCLA PC trace information for CPU 00 ------------------------------------ CPU 00 has 16384 valid entries The overhead per allocation is 1208 42 PC values displayed ffffffff8012d3ac SCH$CALC_CPU_LOAD_C+0030C ffffffff8012d3b0 SCH$CALC_CPU_LOAD_C+00310 ffffffff8012d3b4 SCH$CALC_CPU_LOAD_C+00314 ffffffff8012d3b8 SCH$CALC_CPU_LOAD_C+00318 ffffffff8012d3bc SCH$CALC_CPU_LOAD_C+0031C ffffffff8012d3c0 SCH$CALC_CPU_LOAD_C+00320 ffffffff8012d4d8 SCH$CALC_CPU_LOAD_C+00438 ...
This series of commands demonstrates how you can use the OCLA SDA extension to interactively inspect a running system by reading the EV7 acquisition memory. The second command copies the EV7 acquisition cache memory into system memory and displays the collected values for CPU 0.
SDA> OCLA LOAD OCLA$PCTRACE load status = 00000001 SDA> OCLA ENABLE/RESET OCLA PC tracing enabled for 8 CPUs SDA> OCLA START OCLA PC tracing started for 8 CPUs
The series of commands in this example demonstrates how to load the OCLA execlet, enable the OCLA SDA extensions on each CPU in the system, and start each OCLA. Once started, the EV7 OCLA extensions collect data for each PC instruction executed by the active CPUs in the system.
In the unlikely event of a system failure, PC values recorded by the OCLA extensions are stored in the system dump file and can later be retrieved by using the System Dump Analyzer (SDA).
SDA> OCLA STOP OCLA PC tracing stopped for 8 CPUs SDA> OCLA DISABLE OCLA PC tracing disabled for 8 CPUs SDA> OCLA UNLOAD OCLA$PCTRACE unload status = 00000001
This series of commands stops all running OCLA extensions, disables and frees up system memory associated with each OCLA, and unloads the OCLA execlet from system memory.
Chapter 8. SDA SPL Extension
This chapter presents an overview of the SDA Spinlock Tracing (SPL) Utility and describes the SDA Spinlock Tracing commands.
8.1. Overview of the SDA Spinlock Tracing Utility
To synchronize access to data structures, the OpenVMS operating system uses a set of static and dynamic spinlocks, such as IOLOCK8 and SCHED. The operating system acquires a spinlock to synchronize data, and at the end of the critical code path the spinlock is then released. If a CPU attempts to acquire a spinlock while another CPU is holding it, the CPU attempting to acquire the spinlock has to spin, waiting until the spinlock is released. Any lost CPU cycles within such a spinwait loop are charged as MPsynch time.
By using the MONITOR utility, you can monitor the time in process modes, for example, with the command $ MONITOR MODES. A high rate of MP synchronization indicates contention for spinlocks. However, until the implementation of the Spinlock Tracing utility, there was no way to tell which spinlock was heavily used, and who was acquiring and releasing the contended spinlocks. The Spinlock Tracing utility allows a characterization of spinlock usage. It can also collect performance data for a given spinlock on a per-CPU basis.
This tracing ability is built into the system synchronization execlet, which contains the spinlock code, and can be enabled or disabled while the system is running. There is no need to reboot the system to load a separate debug image. The images that provide spinlock tracing functionality are as follows:
SYS$LOADABLE_IMAGES:SPL$DEBUG.EXE
SYS$SHARE:SPL$SDA.EXE
The SDA> prompt provides the command interface. From this command interface, you can load and unload the spinlock debug execlet using SPL LOAD and SPL UNLOAD, and start, stop and display spinlock trace data. This allows you to collect spinlock data for a given period of time without system interruption. Once information is collected, the trace buffer can be deallocated and the execlet can be unloaded to free up system resources. The spinlock trace buffer is allocated from S2 space and pages are taken from the free page list.
Should the system crash while spinlock tracing is enabled, the trace buffer is dumped into the system dump file, and it can later be analyzed using the spinlock trace utility. This is very useful in tracking down CPUSPINWAIT bugcheck problems.
Note that by enabling spinlock tracing, there is a performance impact. The amount of the impact depends on the amount of spinlock usage.
8.2. How to Use the SDA Spinlock Tracing Utility
The following steps will enable you to collect spinlock statistics using the Spinlock Tracing Utility.
Load the Spinlock Tracing Utility execlet.
SDA> SPL LOAD
Allocate a trace buffer and start tracing.
SDA> SPL START TRACE
Wait a few seconds to allow some tracing to be done, then find out which spinlocks are incurring the most acquisitions and the most spinwaits.
SDA> SPL SHOW TRACE/SUMMARY
For example, you might see contention for the SCHED and IOLOCK8 spinlocks (a high acquisition count, with a significant proportion of the acquisitions being forced to wait).
Look to see if the spinlocks with a high proportion of spinwaits caused a significant delay in the acquisition of the spinlock. You must now collect more detailed statistics on a specific spinlock.
SDA> SPL START COLLECT/SPINLOCK=SCHED
This command accumulates additional data for the specified spinlock. As long as tracing is not stopped, collection will continue to accumulate spinlock-specific data from the trace buffer.
Display the additional data collected for the specified spinlock.
SDA> SPL SHOW COLLECT
This display includes the average hold time of the spinlock and the average spinwait time while acquiring the spinlock.
Repeat steps 4 and 5 for each spinlock that has contention. A START COLLECT cancels the previous collection.
Disable spinlock tracing when you have collected all the needed spinlock statistics and release all the memory used by the Spinlock Tracing utility with the following commands.
SDA> SPL STOP COLLECT SDA> SPL STOP TRACE SDA> SPL UNLOAD
8.3. Example Command Procedure for Collection of Spinlock Statistics
The following example shows a command procedure that can be used for gathering spinlock statistics:
$ analyze/system spl load spl start trace/buffer=1000 wait 00:00:15 spl stop trace read/executive/nolog set output spl_trace.lis spl analyze spl show trace/summary spl start collect/spin=sched wait 00:00:05 spl show collect spl start collect/spin=iolock8 wait 00:00:05 spl show collect spl start collect/spin=lckmgr wait 00:00:05 spl show collect spl start collect/spin=mmg wait 00:00:05 spl show collect spl start collect/spin=timer wait 00:00:05 spl show collect spl start collect/spin=mailbox wait 00:00:05 spl show collect spl start collect/spin=perfmon wait 00:00:05 spl show collect spl stop collect spl unload exit $ exit
A more comprehensive procedure is provided as SYS$EXAMPLES:SPL.COM.
8.4. SDA Spinlock Tracing Commands
The SPL commands are described below.
8.4.1. SPL
Invokes the Spinlock Tracing Utility.
When entered by itself with no command keyword, the SPL command lists the SPL command options.
SDA> SPL
8.4.2. SPL ANALYZE
Analyzes collected spinlock data and presents the most relevant data.
Format
SPL ANALYZE [/[NO]CPU_STATISTICS |/[NO]PLATFORM |
/[NO]HOLD_TIMES=n/[NO]WAIT_TIMES=n
|/[NO]USAGE=(HOLD=n,SPIN=n,TOP_PCS=n)]
Parameters
None.
Qualifiers
- /CPU_STATISTICS (default)
- /NOCPU_STATISTICS
Displays per-CPU statistics.
- /HOLD_TIMES=n
- /NOHOLD_TIMES=n
Displays occurrences of spinlocks held longer than n microseconds. The default is 1000 microseconds.
- /PLATFORM (default)
- /NOPLATFORM
Displays system platform information.
- /USAGE=(HOLD=n,SPIN=n, TOP_PCS=n)
Specifies thresholds for displaying information on a spinlock. If the percentage of time a spinlock is held exceeds the value of HOLD=n, where n is a value from 0 to 100, displays the information on the spinlock. The default is 10%. If the percentage of time a spinlock is spinning exceeds the value of SPIN=n, displays the information on the spinlock. The default is 10%. If either the HOLD or SPIN thresholds are exceeded, displays information on a spinlock. The TOP_PCS=n keyword displays the top n unique callers to lock a spinlock. The default is to display the top five unique callers.
By specifying either /USAGE=(HOLD=0) or /USAGE=(SPIN=0), SPL displays information on all spinlock usage from the trace buffer.
- /WAIT_TIMES=n
- /NOWAIT_TIMES=n
Displays occurrences of spinlocks held longer than n microseconds. The default is 1000 microseconds.
Description
The SPL ANALYZE command analyzes collected spinlock data and displays the most relevant data.
The SPL ANALYZE command provides an overview of SPINLOCK usage on a system. Data are provided by CPU and by spinlock. When looking at a system with high MP_Synch time, this is a good command to start with. Stop spinlock tracing before using this command.
Example
SDA> SPL ANALYZE/HOLD=50/WAIT=50/USAGE=HOLD=5
Spinlock Analysis (1)
Platform
------------------------------------------------
Node: CLU21
Hardware: AlphaServer ES45 Model 2
Active CPUs: 4
Memory: 16.00 GB
CPU Frequency: 1.000 GHz
Trace Buffer: 1280 pages (10.00 MB)
Trace Time: 0.48 seconds
Trace Start: 15-OCT 10:51:53.427386
CPU statistics (2)
% Time in % Time % Time All Spinlocks All Spinlocks
CPU ID Fork Dispatcher Spinlocks Held MP_Synch Acquires/sec Waits/sec
------ --------------- -------------- ---------- ------------- -------------
00 0.1 16.2 1.1 82210.4 1434.7
01 0.1 15.8 1.2 79551.5 1548.3
02 0.0 16.4 1.2 85690.9 1511.1
03 1.7 17.7 1.1 86601.3 1451.2
------ --------------- -------------- ---------- ------------- -------------
Total 1.9 66.1 4.6 334054.1 5945.3
Spinlock Usage (3)
Spin to
Spinlock % Time Held Acquires/sec Average Hold % Time Spinning Waits/sec Average Spin Hold Ratio
------------ ----------- ------------ ------------ --------------- ------------ ------------ -----------
FILSYS 15.6 33776.8 4609 2.6 2314.1 11379 0.2
LCKMGR 9.3 26198.6 3560 1.2 2208.8 5494 0.1
PCB$00000426 7.2 49420.4 1451 0.0 35.1 6342 0.0
PCB$00000428 7.1 49125.2 1437 0.0 14.5 7532 0.0
Spinlock (4) % Time Acquires Spinwaits Average
Caller's PC Held /sec Average /sec Spinwait
---------------------------------------------- ------ --------- --------- --------- ---------
FILSYS
8022CA44 SEARCH_FCB_C+00604 12.0 4021.3 29793 303.5 11985
80222E10 SET_DIRINDX_C+00030 0.5 4194.7 1163 247.7 11477
8021B06C START_REQUEST_C+0006C 0.4 2438.0 1607 384.0 15838
8021B208 FINISH_REQUEST_C+00058 0.4 2440.1 1510 206.4 15862
800FC508 IOC_STD$MAPVBLK_C+000C8 0.3 2014.8 1713 402.5 9518
LCKMGR
801DEB14 EXE$ENQ_C+00A44 3.5 12984.7 2657 988.8 5727
801E3B94 EXE$DEQ_C+00114 3.0 5943.2 5109 538.8 4849
801E03BC LOCKING+023BC 2.6 5941.2 4315 392.2 5682
801E5C84 LCK$DEQLOCK_C+00F54 0.3 1323.2 2091 289.0 5642
PCB$00000426
801782F8 SCH$ASTDEL_C+00078 1.9 15525.9 1256 0.0 0
80179AC4 SCH$QAST_C+00094 1.7 8907.6 1935 0.0 0
8017A780 SCH$QUEUE_AST_CURRENT_C+00070 1.2 7859.0 1532 0.0 0
80178FE0 SCH$ASTDEL_K_C+00090 1.2 8895.3 1320 8.3 2346
80179124 SCH$ASTDEL_K_C+001D4 1.1 7780.5 1355 0.0 0
PCB$00000428
801782F8 SCH$ASTDEL_C+00078 2.0 15606.4 1308 0.0 0
80179AC4 SCH$QAST_C+00094 1.6 8810.6 1794 0.0 0
80178FE0 SCH$ASTDEL_K_C+00090 1.2 8810.6 1344 6.2 2589
8017A780 SCH$QUEUE_AST_CURRENT_C+00070 1.2 7904.4 1492 0.0 0
80179124 SCH$ASTDEL_K_C+001D4 1.0 7728.9 1340 0.0 0
8017A780 SCH$QUEUE_AST_CURRENT_C+00070 1.1 8655.8 1298 0.0 0
80179124 SCH$ASTDEL_K_C+001D4 1.1 8598.0 1225 0.0 0
80178FE0 SCH$ASTDEL_K_C+00090 1.1 9192.5 1144 2.1 2326
Long Spinlock Hold Times (> 50 microseconds) (5)
Timestamp CPU Spinlock | Forklock Calling PC | Forking PC EPID Hold (us)
---------------------- --- --------------------- -------------------------------------- -------- ---------
15-OCT 10:51:53.801244 00 81D6A200 81D6A200 8051B380 LAN$COMPLETE_VCRP_CSMACD_C+00 00000000 64
15-OCT 10:51:53.538665 00 818BBE00 POOL 8004B334 EXE$ALONPAGVAR_C+002F4 00000000 59
15-OCT 10:51:53.538331 03 81F75980 PCB$00000429 8017A808 SCH$QUEUE_AST_CURRENT_C+000F8 00000000 56
15-OCT 10:51:53.597448 03 818BBE00 POOL 8004B334 EXE$ALONPAGVAR_C+002F4 00000000 52
15-OCT 10:51:53.670228 03 818BBE00 POOL 8004B334 EXE$ALONPAGVAR_C+002F4 00000000 51
Long Spinlock Wait Times (> 50 microseconds) (6)
Timestamp CPU Spinlock | Forklock Calling PC | Forking PC EPID Wait (us)
---------------------- --- --------------------- -------------------------------------- -------- ---------
15-OCT 10:51:53.454082 03 818BCB00 FILSYS 800FC508 IOC_STD$MAPVBLK_C+000C8 00000000 79
15-OCT 10:51:53.661343 02 818BCB00 FILSYS 8021B208 FINISH_REQUEST_C+00058 00000000 76
15-OCT 10:51:53.661256 00 818BCB00 FILSYS 8021EDD0 F11BXQP+08DD0 00000000 66
15-OCT 10:51:53.898618 00 818BCB00 FILSYS 8021B06C START_REQUEST_C+0006C 00000000 53This example shows the output of the SPL ANALYZE command, which is divided into several sections:
Spinlock Analysis:
Shows information on the platform such as the hardware type, the number of CPUs and the speed of the CPUs.
CPU Statistics:
Shows spinlock information on a per CPU basis. The percentage of time the CPU owns spinlock is displayed along with a percentage of time the CPU was executing from the fork dispatcher. This information can be very useful in determining the amount of time a CPU is in use for processing I/O.
Spinlock Usage:
Shows information on the spinlock usage by the system. This data is sorted by the percentage of time the spinlocks are held. The average hold time displayed is in system cycles. The display also includes the percent of time that CPUs are waiting on this spinlock along with the average number of cycles a CPU needed to wait before it was able to acquire the spinlock.
Spinlock:
For each spinlock displayed in section 3, the top callers are displayed sorted by the number of acquires per second that occurred. In addition, the average hold and wait time for each caller is displayed in system cycles.
Long Spinlock Hold Times:
The section on Long Spinlock Hold Times shows occurrences of spinlocks whose hold time exceeded a threshold. In the above report, the threshold was specified as 50 microseconds. The EPID at the time of the acquire is also displayed. An EPID of 0 indicates that the spinlock acquire did not occur in process context.
Long Spinlock Wait Times:
The section on Long Spinlock Wait Times shows occurrences of spinlocks whose wait time exceeded a threshold. In the above report, the threshold was specified as 50 microseconds. The EPID at the time of the acquire is also displayed. An EPID of 0 indicates that the spinlock acquire did not occur in process context.
8.4.3. SPL LOAD
Loads the SPL$DEBUG execlet. This must be done prior to starting spinlock tracing.
Format
SPL LOAD
Parameters
None.
Qualifiers
None.
Description
The SPL LOAD command loads the SPL$DEBUG execlet, which contains the tracing routines.
Example
SDA> SPL LOAD SPL$DEBUG load status = 00000001
8.4.4. SPL SHOW COLLECT
Displays the collected spinlock data.
Format
SPL SHOW COLLECT [/RATES|/TOTALS]
Parameters
None.
Qualifiers
- /RATES
Reports activity as a rate per second and hold/spin time as a percentage of time. This is the default.
- /TOTALS
Reports activity as a count and hold/spin time as cycles.
Description
The SPL SHOW COLLECT command displays the collected spinlock data. It displays first a summary on a per-CPU basis, followed by the callers of the specific spinlock. This second list is sorted by the top consumers of the spinlock (in percent of time held). These displays show average spinlock hold and spinlock wait time in system cycles.
Example
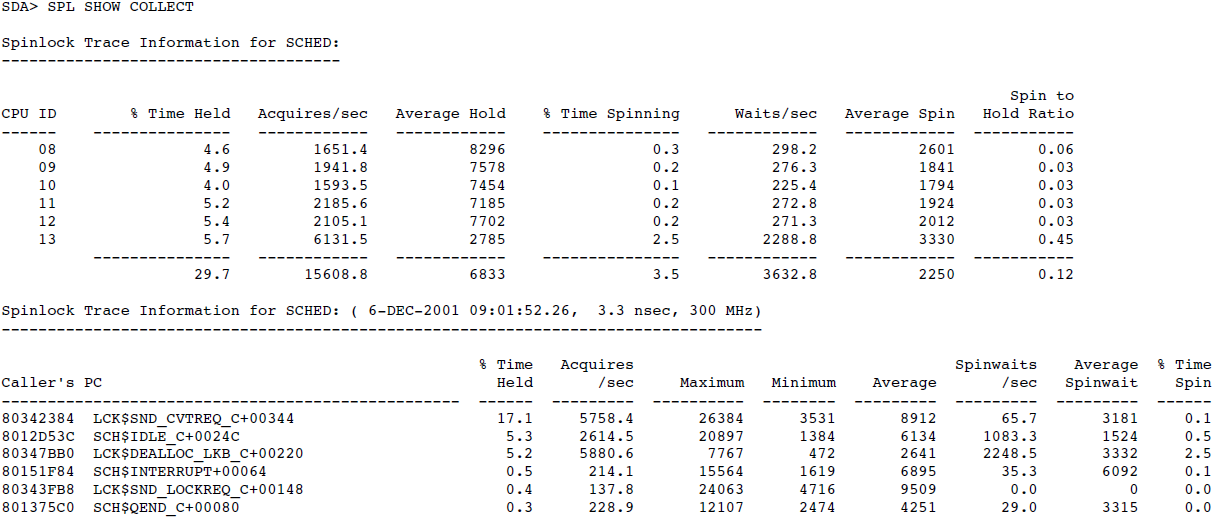 |
8.4.5. SPL SHOW TRACE
Displays spinlock tracing information.
Format
SPL SHOW TRACE [ /[NO]ACQUIRE | /CPU=n
| /[NO]FORKLOCK=forklock | /[NO]FRKDSPTH
| /[NO]FRKEND | /RATES | /[NO]RELEASE
| /[NO]SPINLOCK=spinlock | /SUMMARY
| /TOP=n | /TOTALS | /[NO]WAIT ]
Parameters
None.
Qualifiers
- /ACQUIRE
- /NOACQUIRE
The /ACQUIRE qualifier displays any spinlock acquisitions.
The /NOACQUIRE qualifier ignores any spinlock acquisitions.
- /CPU=n
Specifies the display of information for a specific CPU only, for example, /CPU=5 or /CPU=PRIMARY. By default, all trace entries for all CPUs are displayed.
- /FORKLOCK=forklock
- /NOFORKLOCK
The /FORKLOCK=forklock qualifier specifies the display of a specific forklock, for example, /FORKLOCK=IOLOCK8 or /FORKLOCK=IPL8.
The /NOFORKLOCK qualifier specifies that no forklock trace information be displayed. By default, all fork trace entries are decoded and displayed.
- /FRKDSPTH
- /NOFRKDSPTH
The /FRKDSPTH qualifier displays all invocations of fork routines within the fork dispatcher. This is the default.
The /NOFRKDSPTH qualifier ignores all of the operations of the /FRKDSPTH qualifier.
- /FRKEND
- /NOFRKEND
The /FRKEND qualifier displays all returns from fork routines within the fork dispatcher. This is the default.
The /NOFRKEND qualifier ignores all operations of the /FRKEND qualifier.
- /RATES
Reports activity as a rate per second and hold/spin time as a percentage of time. This is the default.
- /RELEASE
- /NORELEASE
The /RELEASE qualifier displays any spinlock releases.
The /NORELEASE qualifier ignores any spinlock releases.
- /SPINLOCK=spinlock
- /NOSPINLOCK
The /SPINLOCK=n qualifier specifies the display of a specific spinlock, for example, /SPINLOCK=LCKMGR or /SPINLOCK=SCHED.
/NOSPINLOCK specifies that no spinlock trace information be displayed. By default, all spinlock trace entries are decoded and displayed.
- /SUMMARY
Steps through the entire trace buffer and displays a summary of all spinlock and forklock activity. It also displays the top ten callers.
- /TOP=n
Displays a different number other than the top ten callers or fork PCs. By default, the top ten are displayed. This qualifier is useful only when you also specify /SUMMARY.
- /TOTALS
Reports activity as a count and hold/spin time as cycles.
- /WAIT
- /NOWAIT
The /WAIT qualifier displays any spinwait operations.
The /NOWAIT qualifier ignores any spinwait operations.
Description
The SPL SHOW TRACE command displays spinlock tracing information. The latest acquired or released spinlock is displayed first, and then the trace buffer is stepped backwards in time.
By default, all trace entries will be displayed, but you can use qualifiers to select only certain entries.
Since this is not a time critical activity and a table lookup has to be done anyway to translate the SPL address to a spinlock name, commands like /SPINLOCK=(SCHED,IOLOCK8) do work. /SUMMARY will step the entire trace buffer and display a summary of all spinlock activity, along with the top-ten callers' PCs. You can use /TOP=n to display a different number of the top ranked callers.
Examples
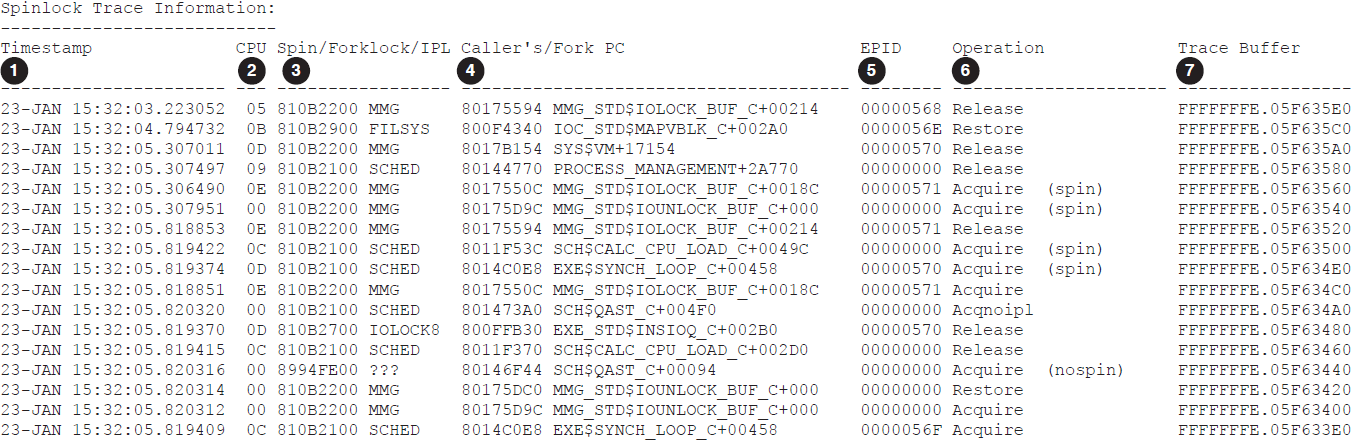 |
| Callout | Meaning |
|---|---|
| 1 | Shows timestamps that are collected as system cycle counters (SCC) and then displayed with an accuracy down to microseconds. Each CPU is incrementing its own SCC as soon as it is started, so there is some difference between different CPUs' system cycle counters. The standard system time is incremented only every 10 Msec and as such is not exact enough. Adjusting the SCC to the specific CPU's system time and translating it into an accurate timestamp will thus sometimes display times out of order for different CPUs. However, for the same CPU ID, the timestamps are accurate. |
| 2 | Shows the physical CPU ID of the CPU logging the trace entry. |
| 3 | Shows the address of the spinlock fork. If it is a static one, its name is displayed; otherwise, it is marked as ???. |
| 4 | Shows the caller's PC address that acquired or released the spinlock, or the fork PC if the trace entry is a forklock. Symbolization is attempted, so a READ/EXECUTIVE might help to display a routine name, instead of simply a module and offset. |
| 5 | Shows the EPID, which is the external PID of the process generating the trace entry. If an interrupt or fork was responsible for the entry, then a zero EPID is displayed. |
| 6 | Shows the trace operation. For a spinlock, which was acquired without going through a spinwait, there is a matching acquire/release pair of trace entries for the same CPU ID for a given spinlock. If a spinlock is held, it cannot be acquired immediately, so there is also a spinwait trace entry for this pair. The different variations of the acquire and release operations are distinguished, as are the same spinlocks if they are acquired recursively multiple times. |
| 7 | Shows the address of the trace buffer entry, in case there is a need to access the raw and undecoded trace data. |
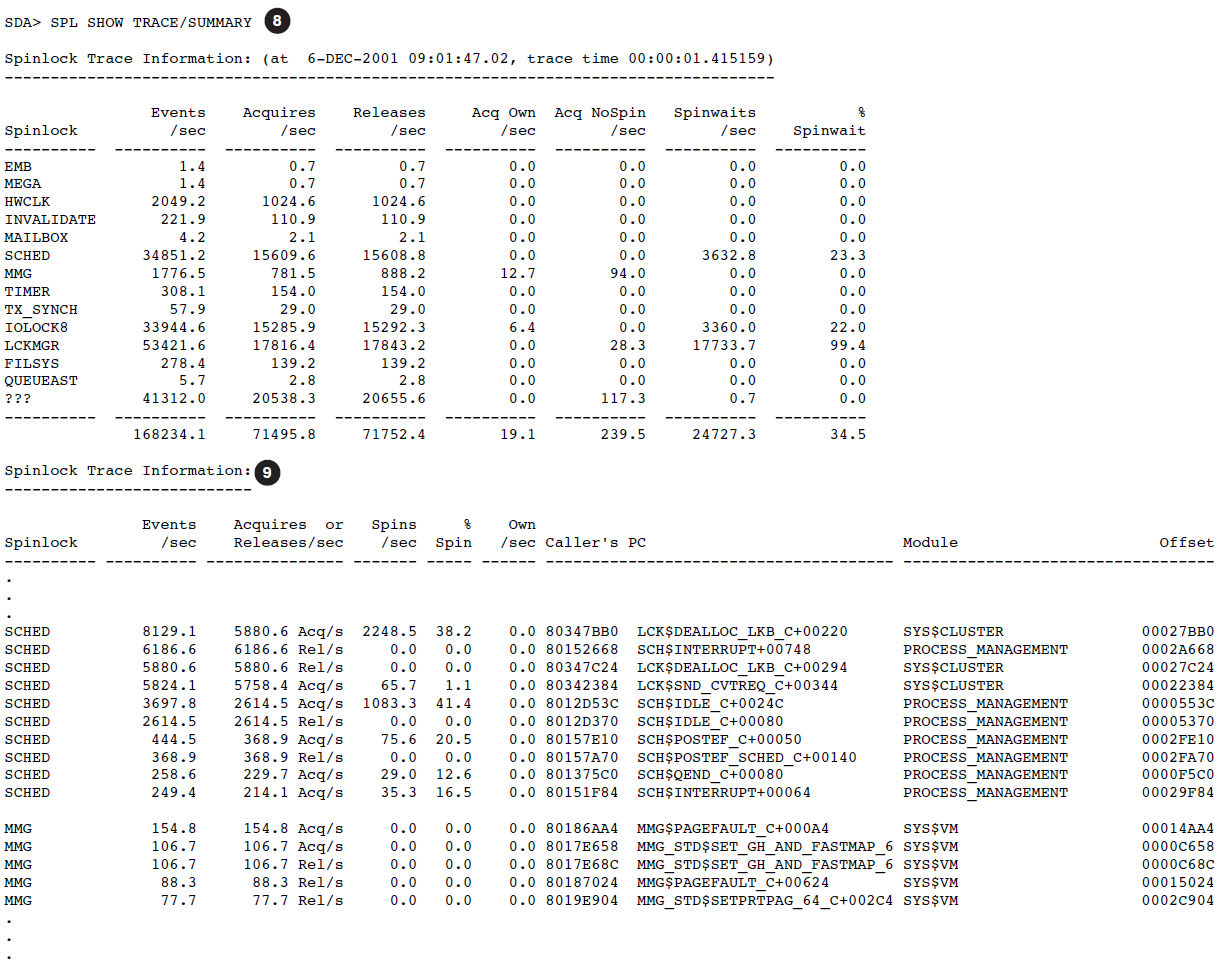 |
| Callout | Meaning |
|---|---|
| 8 | Shows the summary information by stepping through the whole trace buffer, and displaying a single line of information for each spinlock. If the percent of spin wait is very high, then a spinlock is a candidate for high contention. |
| 9 | For each spinlock in the summary display, the top ten callers' PCs are displayed along with the number of spinlock acquisitions and releases, as well as spinwait counts and the number of multiple acquisitions of the same spinlock. |
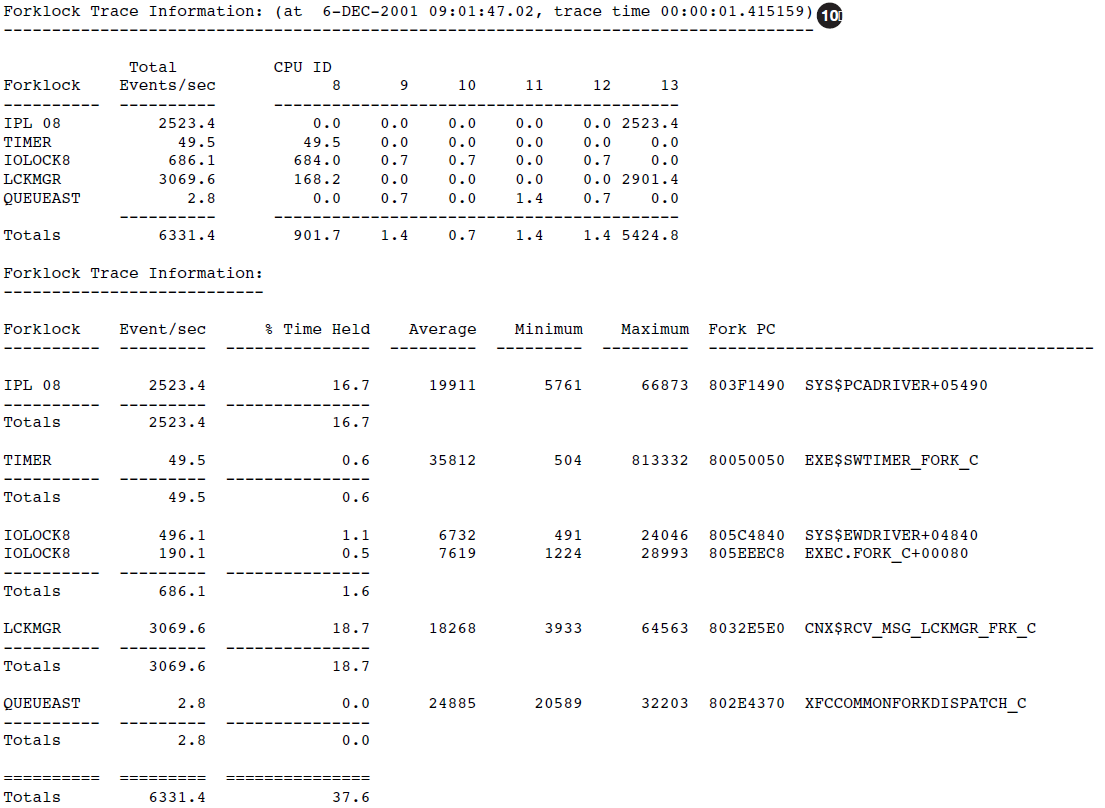 |
| Callout | Meaning |
|---|---|
| 10 | The forklock summary displays the number of fork operations on a specific CPU for each forklock. For each forklock, the top ten fork PC addresses are displayed, along with the minimum, maximum and average duration of the fork operation in system cycles. The percent of time spent in a given fork routine is displayed along with the percent of time for the forklock. |
8.4.6. SPL START COLLECT
Starts to collect spinlock information a longer period of time than will fit into the trace buffer.
Format
SPL START COLLECT
[/SPINLOCK=spinlock|/ADDRESS=n]
Parameters
None.
Qualifiers
- /ADDRESS=n
Specifies the tracing of a specific spinlock by address.
- /SPINLOCK=spinlock
Specifies the tracing of a specific spinlock, for example, /SPINLOCK=LCKMGR or /SPINLOCK=SCHED.
Description
The SPL START COLLECT command starts a collection of spinlock information for a longer period of time than will fit into the trace buffer. You need to enable spinlock tracing before a spinlock collection can be started. On a system with heavy activity, the trace buffer typically can only hold a relatively small time window of spinlock information. In order to collect spinlock information over a longer time period, a collection can be started. The collection tries to catch up with the running trace index and save the spinlock information into a balanced tree within the virtual address space of the process performing the spinlock collection. Either use the name of a static spinlock, or supply the address of a dynamic spinlock, for which information should be gathered.
The trace entries are kept in the trace buffer, which is allocated from S2 space, hence there is no disruption, if tracing is started from within SDA and then the user exits from SDA. However, for the longer period data collection, the information is kept in process-specific memory, thus a user needs to stay within SDA; otherwise the data collection is automatically terminated by SDA's image rundown. You can collect data for two or more spinlocks simultaneously, by using a separate process for each collection.
Example
SDA> SPL START COLLECT Use /SPINLOCK=name or /ADDRESS=n to specify which spinlock info needs to be collected...
This example shows that you need to supply either a spinlock name of a static spinlock, or the address of a dynamic spinlock, if you want to collect information over a long period of time.
SDA> SPL START COLLECT/SPINLOCK=LCKMGR
This example shows the command line to start to collect information on the usage of the LCKMGR spinlock.
8.4.7. SPL START TRACE
Enables spinlock tracing.
Format
SPL START TRACE [ /[NO]ACQUIRE | /BUFFER=pages | /CPU=n
| /[NO]FORKLOCK=forklock | /[NO]FRKDSPTH
| /[NO]FRKEND | /[NO]RELEASE
| /[NO]SPINLOCK=spinlock | /[NO]WAIT ]
Parameters
None.
Qualifiers
- /ACQUIRE
- /NOACQUIRE
The /ACQUIRE qualifier traces any spinlock acquisitions. This is the default.
The /NOACQUIRE qualifier ignores any spinlock acquisitions.
- /BUFFER=pages
Specifies the size of the trace buffer (in page units). It defaults to 128 pages, which is equivalent to 1MB, if omitted.
- /CPU=n
Specifies the tracing of a specific CPU only, for example, /CPU=5 or /CPU=PRIMARY. By default, all CPUs are traced.
- /FORKLOCK=forklock
- /NOFORKLOCK
The /FORKLOCK=forklock qualifier specifies the tracing of a specific forklock, for example, /FORKLOCK=IOLOCK8 or /FORKLOCK=IPL8.
The /NOFORKLOCK qualifier disables forklock tracing and does not collect any forklock data. By default, all forks are traced.
- /FRKDSPTH
- /NOFRKDSPTH
The /FRKDSPTH qualifier traces all invocations of fork routines within the fork dispatcher. This is the default.
The /NOFRKDSPTH qualifier ignores all of the /FRKDSPTH operations.
- /FRKEND
- /NOFRKEND
The /FRKEND qualifier traces all returns from fork routines within the fork dispatcher. This is the default.
The /NOFRKEND qualifier ignores all of the operations of the /FRKEND qualifier.
- /RELEASE
- /NORELEASE
The /RELEASE qualifier traces any spinlock releases. This is the default.
The /NORELEASE qualifier ignores any spinlock releases.
- /SPINLOCK=spinlock
- /NOSPINLOCK
The /SPINLOCK=spinlock qualifier specifies the tracing of a specific spinlock, for example, /SPINLOCK=LCKMGR or /SPINLOCK=SCHED.
The /NOSPINLOCK qualifier disables spinlock tracing and does not collect any spinlock data. By default, all spinlocks are traced.
- /WAIT
- /NOWAIT
The /WAIT qualifier traces any spinwait operations. This is the default.
The /NOWAIT qualifier ignores any spinwait operations.
Description
The SPL START TRACE command enables spinlock and fork tracing. By default all spinlocks and forklocks are traced and a 128 page (1MByte) trace buffer is allocated and used as a ring buffer.
Example
SDA> SPL START TRACE/BUFFER=1000 Tracing started... (Spinlock = 00000000, Forklock = 00000000)
This example shows how to enable a tracing for all spinlock and forklock operations into a 8 MByte trace buffer.
SDA> SPL START TRACE/CPU=PRIMARY/SPINLOCK=SCHED /NOFORKLOCK Tracing started... (Spinlock = 810AF600, Forklock = 00000000)
This example shows how to trace only SCHED spinlock operations on the primary CPU.
SDA> SPL START TRACE /NOSPINLOCK /FORKLOCK=IPL8 Tracing started... (Spinlock = 00000000, Forklock = 863A4C00)
This example shows how to trace only fork operations to IPL8.
8.4.8. SPL STOP COLLECT
Stops the spinlock collection, but does not stop spinlock tracing.
Format
SPL STOP COLLECT
Parameters
None.
Qualifiers
None.
Description
The SPL STOP COLLECT command stops the data collection, but does not affect tracing. This allows the user to start another collection for a different spinlock during the same trace run.
Example
SDA> SPL STOP COLLECT
8.4.9. SPL STOP TRACE
Disables spinlock tracing, but it does not deallocate the trace buffer.
Format
SPL STOP TRACE
Parameters
None.
Qualifiers
None.
Description
The SPL STOP TRACE command stops tracing, but leaves the trace buffer allocated for further analysis.
Example
SDA> SPL STOP TRACE Tracing stopped...
8.4.10. SPL UNLOAD
Unloads the SPL$DEBUG execlet and performs cleanup. Tracing is automatically disabled and the trace buffer deallocated.
Format
SPL UNLOAD
Parameters
None.
Qualifiers
None.
Description
The SPL UNLOAD command disables the tracing or collection functionality with a delay to a state of quiescence. This ensures that all pending trace operations in progress have finished before the trace buffer is deallocated. Finally the SPL UNLOAD command unloads the SPL$DEBUG execlet.
Example
SDA> SPL UNLOAD SPL$DEBUG unload status = 00000001
Chapter 9. SDA XFC Extension
The SDA extension commands for Extended File Cache (XFC) enable you to display the following information in a convenient and readable format:
Various XFC data structures
Statistics that aid in tuning the extended file cache
You can also control the types of events that are recorded by XFC's tracing feature.
9.1. SDA XFC Commands
The following pages describe the SDA XFC extension commands.
You can enter XFC commands at the SDA prompt. Access XFC online Help using the following command:
SDA> XFC HELP
XFC SET TRACE
XFC SET TRACE — Controls the types of events to be recorded by XFC's trace facility and initializes the trace structures (to eliminate events that have already been recorded).
Format
XFC SET TRACE [/SELECT=LEVEL:level]
[/RESET] Parameters
None.
Qualifiers
- /SELECT=LEVEL:level
Specifies the level of tracing in XFC on a live system. The possible values for level are as follows:
1 (Default) Traces only major, unusual events. 2 Traces file access, deaccess, truncate, read start and complete, and write start and complete operations. Results are displayed using the SHOW TRACEcommand. Setting this trace level has only a minor performance impact.3 Performs more detailed tracing, which can be viewed using the SHOW TRACE/RAWcommand. Has some performance impact.4 Performs very detailed tracing with a noticeable performance impact. - /RESET
Initializes the trace buffer to eliminate all events that have already been traced.
Description
The XFC SET TRACE command controls the types of events to
be recorded by XFC's trace facility and initializes the trace structures.
Traceable events within the XFC facility are organized by level of importance,
from level 1 for rare, unusual events only, through level 4, which is a very
detailed trace of events within the I/O flow through
XFC. The trace buffer can be reset to clear older trace points.
XFC SHOW CONTEXT
XFC SHOW CONTEXT — Displays the contents of an XFC context block (CTX).
Format
XFC SHOW CONTEXT [address]
[/BRIEF|/FULL|/STALLING] Parameter
address The address of the CTX. If no address is supplied, then all the context structures are displayed.
Qualifiers
- /BRIEF
Displays a brief summary for each context. For example, the I/O type, start virtual block number (VBN), and length of I/O.
- /FULL
Displays the complete context structure. This is the default.
- /STALLING
Displays only contexts that are stalling. For example, those that have a stall reason code other than estrNotStalling.
Description
The XFC SHOW CONTEXT command displays the contents of an
active context block. The state of each active operation within XFC is
maintained in a data structure called a context block.
Examples
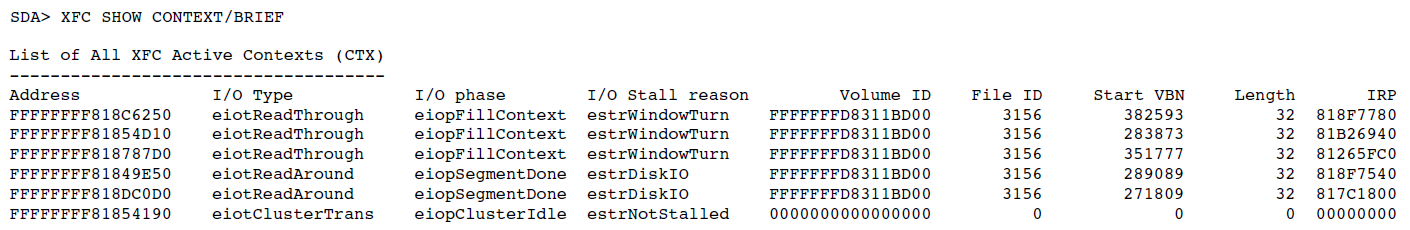
This example shows the address of the context block, I/O type (the type of operation), I/O phase (what phase the operation is in), I/O stall (reason for its stalling), volume ID (address of the control volume block), start VBN (starting VBN of the I/O), length of the I/O, and I/O request packet (the address of the IRP).
SDA> XFC SHOW CONTEXT FFFFFFFF8190D690 List of All XFC Active Contexts (CTX) ------------------------------------- Context (CTX) Address: FFFFFFFF8190D690 I/O Phase: eiopFillContext I/O Type: eiotReadThrough Operation started: 17-APR-2002 11:23:29.00 Stall Reason: estrWindowTurn Stall Extent: 0000000000000000 Stall Op (IRP): FFFFFFFF81267A40 Saved AST Parameter: 0000000000000000 Restart Routine: 0000000000000000 Context state flags 00000000 Cache Hit: False HWM Checked: False Fork Restarted False AST Required (flush) False Buffer locked False Stalled converting False Fork Block in use False Override resource checks False Restart cluster trans False Restart cluster flush False MV volumes skipped False Depose pending False Ignore CFB Quiesce False Delete CFB False Read-ahead hit False ECB Count: 0 Index: 00000000 ( 0) Start VBN: 000107C1 ( 67521) Length in Blocks: 00000020 ( 32) Next VBN: 000107C1 ( 67521) I/O Extent Count: 0 Disk I/O Length: 00000020 ( 32) Bytes Copied: 0 Bytes Zeroed: 0 Bytes Requested: 16384 Volume (CVB): 0000000000000000 Volume Id: FFFFFFFD8311BD00 File Id: 0000000000000C54 Cache File Block: FFFFFFFD82CEA2A0 Process (PCB): FFFFFFFF818FA500
This example shows output of a full display of a context block for a read I/O.
XFC SHOW EXTENT
XFC SHOW EXTENT — Displays the contents of an extent control block (ECB).
Format
XFC SHOW EXTENT address Parameters
address The address of the ECB.
Qualifiers
None.
Description
The XFC SHOW EXTENT command displays the contents of an
extent control block. The data in the cache is divided into groups of VBNs
called extents. Each extent is maintained in a data structure called an extent
control block.
Example
SDA> XFC SHOW EXTENT FFFFFFFD82A58A20
Cache Extent Address: FFFFFFFD82A58A20
Type: Primary
Flink: FFFFFFFF7F880350
Blink: FFFFFFFF7F880350
Start VBN: 00000001 ( 1)
Start LBN: 00BA711C ( 12218652)
Length in Blocks: 00000006 ( 6)
Data State: Clean
Pin: None
Buffer Address: FFFFFFFDB0996000
Secondary ECB Queue: FFFFFFFD82A58A60
Flink: FFFFFFFD83199A20
Blink: FFFFFFFD83199A20
Primary ECB: 0000000000000000
LRU Queue: FFFFFFFD82A58AAC
Flink: FFFFFFFD82A5A26C
Blink: FFFFFFFD82A5344C
Waiters Queue: FFFFFFFD82A58A50
Flink: FFFFFFFD82A58A50
Blink: FFFFFFFD82A58A50
Lock Id: 00000000
Parent CFB: FFFFFFFD82A61180
ECB delete pending False
ECB on LRU queue True
ECB depose pending False
ECB read ahead False
LRU priority: 1This example shows the contents of an extent control block.
XFC SHOW FILE
XFC SHOW FILE — Displays the contents of the cache file block (CFB).
Format
XFC SHOW FILE [address] [/[NO]DISPLAY_NAME]
[/BRIEF|/FULL]
[/EXTENTS|/ID=file-id|/CVB=address]
[/OPEN|/CLOSED|/STATISTICS] Parameter
address The address of the CFB. The /OPEN and
/CLOSED qualifiers, if present, are ignored. If no
address is supplied, all the CFBs are displayed.
Qualifiers
- /BRIEF
Displays the following summary information for each cache file block (CFB): CFB address, cache volume block (CVB) address, access count, active I/O count, and file ID.
The
/BRIEFqualifier is incompatible with the/EXTENTS,/FULL, and/STATISTICSqualifiers.If the file specification is available in LIB$FID_TO_NAME(), it is displayed. Otherwise, the file ID is displayed.
Note
Since the volume is accessed through its logical name, if two volumes are mounted that have the same logical name (for example, one mounted with
/SYSTEMand one mounted privately, which results in the same logical name in two different access-mode logical name tables), the incorrect file specification might be displayed.- /CLOSED
Displays only CFBs whose access count is zero.
- /CVB=address
Displays information only for files matching the given cache volume block address.
- /DISPLAY_NAME (Default)
/NODISPLAY_NAME Controls whether the file specification is displayed.
- /EXTENTS
Displays the cache extents held in cache for any displayed files. This shows the primary and secondary cache extents along with their data state, virtual block numbers (VBNs), and logical block numbers (LBNs). It also shows a summary of memory usage (pagelets used and pagelets valid) for any displayed files. The
/EXTENTSqualifier is incompatible with the/BRIEFqualifier.- /FULL
Displays all fields for each cache file block. This is the default.
If the file specification is available in LIB$FID_TO_NAME(), it is displayed; otherwise, the file ID is displayed.
Note
Since the volume is accessed through its logical name, if two volumes are mounted that have the same logical name (for example, one mounted with
/SYSTEMand one mounted privately, which results in the same logical name in two different access-mode logical name tables), the incorrect file specification might be displayed.- /ID=file-id
Displays only information about any files matching the given file-identification (FID). The file identification (FID) is the hexadecimal file number component in a format file ID (file number, sequence number, and relative volume number).
- /OPEN
Displays only CFBs whose access count is greater than zero.
- /STATISTICS
Displays more statistics about the specified file. The
/STATISTICSqualifier is incompatible with the/BRIEFqualifier.
Description
The XFC SHOW FILE command displays the contents of the XFC
cache file block. The state of any file in the cache is maintained in a data
structure called a cache file block (CFB). There is a CFB for every open file on
a system and a CFB for each closed file that is still being cached.
Examples
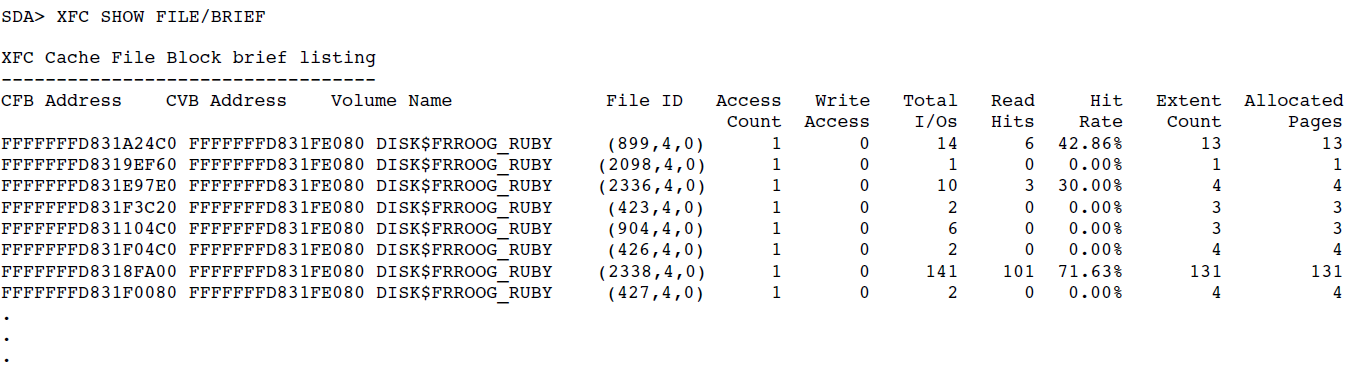
This example shows the brief output from this command.
SDA> XFC SHOW FILE/STATISTICS FFFFFFFD831A24C0 Full Cache File Block (CFB) Details ----------------------------------- CFB Address: FFFFFFFD831A24C0 CFB Address: FFFFFFFD831A24C0 Flink: FFFFFFFD831A22C0 Blink: FFFFFFFD831A2700 Access Count: 1 Write Access Count: 0 Volume (CVB): FFFFFFFD831FE080 Quiescing: False File (FCB): FFFFFFFF81943D80 Volume Id: FFFFFFFD831FE080 File Id: 0000000000000383 External FID: (899,4,0) Predicted Next VBN: 000000FB ( 251) Active Caching Mode: Write Through Active I/O count: 0 Flush Fail Status: 00000000 ( 0) No Readahead Reasons: 0 Active Readaheads: 0 File Bad: False Caching disabled: False File deleted on close: False File Quiescing: False File Deposing: False File Deleting: False File BlkASTInProg: False File IgnoreBlkAST False File Readahead EOF False PECBs Allocated: 13 ( 13 pages) PECBs Deallocated: 0 PECBs Deallocated: 0 SECBs Allocated: 3 SECBs Deallocated: 19 Lock Id: 0C00037F Granted Lock mode: PRMode Conversion phase: Illegal Conversion phase count: 1 Hash Bucket Queue: FFFFFFFD831A2520 Flink: FFFFFFFF7FF819B0 Blink: FFFFFFFF7FF819B0 PECB Queue: FFFFFFFD831A2530 Flink: FFFFFFFD8311888C Blink: FFFFFFFD831A072C Stalled IOs Queue: FFFFFFFD831A24F0 Flink: FFFFFFFD831A24F0 Blink: FFFFFFFD831A24F0 FAL transition Queue: FFFFFFFD831A2500 Flink: FFFFFFFD831A2500 Blink: FFFFFFFD831A2500 Contexts Waiting: FFFFFFFD831A2510 Flink: FFFFFFFD831A2510 Blink: FFFFFFFD831A2510 BlkASTs Waiting: FFFFFFFD831A2540 Flink: FFFFFFFD831A2540 Blink: FFFFFFFD831A2540 Deaccess Wait List: FFFFFFFD831A2600 Flink: 0000000000000000 Quiesce context: 0000000000000000 Up convert context: 0000000000000000 File IO Statistics - all in decimal ----------------------------------- Statistics Valid From: 19-APR-2002 07:10:32.77 Total QIOs to this file: 14 Read IOs to this file: 14 Write IOs to this file: 0 Write IOs to this file: 0 Read Hits: 6 Hit Rate: 42.86 % Average Overall I/O response time to this file in milliseconds: 0.9525 Average Cache Hit I/O response time to this file in milliseconds: 0.0702 Average Disk I/O response time to this file in milliseconds: 1.6141 Accuracy of I/O resp time: 65 % Read Ahead Count: 0 Read Through Count: 14 Write Through Count: 0 Read Around Count: 0 Write Around Count: 0 CFB FAL stalls: 1 CFB Operation stalls: 0 FAL Blocking ASTs: 0 Quiesce Depose: 0 Quiesce depose Stalls: 0 (I/O size statistics not collected for this file) Files found: 1This example shows a collection of performance statistics for a file.
XFC SHOW HISTORY
XFC SHOW HISTORY — Displays approximately three days of XFC activity in 10-minute intervals.
Format
XFC SHOW HISTORY Parameters
None.
Qualifiers
None.
XFC SHOW IRP
XFC SHOW IRP — Displays a subset of the fields of an I/O Request Packet that has relevance for XFC debugging.
Format
XFC SHOW IRP address Parameter
address The address of the IRP structure whose relevant fields are to be decoded and displayed.
Qualifiers
None.
XFC SHOW MEMORY
XFC SHOW MEMORY — Displays information about memory used by the cache.
Format
XFC SHOW MEMORY [/BRIEF|/FULL] Parameters
None.
Qualifiers
- /BRIEF
Displays summary statistics on XFC memory use.
- /FULL
Displays full statistics on XFC memory use. This is the default.
Examples
SDA> XFC SHOW MEMORY XFC Memory Statistics --------------------- Pool allocation calls : 430 Pool allocation failures : 0 Pool deallocation calls : 0 Page allocation calls : 2745 Page deallocation calls : 6 Cache VA Regions and Limits --------------------------- Cache VA region from FFFFFFFD80000000 to FFFFFFFF80000000 ( 1048576 pages) permanent area : FFFFFFFD80000000 to FFFFFFFDBE800000 ( 128000 pages) pool : FFFFFFFD80000000 to FFFFFFFD83200000 ( 6400 pages) data : FFFFFFFD83200000 to FFFFFFFDBE800000 ( 121600 pages) dynamic area : FFFFFFFDBE800000 to FFFFFFFF7F780000 ( 919488 pages) pool : FFFFFFFDBE800000 to FFFFFFFDD4F2C000 ( 45974 pages) data : FFFFFFFDD4F2C000 to FFFFFFFF7F780000 ( 873514 pages) extent hash table: FFFFFFFF7F780000 to FFFFFFFF7FF80000 ( 1024 pages) file hash table : FFFFFFFF7FF80000 to FFFFFFFF80000000 ( 64 pages) file hash table : FFFFFFFF7FF80000 to FFFFFFFF80000000 ( 64 pages) qhdPermanentPoolFreePages : FFFFFFFF80D305B8 qhdPermanentDataFreePages : FFFFFFFF80D305C8 Non-Paged Pool allocated : 45248 (44.1 KB) Non-Paged Pool number of - FKBs : 403 Non-Paged Pool number of - DBMs : 3 Non-Paged Pool number of - CTXs : 10 Current Maximum Cache Size : 8589934592 (8.0 GB) Boottime Maximum Cache Size : -1 Permanent Data Pages: Allocated : 121600 In use : 2739 Pool Pages: Allocated : 6400 In use : 128 Dynamic Pages: Max Allowed : 919488 Allocated : 0 In use : 0 Min Allowed : 20971 Data Pages: Allowed : 873514 In use : 0 Pool Pages: Allowed : 45974 In use : 0 PFN List : 0 Non PFN List : 0 Total Cache Memory (bytes) : 1048621248 (1000.0 MB) Private PFN List Stats ---------------------- Dynamic Area PFN List : FFFFFFFF818EB340 Free physical pages on list : 0 Pages attributed to this list : 0 Pages being requested for return: 0 List priority : 0 Callback routine : 80DF8A40 Free PFN queue head : FFFFFFFF818EB350 First free page : 0000000000000000 Last free page : 0000000000000000 MMG Callback Counters --------------------- MMG callback active : 0 MMG callback count : 0 MMG callback requeues : 0 MMG callback requeue again : 0 Expand attempts callback active : 0 Pages reclaimed : 0 Trim reclaim attempts : 0 LRU depose calls TrimWorkingSet : 0 Zone Purges: Permanent : 0 Dynamic PFNLST : 0 Dynamic No PFNLST : 0 Pool Zone Stats (S2 Space) Permanent Dynamic SECB: Size 112, PerPage 71 Pages / MaxPages 12 / 6400 ||| 0 / 45974 FreePkts / TotalPkts 64 / 852 ||| 0 / 0 Hits 5499 ||| 0 Not first page 0 ||| 0 Misses (expns/fails) 12 ( 12 /0) ||| 0 ( 0 / 0) PECB: Size 176, PerPage 45 Pages / MaxPages 85 / 6400 ||| 0 / 45974 FreePkts / TotalPkts 6 / 3825 ||| 0 / 0 Hits 3740 ||| 0 Not first page 0 ||| 0 Misses (expns/fails) 85 ( 85 /0) ||| 0 ( 0 / 0) CFB: Size 544, PerPage 14 Pages / MaxPages 29 / 6400 ||| 0 / 45974 FreePkts / TotalPkts 3 / 406 ||| 0 / 0 Hits 488 ||| 0 Not first page 0 ||| 0 Misses (expns/fails) 29 ( 29 /0) ||| 0 ( 0 / 0) CVB: Size 608, PerPage 13 Pages / MaxPages 2 / 6400 ||| 0 / 45974 FreePkts / TotalPkts 12 / 26 ||| 0 / 0 Hits 12 ||| 0 Not first page 0 ||| 0 Misses (expns/fails) 2 ( 2 /0) ||| 0 ( 0 / 0) IOSIZE: Size 3120, PerPage 2 Pages / MaxPages 0 / 6400 ||| 0 / 45974 FreePkts / TotalPkts 0 / 0 ||| 0 / 0 Hits 0 ||| 0 Not first page 0 ||| 0 Misses (expns/fails) 0 ( 0 /0) ||| 0 ( 0 / 0)This example shows the full output from this command.
SDA> XFC SHOW MEMORY/BRIEF XFC Memory Summary ------------------ Current Maximum Cache Size : 8589934592 (8.0 GB) Boottime Maximum Cache Size : -1 Permanent Data Pages: Allocated : 121600 In use : 2739 Pool Pages: Allocated : 6400 In use : 128 Dynamic Pages: Max Allowed : 919488 Allocated : 0 In use : 0 Min Allowed : 20971 Data Pages: Allowed : 873514 In use : 0 Pool Pages: Allowed : 45974 In use : 0 PFN List : 0 Non PFN List : 0 Total Cache Memory (bytes) : 1048621248 (1000.0 MB)This example shows the brief output from this command.
XFC SHOW SUMMARY
XFC SHOW SUMMARY — Displays general information about the Extended File Cache.
Format
XFC SHOW SUMMARY [/STATISTICS] Parameters
None.
Qualifier
- /STATISTICS
Displays read and write activity arranged by I/O size, in addition to the default information.
Example
SDA> XFC SHOW SUMMARY
XFC Summary
-----------
Extended File Cache V1.0 Let unk I/Os through (Apr 18 2002 15:01:16)
Anchor Block Address: FFFFFFFF80D30210
Build Id:
Cache State: 0000A010
Cache in no-cache state: False
MaxAllowedCacheMode: eNodeFullXFC
Minimum cache size in Pages: 0001F400 ( 128000)
General
-------
Extent Hash Table Address: FFFFFFFF7F780000
Extent Hash Table Buckets: 524287
File Hash Table Address: FFFFFFFF7FF80000
File Hash Table Buckets: 32767
Count of private CTXs: 10
Count of private FKBs: 403
Count of private DIOBMs: 3
LRU
---
LRU Priority 0 Queue Address: FFFFFFFF80D30288
Queue Length: 00000446 ( 1094)
LRU Priority 1 Queue Address: FFFFFFFF80D30298
Queue Length: 00000AA5 ( 2725)
qhdContexts Address FFFFFFFF80D302B0
qhdIRPs Address FFFFFFFF80D302C0
Spinlock
--------
Cache Spinlock: 8125E780
Last Acquiring Module: ROOT$:[XFC.TMPSRC]XFC_SYS.C;4
Acquiring Line: 2887
Acquiring IPL: 0
Cache Tracing
-------------
Number of trace entries: 10000
Size of trace buffer: 800000
Current trace level: 4
Lost trace entrys: 0
Current trace sequence number: 318768
System Wide I/O Statistics since last reset
-------------------------------------------
Time of Last System-Wide Reset: 19-APR-2002 07:10:23.43
Total cache calls: 4505
Total cache calls: 4505
- Sum of Paging I/Os: 2493
- and other QIOs: 2012
- and NoCVB or PermNoCache QIOs: 0
Total Virtual Reads: 4197
Total Virtual Writes: 112
Total PageIOs not cached: 196
Total Logical I/Os: 0
Total Physical I/Os: 0
Total bypass write I/Os: 0
Synchronous I/O completions: 598
Physical I/O completions: 0
Total PID completion I/Os: 0
Total num IOs on reserved files: 1606
Total num IOs on global sections: 247
Count of stalls performed: 13
System Wide Read Percentage: 97.40 %
System Wide Cache Hit ratio: 57.90 %
System-Wide Read Statistics since last reset
--------------------------------------------
Virtual Reads: 4197
Sum of Read Around Count: 179
and Read Through Count: 4018
Reads Completed: 4197
Read Hits: 2495
Read Cache Hit Percentage: 59.45 %
Total Synch Completion Count: 598
Read Around due to Het. Cluster: 0
Read Around due to Modifiers: 0
Read Around due to Size: 16
Total reads past EOF: 1
Total I/Os with read-ahead: 239
Read Hits due to read-ahead: 307
Paging I/Os: 2493
System-Wide Write Statistics since last reset
---------------------------------------------
Virtual Writes: 112
Sum of Write Around Count: 0
and Write Through Count: 112
Write Around due to Het. Cluster: 0
Writes Completed: 112
Write Around due to Modifiers: 0
Write Around due to Size: 0
Total writes past EOF: 0
File/Volume Statistics
----------------------
Open Files: 239
Closed Files in the Cache: 164
Number of files truncated: 3
Volumes in Full XFC Mode: 0
Volumes in VIOC Compatible Mode: 13
Volumes in No Caching Mode: 1
Volumes in Perm. No Caching Mode: 0
Volume Queue: FFFFFFFF80D30238
File/Volume Statistics
----------------------
FAL locks currently held: 370
FAL locks chosen to skip: 0
FAL locks acquired since boot: 374
FAL locks released since boot: 4
FAL locks converted: 55
I/Os that have stalled for FAL 0
CACHE$ACCESS stalls for CFB 0
ulStallOpQStalls 1
Read-thro->Read-around conv. 0
Writes converted to write-around 0
ulLockResourceExhaustionRetries: 0
ulFALLocksEverInContention: 3
ulFALUpConversionRequests: 3
ulFALLocksConvertedToPR: 0
ulFALLocksConvertedToNL: 0
FAL BlkASTs received: 1
FAL BlkASTs ignored: 0
ECBs Split Right: 2229
ECBs Split Left: 1710
ECBs Split Three Ways: 786
ECBs Requiring no splits: 5802
Volume Lock Statistics
----------------------
VIL Blocking ASTs received 0
VIL Blocking ASTs stalled 0
VIL Blocking ASTs started 0
VIL Blocking ASTs completed 0
VIL Up-conversion requests made 0
VIL Up-conversion grants 0
VCML Blocking ASTs received 0
VCML Blocking ASTs stalled 0
VCML Blocking ASTs started 0
VCML Blocking ASTs completed 0
VCML Up-conversion requests made 0
VCML Up-conversion grants 0
Stalls on VCML up-conversion 0
Restarts on VCML up-conversion 0
Quiesce and Depose Statistics
-----------------------------
Quiesce and Depose files Stalled: 0
File Quiesce and Deposes Started: 114
File Quiesce and Deposes Cmpltd: 114
File Quiesce and Deposes Cmpltd: 114
Q&D CTX used count: 0
Q&D CTX in use: False
Most recent Depose time 0.0005 msec.
Most recent Depose ECB count 0
Maximum Depose time 0.1125 msec.
Maximum ECBs deposed 3
Total Depose time 0.0002 seconds
Total ECBs deposed 6
Pending Lock Up-conversion Statistics
-------------------------------------
Up-conversions stalled: 0
Up-conversions started: 0This example shows the output of detailed statistics and status for the cache.
XFC SHOW TABLES
XFC SHOW TABLES — Displays both the extent hash table (EHT) and the file hash table (FHT).
Format
XFC SHOW TABLES [/ALL] [/EXTENT] [/FILE] [/SUMMARY] Parameters
None.
Qualifiers
- /ALL
Displays the contents of the extent hash table (EHT) and file hash table (FHT). This is the default.
- /EXTENT
Displays only the contents of the EHT.
- /FILE
Displays only the contents of the FHT.
- /SUMMARY
Displays summary information about EHT and FHT.
Description
The XFC SHOW TABLES command outputs information about the
two hash tables used by XFC to locate key data structures.
Example
SDA> XFC SHOW TABLES/SUMMARY Full Map of CFB HashTable ------------------------- FHT: Contents of 32768 buckets 0(32366) 1(401) 2(1) Total number of CFBs: 403 Longest chain length: 2 Shortest chain length: 0 Shortest chain length: 0 Average chain length: 0.01 Full Map of PECB HashTable -------------------------- EHT: verifying 524288 buckets 0(520501) 1(3755) 2(32) Total number of PECBs: 3819 Longest chain length: 2 Shortest chain length: 0 Average chain length: 0.01
This example shows summary output about each of the hash tables.
XFC SHOW TRACE
XFC SHOW TRACE — Displays all or selected portions of the XFC trace buffer, starting with the most recent entry and moving backward in time.
Format
XFC SHOW TRACE [/ALL|LABEL=string]
[/CPU=cpu-num]
[/LINENUMBER=linenumber]
[/MATCH[=AND|OR]] [/Px=value]
[/RAW] Parameters
None.
Qualifiers
- /ALL
Displays the entire trace buffer. This is the default.
- /CPU=cpu-num
Displays only records from threads executing on CPU cpu-num.
- /LABEL=string
Displays only records for which the label field contains string.
- /LINENUMBER=linenumber
Displays only records from tracepoints at line linenumber in the relevant source files.
- /MATCH[=AND|OR]
Alters the sense of the match condition when multiple of the filter qualifiers (
/CPU,/FILENAME,/LABEL,/LINENUMBER, or/Px) are specified.- /Px=value
Displays only records where the specified traced parameter (P1, P2, P3, or P4) is equal to value.
- /RAW
Displays contents of trace records in hexadecimal format without interpretation. By default, the values are displayed in human-readable format with file names.
Description
The XFC SHOW TRACE command outputs the contents of each
entry in the XFC trace buffer. Currently, detailed XFC tracing is enabled only
for debug versions of XFC.
Example
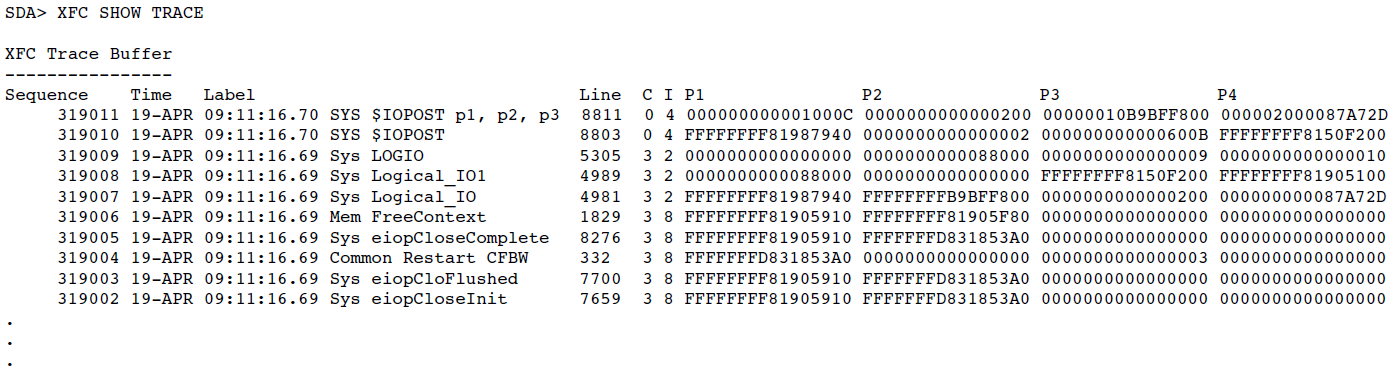 |
This example shows the output of XFC trace information.
XFC SHOW VOLUME
XFC SHOW VOLUME — Displays the contents of a cache volume block (CVB).
Format
XFC SHOW VOLUME [address] [/BRIEF|/FULL]
[/STATISTICS|/NAME=DISK$volume-label] Parameter
address The address of a CVB. If no address is supplied, then all volumes are displayed.
Qualifiers
- /BRIEF
Displays summary information for each volume.
- /FULL
Displays a complete list of information about each volume. This is the default.
- /NAME=DISK$volume-label
Displays information for the volume with the specified name.
- /STATISTICS
Displays the read and write I/O activity for this volume. The
/STATISTICSqualifier is incompatible with the/BRIEFqualifier.
Description
The XFC SHOW VOLUME command shows state information and
statistics about all volumes mounted on the system.
Examples
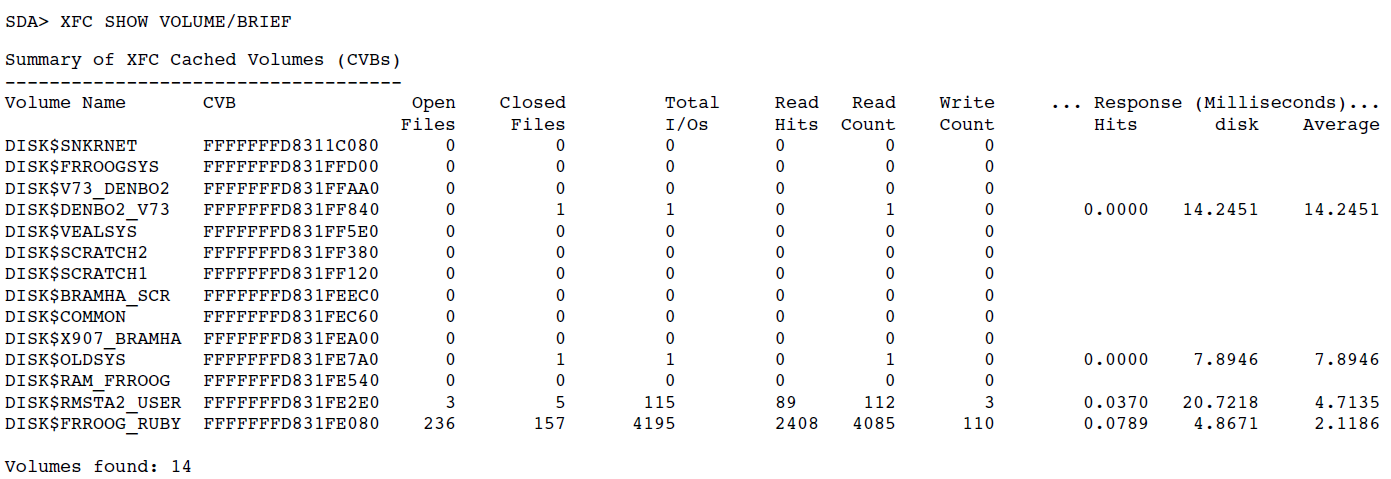
The above example shows the output derived from invoking the
/BRIEFqualifier.SDA> XFC SHOW VOLUME FFFFFFFD831FE080 Cache Volume Block (CVB) ------------------------ Statistics Valid From: 19-APR-2002 07:10:23.54 Name: DISK$FRROOG_RUBY CVB Address: FFFFFFFD831FE080 Flink: FFFFFFFF80D30238 Blink: FFFFFFFD831FE300 Volume (VCB): FFFFFFFF81905100 Unit (UCB): FFFFFFFF8150F200 Files Queue: FFFFFFFD831FE0C0 Flink: FFFFFFFD83111800 Blink: FFFFFFFD831FC0A0 Cached Open Files: 236 Cached Closed Files: 157 Files Ever Opened: 502 Files Ever Deposed: 109 Pages Allocated: 2726 Total QIOs: 4195 Read Hit Count: 2408 Virtual Read Count: 4085 Virtual Write Count: 110 Read Percentage: 97 % Hit Rate: 57 % Average Overall I/O response time to this Volume in milliseconds: 2.1186 Average Cache Hit I/O response time to this Volume in milliseconds: 0.0789 Average Disk I/O response time to this Volume in milliseconds: 4.8671 Accuracy of I/O resp time: 83 % Readahead Count: 233 Volume Caching Mode: evcmVIOCCompatible Mounted /NOCACHE: False VCML Allows Caching: True Quiescing: False Quiesce in Progress: False No Cache from Logio: False VIL Blk AST Stall: False Flush Pending: False VCML Blk AST Stall: False VCML Blk CTX Stall: False VIL Blk CTX Stall: False Dismount Stall: False Logio Stall: False Flush in Progress: False Cluster Trans Stall: False Dismount Pending: False VIL Up Needed: False Tqe In Use: False VCML Up Needed: False VIL blocking AST CTX: 0000000000000000 VCML blocking AST CTX: 0000000000000000 Dismount Stall CTX: 0000000000000000 LogIO Stall CTX: 0000000000000000 Up conversion CTX: 0000000000000000 VIL lock id: 0100007A VIL LogIO lock id: 00000000 VCML lock id: 010000FF VCML LogIO lock id: 00000000 Logical IO safety: elogioNotSafe LogIOMutex: 00000000818EB610 Last LogIO time: 00000000 Active I/O count: 0 Stalled Ops Queue: FFFFFFFD831FE0B0 Flink: FFFFFFFD831FE0B0 Blink: FFFFFFFD831FE0B0 Volumes found: 1This example shows the output for a specific cache volume block.
Chapter 10. SDA Extensions and Callable Routines
This chapter describes how to write, debug, and invoke an SDA Extension. This chapter also describes the routines available to an SDA Extension.
10.1. Introduction
When analysis of a dump file or a running system requires intimate knowledge of data structures that are not known to the System Dump Analyzer, the functionality of SDA can be extended by the addition of new commands into which the necessary knowledge has been built. Note that in this description, whenever a reference is made to accessing a dump file (ANALYZE/CRASH_DUMP), this also includes accessing memory in the running system (ANALYZE/SYSTEM).
For example, a user-written device driver allocates nonpaged pool and records additional data about the device there (logging different types of I/O, perhaps), and a pointer to the new structure is saved in the device-specific extension of the UCB. After a system crash, the only way to look at the data from SDA is to do the following:
Invoke the SDA command DEFINE to define a new symbol (for example, UCB$L_FOOBAR) whose value is the offset in the UCB of the pointer to the new structure.
Invoke the SDA commands "SHOW DEVICE <device>" and "FORMAT UCB" to obtain the address of the nonpaged pool structure.
Invoke the SDA command "EXAMINE <address>;<length>" to display the contents of the data in the new nonpaged pool structure as a series of hexadecimal longwords.
Decode manually the contents of the data structure from this hexadecimal dump.
An SDA extension that knows the layout of the nonpaged pool structure, and where to find the pointer to it in the UCB, could output the data in a formatted display that alerts the user to unexpected data patterns.
10.2. Description
The following discussion uses an example of an SDA extension that invokes the MBX command to output a formatted display of the status of the mailbox devices in the system. The source file, MBX$SDA.C, is provided in SYS$EXAMPLES.
An SDA extension consists of a shareable image, in this case MBX$SDA.EXE, either located in the directory SYS$LIBRARY or found by translating the logical name MBX$SDA. It contains two universal symbols: SDA$EXTEND, the entry point; and SDA$EXTEND_VERSION, the address of a longword that contains the version of the interface used (in the format of major/minor ident), which allows SDA to confirm it has activated a compatible extension. The image contains at least two modules: MBX$SDA, the user-written module that defines the two symbols and provides the code and data necessary to produce the desired formatted output; and SDA_EXTEND_VECTOR, which provides jackets for all of the callable SDA routines, and is found in SYS$LIBRARY:VMS$VOLATILE_PRIVATE_INTERFACES.OLB. The user-written portion can be split into multiple modules.
Whenever SDA receives an unrecognized command, like "SDA> MBX", it attempts to activate the shareable image MBX$SDA at the SDA$EXTEND entry point. If you choose a command name that matches the abbreviation of an existing command, SDA can be forced to activate the extension using the "DO" command. For example, if you had an SDA extension called VAL$SDA, you could not activate it with a command like "SDA> VAL" as SDA would interpret that as an abbreviation of its VALIDATE command. But VAL$SDA can be activated by issuing "SDA> DO VAL".
With or without the "DO" prefix, the rest of the command line is passed to the extension; it is up to the extension to parse it. The example extension MBX$SDA includes support for commands of the form "SDA> MBX SUMMARY" and "SDA> MBX <address>" to demonstrate this. If the extension is invoked with no arguments, it should do no more than display a simple announcement message, or prompt for input. This assists in the debugging of the extension, as described in Section 10.3, ''Debugging an Extension''.
Section 10.2.1, ''Compiling and Linking an SDA Extension'' describes how to compile, link, and invoke an SDA extension, and describes what an SDA extension should contain.
10.2.1. Compiling and Linking an SDA Extension
The user-written module is only supported when written in HP C (minimum Version 5.2), following the pattern of the example extension, MBX$SDA.C. It should be compiled and linked using commands of the following form:
$cc mbx$sda + sys$library:sys$lib_c /library
$link /share -
mbx$sda.obj, -
sys$library:vms$volatile_private_interfaces /library, -
sys$input /option
symbol_vector = (sda$extend=procedure)
symbol_vector = (sda$extend_version=data)Note
You can include the qualifier /INSTRUCTION=NOFLOAT on the compile command line if floating-point instructions are not needed.
The + SYS$LIBRARY:SYS$LIB_C /LIBRARY is not needed on the compile command line if the logical name DECC$TEXT_LIBRARY is defined and translates to SYS$LIBRARY:SYS$LIB_C.TLB.
If the user-written extension needs to signal SDA condition codes, or output their text with $PUTMSG, you should add the qualifier /INCLUDE=SDAMSG to the parameter SYS$LIBRARY:VMS$VOLATILE_PRIVATE_INTERFACES /LIBRARY.
10.2.2. Invoking an SDA Extension
You can invoke the SDA extension as follows:
$define mbx$sda sys$disk:[]mbx$sda $analyze /system SDA>mbx summary SDA>mbx <address>
10.2.3. Contents of an SDA Extension
At a minimum, the user-written module must contain:
#include statements for DESCRIP.H and SDA_ROUTINES.H
The global variable SDA$EXTEND_VERSION, initialized as follows:
int sda$extend_version = SDA_FLAGS$K_VERSION;
The routine SDA$EXTEND (prototype follows)
Optionally, the user-written module may also contain the statement:
#define __NEW_STARLET
You should use this option because it provides type checking of function arguments and gives consistency in casing and naming conventions.
The entry point in the user-written module, SDA$EXTEND, is called as a routine with three arguments and no return value. The declaration is as follows:
void sda$extend (
int *transfer_table,
struct dsc$descriptor_s *cmd_line,
SDA_FLAGS sda_flags)The arguments in this code example have the following meanings:
| Line of Code | Meaning | |
|---|---|---|
| transfer_table | Address of the vector table in the base image. The user-written routine SDA$EXTEND must copy this to SDA$VECTOR_TABLE (declared in SDA_ROUTINES.H) before any SDA routines can be called. | |
| cmd_line | Address of the descriptor of the command line as entered by the user, less the name of the extension. So, if you enter "SDA> MBX" or "SDA> DO MBX", the command line is a zero length string. If you enter the command "SDA> MBX 80102030", the command line is " 80102030" (the separating space is not stripped). | |
| sda_flags |
Definition for the following four bits in this structure: | |
| Bit | Meaning | |
| sda_flags.sda_flags$v_override | Indicates SDA has been activated with the ANALYZE/CRASH_DUMP/OVERRIDE command | |
| sda_flags.sda_flags$v_current | Indicates SDA has been activated with the ANALYZE/SYSTEM command or was invoked from the kept debugger during an SCD session | |
| sda_flags.sda_flags$v_target | Indicates that SDA was invoked from the kept debugger during an SCD or SDD session or when analyzing a process dump | |
| sda_flags.sda_flags$v_process | Indicates SDA was activated with the ANALYZE/CRASH_DUMP command to analyze a process dump | |
| sda_flags.sda_flags$v_ia64 | Indicates that SDA is analyzing an IA-64 system or dump | |
| None of the above bits set | Indicates SDA was activated with the ANALYZE/CRASH_DUMP command to analyze an Alpha system dump | |
| Other bits | Reserved by VSI. May be nonzero | |
The first executable statement of the routine must be to copy TRANSFER_TABLE to SDA$VECTOR_TABLE (which is declared in SDA_ROUTINES.H):
sda$vector_table = transfer_table;
If this is not done, you cannot call any of the routines described below. Any attempts to call the routines receive a status return of SDA$_VECNOTINIT. (For routines defined not to return a status, this value can be found only by examining the return value directly.)
The next statement should be one to establish a condition handler, as it is often difficult to track down errors in extensions such as access violations because the extension is activated dynamically with LIB$FIND_IMAGE_SYMBOL. A default condition handler, SDA$COND_HANDLER, is provided that outputs the following information in the event of an error:
The error condition
The VMS version
A list of activated images, with start and end virtual addresses
The signal array and register dump
The current call frame chain
You can establish this condition handler as follows:
lib$establish (sda$cond_handler);Note
The error condition, signal array, and register dump are output directly to SYS$OUTPUT and/or SYS$ERROR, and are not affected by the use of the SDA commands SET OUTPUT and SET LOG.
Thus, a minimal extension would be:
#define __NEW_STARLET 1
#include <descrip.h>
#include <sda_routines.h>
int sda$extend_version = SDA_FLAGS$K_VERSION;
void sda$extend (int *transfer_table,
struct dsc$descriptor_s *cmd_line,
SDA_FLAGS sda_flags)
{
sda$vector_table = transfer_table;
lib$establish (sda$cond_handler);
sda$print ("hello, world");
return;
}10.3. Debugging an Extension
In addition to the "after-the-fact" information provided by the condition handler, you can debug SDA extensions using the OpenVMS Debugger. A second copy of the SDA image, SDA_DEBUG.EXE, is provided in SYS$SYSTEM. By defining the logical name SDA to reference this image, you can debug SDA extensions as follows:
Compile your extension /DEBUG/NOOPT and link it /DEBUG or /DSF.
Define logical names for SDA and the extension, and invoke SDA.
Type SET BREAK START_EXTENSION at the initial DBG> prompt, and then type GO.
Invoke the extension at the SDA> prompt.
When Debug prompts again, use Debug commands to set breakpoints, and so on, in the extension and then type GO.
Invoke the extension, providing the necessary arguments.
An example of the preceding steps is as follows:
$ cc /debug /noopt mbx$sda + sys$library:sys$lib_c /library
$ link /debug /share -
mbx$sda.obj, -
sys$library:vms$volatile_private_interfaces /library, -
sys$input /option
symbol_vector = (sda$extend=procedure)
symbol_vector = (sda$extend_version=data)
$ !
$ define mbx$sda sys$disk:[]mbx$sda
$ define sda sda_debug
$ analyze /system
...
DBG> set break start_extension
DBG> go
...
SDA> mbx
break at routine START\START_EXTENSION
...
DBG> set image mbx$sda
DBG> set language c
DBG> set break /exception
DBG> go
MBX commands: 'MBX SUMMARY' and 'MBX <address>'
SDA> mbx summary
...
SDA> mbx <address>
...
%DEBUG-I-DYNMODSET, setting module MBX$SDA
%SYSTEM-E-INVARG, invalid argument
...
DBG>10.4. Callable Routines Overview
The user-written routine may call SDA routines to accomplish any of the following tasks:
Read the contents of memory locations in the dump.
Translate symbol names to values and vice-versa, define new symbols, and read symbol table files.
Map an address to the activated image or executive image that contains that address.
Output text to the terminal, with page breaks, page headings, and so on (or output to a file if the SDA commands SET OUTPUT or SET LOG have been used).
Allocate and deallocate dynamic memory.
Validate queues/lists.
Format data structures.
Issue any SDA command.
Note the following points before using the callable routines described here:
The following three routines are used to read the contents of memory locations in the dump:
SDA$TRYMEM is called from both SDA$GETMEM and SDA$REQMEM as the lower-level routine that actually does the work. SDA$TRYMEM returns success/failure status in R0, but does not signal any errors. Use it directly when you expect that the location being read might be inaccessible. The caller of SDA$TRYMEM handles this situation by checking the status returned by SDA$TRYMEM.
SDA$GETMEM signals a warning when any error status is returned from SDA$TRYMEM. Signaling a warning prints out a warning message, but does not abort the SDA command in progress. You should use this routine when you expect the location to be read to be accessible. This routine does not prevent the command currently being executed from continuing. The caller of SDA$GETMEM must allow for this by checking the status returned by SDA$GETMEM.
SDA$REQMEM signals an error when any error status is returned from SDA$TRYMEM. Signaling an error prints out an error message, aborts the SDA command in progress, and returns to the "SDA>" prompt. You should use this routine when you expect the location to be read to be accessible. This routine prevents the command currently being executed from continuing. The caller of SDA$REQMEM does not resume if an error occurs.
You should use only the routines provided to output text. Do not use printf() or any other standard routine. If you do, the SDA commands SET OUTPUT and SET LOG will not produce the expected results. Do not include control characters in output (except tab); in particular, avoid <CR>, <LF>,<FF>, and the FAO directives that create them. Use the FAO directive !AF when contents of memory returned by SDA$TRYMEM, and so on, are being displayed directly, because embedded control characters will cause undesirable results. For example, displaying process names or resource names that contain particular control characters or escape sequences can lock up the terminal.
You should use only the routines provided to allocate and deallocate dynamic memory. Do not use malloc() and free(). Where possible, allocate dynamic memory once, the first time the extension is activated, and deallocate it only if it needs to be replaced by a larger allocation. Because SDA commands can be interrupted by invoking another command at the "Press return for more" prompt, it is very easy to cause memory leaks.
Some routines expect 32-bit pointers, and others expect 64-bit pointers. At first this not may appear to be logical, but in fact it is. All code and data used by SDA and any extensions must be in P0 or P1 space, as SDA does not need to (and does not) use P2 space for local data storage. However, addresses in the system dump (or running system, in the case of ANALYZE/SYSTEM) are 64-bit addresses, and SDA must provide access to all locations in the dump.
So, for example, the first two arguments to the routine SDA$TRYMEM are:VOID_PQ start /* 64-bit pointer */void *dest /* 32-bit pointer */
They specify the address of interest in the dump and the address in local storage to which the dump contents are to be copied.Common Bitmask Block (CBB) routines, SDA$CBB_xxx, are designed for use with local copies of the CBB structures that describe the CPUs in use in a system. The CBB structures are assumed to be at least CBB$K_STATIC_BLOCK bytes in length. The definitions of the various CBB constants and field names used by these routines can be found in CBBDEF.H in SYS$LIBRARY:SYS$LIB_C.TLB.
The set of routines is not intended to be an exhaustive set of all possible CBB-related operations, but it provides those operations known to be needed. The routines might not work as expected with CBB structures that are set up for any purpose other than to describe CPUs.
10.5. Routines
The following sections describe the SDA extension callable routines.
10.5.1. SDA$ADD_SYMBOL
Adds a symbol to SDA's local symbol table.
Format
void sda$add_symbol (char *symbol_name, uint64
symbol_value);
Arguments
symbol_name
| OpenVMS usage | char_string |
| type | character string |
| access | read only |
| mechanism | by reference |
Address of symbol name string (zero-terminated).
symbol_value
| OpenVMS usage | quadword_unsigned |
| type | quadword (unsigned) |
| access | read only |
| mechanism | by value |
The symbol value.
Description
SDA maintains a list of symbols and the corresponding values. SDA$ADD_SYMBOL is used to insert additional symbols into this list, so that they can be used in expressions and during symbolization.
Condition Values Returned
None.
Example
sda$add_symbol ("MBX", 0xFFFFFFFF80102030);This call defines the symbol MBX to the hexadecimal valueFFFFFFFF80102030.
10.5.2. SDA$ALLOCATE
Allocates dynamic memory.
Format
void sda$allocate (uint32 size, void **ptr_block);
Arguments
size
| OpenVMS usage | longword_unsigned |
| type | longword (unsigned) |
| access | read only |
| mechanism | by value |
Size of block to allocate (in bytes).
ptr_block
| OpenVMS usage | address |
| type | longword (unsigned) |
| access | write only |
| mechanism | by reference |
Address of longword to receive address of block.
Description
The requested memory is allocated and the address returned. Note that this is the only supported mechanism for allocation of dynamic memory.
Related Routine
SDA$DEALLOCATE
Condition Values Returned
None.
If no memory is available, the error is signaled and the SDA session aborted.
Example
PCB *local_pcb; ... sda$allocate (PCB$C_LENGTH, (void *)&local_pcb);
This call allocates a block of heap storage for a copy of a PCB, andstores its address in the pointer LOCAL_PCB.
10.5.3. SDA$CBB_BOOLEAN_OPER
Performs a Boolean operation on a pair of CBBs.
Format
int sda$cbb_boolean_oper (CBB_PQ input_cbb, CBB_PQ output_cbb, int
operation);
Arguments
input_cbb
| OpenVMS usage | address |
| type | CBB structure |
| access | read only |
| mechanism | by reference |
The address of the first (input) CBB structure.
output_cbb
| OpenVMS usage | address |
| type | CBB structure |
| access | read/write |
| mechanism | by reference |
The address of the second (output) CBB structure.
operation
| OpenVMS usage | longword |
| type | longword (unsigned) |
| access | read only |
| mechanism | by value |
The desired operation from the following list:
| CBB$C_OR | The logical sum of the two CBBs is performed and the result (B = A | B) is written to the output CBB. |
| CBB$C_BIC | The logical product with complement of the two CBBs is performed and the result (B = B & ~A) is written to the output CBB. |
Description
The desired Boolean operation is performed on the two CBB structures, and the result is written to the second (output) structure.
Condition Values Returned
| SS$_BADPARAM | The number of valid bits in the input and output CBBs is different. |
| SS$_WASCLR | All bits in the resulting output CBB are clear. |
| SS$_WASSET | At least one bit in the resulting output CBB is set. |
Example
int status;
extern CBB active_set,
configure_set;
CBB inactive_set;
sda$cbb_copy (&configure_set, &inactive_set);
status = sda$cbb_boolean_oper (&active_set, &inactive_set, CBB$C_BIC);
if (status == SS$_WASSET)
sda$print ("There are inactive CPUs in the system");This example shows how the set of active CPUs and the set of configured CPUs can be manipulated to create a set of inactive CPUs.
10.5.4. SDA$CBB_CLEAR_BIT
Clears the specified bit in a CBB.
Format
int sda$cbb_clear_bit (CBB_PQ cbb, int bit);
Arguments
cbb
| OpenVMS usage | address |
| type | CBB structure |
| access | read/write |
| mechanism | by reference |
The address of the CBB structure to be modified.
bit
| OpenVMS usage | longword |
| type | longword (unsigned) |
| access | read only |
| mechanism | by value |
The bit in the CBB to be cleared. If the bit number is -1, clears all bits.
Description
The specified bit (or all bits) in the CBB is cleared.
Condition Values Returned
| SS$NORMAL | Successful completion |
| SS$BADPARAM | The bit number is out of range |
Example
int status;
extern int next;
extern CBB active_set;
status = sda$cbb_clear_bit (&active_set, next);
if (!(status & 1))
sda$print ("Bad CPU specified: !XL", next);This example shows how a bit in a CBB is cleared.
10.5.5. SDA$CBB_COPY
Copies the contents of one CBB to another.
Format
int sda$cbb_copy (CBB_PQ input_cbb, CBB_PQ output_cbb);
Arguments
input_cbb
| OpenVMS usage | address |
| type | CBB structure |
| access | read only |
| mechanism | by reference |
The address of the CBB structure to be copied.
output_cbb
| OpenVMS usage | address |
| type | CBB structure |
| access | write only |
| mechanism | by reference |
The address of the CBB structure to receive the copy.
Description
The specified CBB is copied.
Condition Values Returned
None.
10.5.6. SDA$CBB_FFC
Locates the first clear bit in a CBB.
Format
int sda$cbb_ffc (CBB_PQ cbb, int start_bit);
Arguments
cbb
| OpenVMS usage | address |
| type | CBB structure |
| access | read only |
| mechanism | by reference |
The address of the CBB structure to be searched.
start_bit
| OpenVMS usage | longword |
| type | longword (unsigned) |
| access | read only |
| mechanism | by value |
The first bit in the CBB to be checked.
Description
The CBB structure is searched, starting at the specified bit, for a clear bit.
Condition Values Returned
| bit_number | If a clear bit is found, its bit number is returned. If no clear bit is found (all bits from start_bit to cbb->cbb$l_valid_bits are set), then the number of valid bits is returned. |
Example
int bit;
extern int start;
extern CBB active_set;
bit = sda$cbb_ffc (&active_set, start);
if (bit >= active_set.cbb$l_valid_bits)
sda$print ("No clear bits in active set");
else
sda$print ("First clear bit in active set = !XL", bit);This example shows how the next clear bit in a CBB can be located.
10.5.7. SDA$CBB_FFS
Locates the first set bit in a CBB.
Format
int sda$cbb_ffs (CBB_PQ cbb, int start_bit);
Arguments
cbb
| OpenVMS usage | address |
| type | CBB structure |
| access | read only |
| mechanism | by reference |
The address of the CBB structure to be searched.
start_bit
| OpenVMS usage | longword |
| type | longword (unsigned) |
| access | read only |
| mechanism | by value |
The first bit in the CBB to be checked.
Description
The CBB structure is searched for a set bit, starting at the specified bit.
Condition Values Returned
| bit_number | If a set bit is found, its bit number is returned. If no set bit is found (all bits from start_bit to cbb->cbb$l_valid_bits are clear), then the number of valid bits is returned. |
Example
int bit;
extern int start;
extern CBB active_set;
bit = sda$cbb_ffs (&active_set, start);
if (bit >= active_set.cbb$l_valid_bits)
sda$print ("No set bits in active set");
else
sda$print ("First set bit in active set = !XL", bit);This example shows how the next set bit in a CBB can be located.
10.5.8. SDA$CBB_INIT
Initializes a CBB structure to a known state.
Format
void sda$cbb_init (CBB_PQ cbb);
Arguments
cbb
| OpenVMS usage | address |
| type | CBB structure |
| access | read only |
| mechanism | by reference |
The address of the CBB structure to be initialized.
Description
The fields of the CBB that describe its layout are initialized as necessary for a CPU CBB. The actual bitmask is zeroed.
Condition Values Returned
None.
10.5.9. SDA$CBB_SET_BIT
Sets the specified bit in a CBB.
Format
int sda$cbb_set_bit (CBB_PQ cbb,int bit);
Arguments
cbb
| OpenVMS usage | address |
| type | CBB structure |
| access | read/write |
| mechanism | by reference |
The address of the CBB structure to be modified.
bit
| OpenVMS usage | longword |
| type | longword (unsigned) |
| access | read only |
| mechanism | by value |
The bit in the CBB to be set. If the bit number is -1, set all bits.
Description
The specified bit (or all bits) in the CBB is set.
Condition Values Returned
| SS$NORMAL | Successful completion. |
| SS$BADPARAM | The bit number is out of range. |
Example
int status;
extern int next;
extern CBB active_set;
status = sda$cbb_set_bit (&active_set, next);
if (!(status & 1))
sda$print ("Bad CPU specified: !XL", next);This example shows how a bit in a CBB is set.
10.5.10. SDA$CBB_TEST_BIT
Tests the specified bit in a CBB.
Format
int sda$cbb_test_bit (CBB_PQ cbb,int bit);
Arguments
cbb
| OpenVMS usage | address |
| type | CBB structure |
| access | read only |
| mechanism | by reference |
The address of the CBB structure to be tested.
bit
| OpenVMS usage | longword |
| type | longword (unsigned) |
| access | read only |
| mechanism | by value |
The bit in the CBB to be tested.
Description
The specified bit in the CBB is tested and its value returned.
Condition Values Returned
| SS$_WASSET | The specified bit was set. |
| SS$_WASCLR | The specified bit was clear. |
| SS$_BADPARAM | The bit number is out of range. |
Example
int status;
extern int next;
extern CBB active_set;
status = sda$cbb_test_bit (&active_set, next);
if (!(status & 1))
sda$print ("Bad CPU specified: !XL", next);
else if (status == SS$_WASSET)
sda$print ("CPU !XL was set", next);
else
sda$print ("CPU !XL was clear", next);This example shows how a bit in a CBB is tested.
10.5.11. SDA$DBG_IMAGE_INFO
Displays a list of activated images together with their virtual addressranges for debugging purposes.
Format
void sda$dbg_image_info ();
Arguments
None.
Description
A list of the images currently activated, with their start and endaddresses, is displayed. This is provided as a debugging aid for SDAextensions.
Condition Values Returned
None.
Example
sda$dbg_image_info ();
SDA outputs the list of images in the following format:
Current VMS Version: "X6DX-FT1"
Process Activated Images:
Start VA End VA Image Name
00010000 000301FF SDA
00032000 00177FFF SDA$SHARE
7B508000 7B58BFFF DECC$SHR
7B2D8000 7B399FFF DPML$SHR
7B288000 7B2C9FFF CMA$TIS_SHR
7B698000 7B6D9FFF LBRSHR
0021A000 0025A3FF SCRSHR
00178000 002187FF SMGSHR
7B1E8000 7B239FFF LIBRTL
7B248000 7B279FFF LIBOTS
80C140D0 80C23120 SYS$BASE_IMAGE
80C036B8 80C05288 SYS$PUBLIC_VECTORS
002C6000 002D31FF PRGDEVMSG
002D4000 002DA9FF SHRIMGMSG
002DC000 002DFFFF DECC$MSG
00380000 003E03FF MBX$SDA10.5.12. SDA$DEALLOCATE
Deallocates and frees dynamic memory.
Format
void sda$deallocate (void *ptr_block, uint32 size);
Arguments
ptr_block
| OpenVMS usage | address |
| type | longword (unsigned) |
| access | read only |
| mechanism | by value |
Starting address of block to be freed.
size
| OpenVMS usage | longword_unsigned |
| type | longword (unsigned) |
| access | read only |
| mechanism | by value |
Size of block to deallocate (in bytes).
Description
The specified memory is deallocated. Note that this is the only supported mechanism for deallocation of dynamic memory.
Related Routine
SDA$ALLOCATE
Condition Values Returned
None.
If an error occurs, it is signaled and the SDA session aborted.
Example
PCB *local_pcb; ... sda$deallocate ((void *)local_pcb, PCB$C_LENGTH;
This call deallocates the block of length PCB$C_LENGTH whose address isstored in the pointer LOCAL_PCB.
10.5.13. SDA$DELETE_PREFIX
Deletes all symbols with the specified prefix.
Format
void sda$delete_prefix (char *prefix);
Arguments
prefix
| OpenVMS usage | char_string |
| type | character string |
| access | read only |
| mechanism | by reference |
The address of the prefix string.
Description
This routine searches the SDA symbol table and deletes all symbols that begin with the specified string.
Condition Values Returned
None.
10.5.14. SDA$DISPLAY_HELP
Displays online help.
Format
void sda$display_help (char *library_desc, char
*topic_desc);
Arguments
library
| OpenVMS usage | char_string |
| type | character string |
| access | read only |
| mechanism | by reference |
Address of library filespec. Specify as zero-terminated ASCII string.
topic
| OpenVMS usage | char_string |
| type | character string |
| access | read only |
| mechanism | by reference |
Address of topic name. Specify as zero-terminated ASCII string.
Description
Help from the specified library is displayed on the given topic.
Condition Values Returned
None.
Example
sda$display_help ("SYS$HELP:SDA", "HELP");This call produces the following output at the terminal:
HELP
The System Dump Analyzer (SDA) allows you to inspect the contents
of memory as saved in the dump taken at crash time or as exists
in a running system. You can use SDA interactively or in batch
mode. You can send the output from SDA to a listing file. You can
use SDA to perform the following operations:
Assign a value to a symbol
Examine memory of any process
Format instructions and blocks of data
Display device data structures
Display memory management data structures
Display a summary of all processes on the system
Display the SDA symbol table
Copy the system dump file
Send output to a file or device
Read global symbols from any object module
Send output to a file or device
Read global symbols from any object module
Search memory for a given value
For help on performing these functions, use the HELP command and
specify a topic.
Format
HELP [topic-name]
Additional information available:
Parameter
HELP Subtopic?10.5.15. SDA$ENSURE
Ensures sufficient space on the current output page.
Format
void sda$ensure (uint32 lines);
Arguments
lines
| OpenVMS usage | longword_unsigned |
| type | longword (unsigned) |
| access | read only |
| mechanism | by value |
Number of lines to fit on a page.
Description
This routine checks and makes sure that the number of lines specifiedfit on the current page; otherwise, it issues a page break.
Condition Values Returned
None.
Example
sda$ensure (5);
This call ensures that there are five lines left on the current page,and it outputs a page break if there are not.
10.5.16. SDA$FAO
Formats data into a buffer.
Format
char * sda$fao (char * ctrstr, char * buffer, int
buflen,__optional_params);
Arguments
ctrstr
| OpenVMS usage | char_string |
| type | character-coded text string |
| access | read only |
| mechanism | by reference |
Address of a zero-terminated FAO control string.
buffer
| OpenVMS usage | char_string |
| type | character string |
| access | write only |
| mechanism | by reference |
Address of a string buffer into which to store the formatted string.
buflen
| OpenVMS usage | longword_unsigned |
| type | longword (unsigned) |
| access | read only |
| mechanism | by value |
Maximum size of the string buffer.
prmlst
| OpenVMS usage | varying_arg |
| type | quadword (signed or unsigned) |
| access | read only |
| mechanism | by value |
Optional FAO parameters. All arguments after buflen are copied into a quadword parameter list, as used by $FAOL_64.
Description
Formats data into a buffer as a zero-terminated string.
Condition Values Returned
| Address of terminating zero | SDA$FAO returns the address of the terminating zero in the output buffer. This allows successive calls to SDA$FAO to append strings. |
Example
char faobuf [16];
char *faoptr;
faoptr = sda$fao ( "!XL",
faobuf, sizeof (faobuf),
0xffffffff);
sda$fao ( ".!XL",
faoptr, sizeof (faobuf) - strlen (faobuf),
0x80102030);This example shows the use of SDA$FAO to append a formatted string to another formatted string.
10.5.17. SDA$FID_TO_NAME
Translates a file identification (FID) into the equivalent file name.
Format
int sda$fid_to_name (char *devptr, unsigned short *fidptr, char *bufptr,
int buflen );
Arguments
devptr
| OpenVMS usage | char_string |
| type | character string |
| access | read only |
| mechanism | by reference |
The address of the device name string. The device name must be supplied in allocation-class device name (ALLDEVNAM) format, but any leading underscore or trailing colon are ignored.
fidptr
| OpenVMS usage | address |
| type | file identification |
| access | read only |
| mechanism | by reference |
The address of the three-word file identification.
bufptr
| OpenVMS usage | char_string |
| type | character string |
| access | write only |
| mechanism | by reference |
The address of a string buffer into which to store the file name string.
buflen
| OpenVMS usage | longword |
| type | longword (unsigned) |
| access | read only |
| mechanism | by value |
The maximum length of the string buffer.
Description
When analyzing the current system, this routine calls LIB$FID_TO_NAME to translate the file identification into a file name. When analyzing a dump, if there is a file data collection available and the specified disk and file identification is included in the collection, the recorded file name will be returned. Return the error condition SDA$_NOCOLLECT if there is no collection (for the entire system, this disk, or just this file).
Condition Values Returned
| SDA$_SUCCESS | File identification successfully translated. |
| SDA$_NOCOLLECT | No collection available for the system, the specified disk, or the file identification. |
| Others | An error occurred when LIB$FID_TO_NAME was called. |
Example
int status;
char buffer [132];
char *device = $1$DKA0;
unsigned short fid [3] = {1, 1, 0};
status = sda$fid_to_name (device, &fid [0], buffer, 132);
if (status & 1)
sda$print ("Filename is !AZ", buffer);
else
sda$print ("File ID could not be translated");This example shows the translation of file ID (1,1,0) on $1$DKA0:, which is $1$DKA0:[000000]INDEXF.SYS;1.
10.5.18. SDA$FORMAT
Displays the formatted contents of a data structure.
Format
void sda$format (VOID_PQ struct_addr,
__optional_params);
Arguments
struct_addr
| OpenVMS usage | address |
| type | quadword (unsigned) |
| access | read only |
| mechanism | by value |
The address in the system dump of the data structure to be formatted.
options
| OpenVMS usage | mask_longword |
| type | longword (unsigned) |
| access | read only |
| mechanism | by value |
The following provides more information on options:
| Option | Meaning |
|---|---|
| None | Uses structure type from the xxx$B_TYPE and/or xxx$B_SUBTYPE field of the structure. This is the default. |
| SDA_OPT$M_FORMAT_TYPE | Uses the structure type given in struct_prefix. |
| SDA_OPT$M_FORMAT_PHYSICAL | Indicates that struct_addr is a physical address instead of a virtual address. |
struct_prefix
| OpenVMS usage | char_string |
| type | character string |
| access | read only |
| mechanism | by reference |
Address of structure name string (zero-terminated).
Description
This routine displays the formatted content of a data structure thatbegins at the address specified. If no symbol prefix is passed, then SDA tries to find the symbols associated with the block type specifiedin the block-type byte of the data structure.
Condition Values Returned
None.
Example
PCB *local_pcb; PHD *local_phd; ... sda$format (local_pcb); sda$format (local_phd, SDA_OPT$M_FORMAT_TYPE, "PHD");
The first call formats the structure whose system address is held in the variable LOCAL_PCB, determining the type from the type and/or subtype byte of the structure. The second call formats the structure whose system address is held in the variable LOCAL_PHD, using PHD symbols.
10.5.19. SDA$FORMAT_HEADING
Formats a new page heading.
Format
void sda$format_heading (char *ctrstr,
__optional_params);
Arguments
ctrstr
| OpenVMS usage | char_string |
| type | character-coded text string |
| access | read only |
| mechanism | by reference |
Address of control string (zero-terminated ASCII string).
prmlst
| OpenVMS usage | varying_arg |
| type | quadword (signed or unsigned) |
| access | read only |
| mechanism | by value |
FAO parameters that are optional. All arguments after the control string are copied into a quadword parameter list as used by $FAOL_64.
Description
This routine prepares and saves the page heading to be used whenever SDA$NEW_PAGE is called. Nothing is output either until SDA$NEW_PAGE is next called, or a page break is necessary because the current page is full.
Condition Values Returned
None.
If the $FAOL_64 call issued by SDA$FORMAT_HEADING fails, the control string is used as the page heading.
Example
char hw_name[64];
...
sda$get_hw_name (hw_name, sizeof(hw_name));
sda$format_heading (
"SDA Extension Commands, system type !AZ",
&hw_name);
sda$new_page ();
This example produces the following heading:
SDA Extension Commands, system type DEC 3000 Model 400 ------------------------------------------------------
10.5.20. SDA$GET_ADDRESS
Gets the address value of the current memory location.
Format
void sda$get_address (VOID_PQ *address);
Arguments
address
| OpenVMS usage | quadword_unsigned |
| type | quadword (unsigned) |
| access | write only |
| mechanism | by reference |
Location to store the current 64-bit memory address.
Description
Returns the current address being referenced by SDA (location ".").
Condition Values Returned
None.
Example
VOID_PQ current_address; ... sda$get_address (¤t_address);
This call stores SDA's current memory location in the long pointerCURRENT_ADDRESS.
10.5.21. SDA$GET_BLOCK_NAME
Returns the name of a structure, given its type and/or subtype.
Format
void sda$get_block_name (uint32 block_type, uint32 block_subtype, char
*buffer_ptr, uint32 buffer_len);
Arguments
block_type
| OpenVMS usage | longword_unsigned |
| type | longword (unsigned) |
| access | read only |
| mechanism | by value |
Block type in range 0 - 255 (usually extracted from xxx$b_type field).
block_subtype
| OpenVMS usage | longword_unsigned |
| type | longword (unsigned) |
| access | read only |
| mechanism | by value |
Block subtype in range 0 - 255 (ignored if the given block type has no subtypes).
buffer_ptr
| OpenVMS usage | char_string |
| type | character string |
| access | write only |
| mechanism | by reference |
Address of buffer to save block name, which is returned as a zero-terminated string.
buffer_len
| OpenVMS usage | longword_unsigned |
| type | longword (unsigned) |
| access | read only |
| mechanism | by value |
Length of buffer to receive block name.
Description
Given the block type and/or subtype of a structure, this routine returns the name of the structure. If the structure type is one that has no subtypes, the given subtype is ignored. If the structure type is one that has subtypes, and the subtype is given as zero, the name of the block type itself is returned. If an invalid type or subtype (out of range) is given, an empty string is returned.
Note
The buffer should be large enough to accommodate the largest possible block name (25 bytes plus the termination byte). The block name is truncated if it is too long for the supplied buffer.
Condition Values Returned
None.
Example
char buffer[32];
...
sda$get_block_name (0x6F, 0x20,
buffer,
sizeof (buffer));
if (strlen (buffer) == 0)
sda$print ("Block type: no named type/subtype");
else
sda$print ("Block type: !AZ", buffer);
This example produces the following output:
Block type: VCC_CFCB
10.5.22. SDA$GET_BUGCHECK_MSG
Gets the text associated with a bugcheck code.
Format
void sda$get_bugcheck_msg (uint32 bugcheck_code, char *buffer_ptr,uint32
buffer_size);
Arguments
bugcheck_code
| OpenVMS usage | longword_unsigned |
| type | longword (unsigned) |
| access | read only |
| mechanism | by value |
The bugcheck code to look up.
buffer_ptr
| OpenVMS usage | char_string |
| type | character string |
| access | write only |
| mechanism | by reference |
Address of buffer to save bugcheck message.
buffer_len
| OpenVMS usage | longword_unsigned |
| type | longword (unsigned) |
| access | read only |
| mechanism | by value |
Length of buffer to receive message.
Description
Gets the string representing the bugcheck code passed as the argument. The bugcheck message string is passed in the buffer (represented as a pointer and length) as a zero-terminated ASCII string.
Note
The buffer should be large enough to accommodate the largest possible bugcheck message (128 bytes including the termination byte). The text is terminated if it is too long for the supplied buffer.
Condition Values Returned
None.
Example
char buffer[128];
...
sda$get_bugcheck_msg (0x108, buffer, sizeof(buffer));
sda$print ("Bugcheck code 108 (hex) =");
sda$print ("!_\"!AZ\"", buffer);
This example produces the following output:
Bugcheck code 108 (hex) =
"DOUBLDALOC, Double deallocation of swap file space"10.5.23. SDA$GET_CURRENT_CPU
Gets the CPU database address of the currently selected CPU.
Format
void sda$get_current_cpu (CPU **cpudb);
Arguments
cpudb
| OpenVMS usage | address |
| type | longword (unsigned) |
| access | write only |
| mechanism | by reference |
Location to which the address of the CPU database is to be returned.
Description
This routine causes SDA to return the address of the database for the currently selected CPU.
Condition Values Returned
None.
Example
#include <cpudef> CPU *current_cpu; sda$get_current_cpu ( ¤t_cpu );
In this example, the system address of the database for the current CPU is returned in variable current_cpu.
10.5.24. SDA$GET_CURRENT_PCB
Gets the PCB address of the "SDA current process" currently selected.
Format
void sda$get_current_pcb (PCB **pcbadr);
Arguments
pcbadr
| OpenVMS usage | quadword_unsigned |
| type | quadword (unsigned) |
| access | write only |
| mechanism | by reference |
Location in which to store the current PCB address.
Description
The PCB address of the process currently selected by SDA is returned inthe specified location.
Condition Values Returned
None.
Example
PCB *current_pcb; ... sda$get_current_pcb ( ¤t_pcb );
This call stores the system address of the PCB of the process currentlybeing referenced by SDA in the pointer CURRENT_PCB.
10.5.25. SDA$GET_DEVICE_NAME
Gets the device name, given the UCB address of the device.
Format
int sda$get_device_name (VOID_PQ ucb_addr, char *name_buf,
intname_len);
Arguments
ucb_addr
| OpenVMS usage | address |
| type | quadword (unsigned) |
| access | read only |
| mechanism | by value |
System address of the Unit Control Block of the device.
name_buf
| OpenVMS usage | char_string |
| type | character string |
| access | write only |
| mechanism | by reference |
Address of buffer to receive device name.
name_len
| OpenVMS usage | longword_unsigned |
| type | longword (unsigned) |
| access | read only |
| mechanism | by value |
Length of buffer to receive device name.
Description
This routine creates and returns the name for the device described by the given UCB. The device name is returned as a zero-terminated ASCII string.
Note
The buffer should be large enough to accommodate the largest possible device name (32 bytes including the termination byte). The text is terminated if it is too long for the supplied buffer.
Condition Values Returned
| SDA$_SUCCESS | Successful completion |
| SDA$_NOTAUCB | The address given is not the address of a UCB |
| SDA$_NOREAD | The data is inaccessible for some reason |
| Others | The data is inaccessible for some reason |
Example
VOID_PQ address;
char buffer[32];
...
sda$parse_command ("SHOW DEVICE DKB0:");
sda$symbol_value ("UCB", (uint64 *)&address);
sda$get_device_name (address, buffer, 32);
sda$print ("UCB address: !XL = \"!AZ:\"", address, buffer);
This example produces the following output:
UCB address: 814A9A40 = "$31$DKB0:"
10.5.26. SDA$GET_FLAGS
Obtain environment flags that indicate how SDA is being used.
Format
int sda$get_flags (SDA_FLAGS *flagaddr);
Arguments
flagaddr
| OpenVMS usage | address |
| type | SDA_FLAGS structure |
| access | write only |
| mechanism | by reference |
The address of the location where the environment flags are to be returned.
Description
SDA provides a set of flag bits that indicate if it is being used to analyze the current system, a system dump, a process dump, and so on. The flag bits that can be returned are described in Table 10.1, ''SDA$EXTEND Arguments'' and are defined in SDA_FLAGSDEF.H in SYS$LIBRARY:SYS$LIB_C.TLB.
Condition Values Returned
None.
Example
SDA_FLAGS flags;
sda$get_flags (&flags);
if (flags.sda_flags$v_current)
sda$print (Analyzing the current system);
This example shows the use of SDA$GET_FLAGS.
10.5.27. SDA$GET_HEADER
Returns pointers to local copies of the dump file header and the error log buffer together with the sizes of those data structures; optionally returns pointers and sizes for the crash error log entry and trap data(if any).
Format
void sda$get_header (DMP **dmp_header, uint32 *dmp_header_size,
void**errlog_buf, uint32 *errlog_buf_size,__optional_params);
Arguments
dmp_header
| OpenVMS usage | address |
| type | longword (unsigned) |
| access | write only |
| mechanism | by reference |
Location in which to store the address of the copy of the dump file header held by SDA.
dmp_header_size
| OpenVMS usage | longword_unsigned |
| type | longword (unsigned) |
| access | write only |
| mechanism | by reference |
Location in which to store the size of the dump file header.
errlog_buf
| OpenVMS usage | address |
| type | longword (unsigned) |
| access | write only |
| mechanism | by reference |
Location in which to store the address of the copy of the error log buffer held by SDA.
errlog_buf_size
| OpenVMS usage | longword_unsigned |
| type | longword (unsigned) |
| access | write only |
| mechanism | by reference |
Location in which to store the size of the error log buffer.
crasherl_buf
| OpenVMS usage | address |
| type | longword (unsigned) |
| access | write only |
| mechanism | by reference |
Location in which to store the address of the copy of the crash error log entry held by SDA.
crasherl_buf_size
| OpenVMS usage | longword_unsigned |
| type | longword (unsigned) |
| access | write only |
| mechanism | by reference |
Location in which to store the size of the crash error log entry.
trapinfo_buf
| OpenVMS usage | address |
| type | longword (unsigned) |
| access | write only |
| mechanism | by reference |
Location in which to store the address of the copy of the trap info, if any, held by SDA.
trapinfo_buf_size
| OpenVMS usage | longword_unsigned |
| type | longword (unsigned) |
| access | write only |
| mechanism | by reference |
Location in which to store the size of the trap data, if any.
Description
This routine returns the addresses and sizes of the dump header, error logs, and optionally the crash error log entry and trap data read by SDA when the dump file is opened. If this routine is called when the running system is being analyzed with ANALYZE/SYSTEM, then the following occurs:
Returns the address and size of SDA's dump header buffer, but the header contains zeroes
Returns zeroes for the address and size of SDA's error log buffer, the crash error log entry and trap data
Trap data only exists if an access violation occurs while the dump is being written. Usually, the returned trapinfo_buf and trapinfo_buf_size will be zero.
Condition Values Returned
None.
Example
DMP *dmp_header;
uint32 dmp_header_size;
char *errlog_buffer;
uint32 errlog_buffer_size;
...
sda$get_header (&dmp_header,
&dmp_header_size,
(void **)&errlog_buffer,
&errlog_buffer_size);
This call stores the address and size of SDA's copy of the dump file header in DMP_HEADER and DMP_HEADER_SIZE, and stores the address and size of SDA's copy of the error log buffers in ERRLOG_BUFFER and ERRLOG_BUFFER_SIZE, respectively.
10.5.28. SDA$GET_HW_NAME
Returns the full name of the hardware platform where the dump was written.
Format
void sda$get_hw_name (char *buffer_ptr, uint32
buffer_len);
Arguments
buffer_ptr
| OpenVMS usage | char_string |
| type | character string |
| access | write only |
| mechanism | by reference |
Address of buffer to save HW name.
buffer_len
| OpenVMS usage | longword_unsigned |
| type | longword (unsigned) |
| access | read only |
| mechanism | by value |
Length of buffer to receive HW name.
Description
Returns a zero-terminated ASCII string representing the platform hardware name and puts it in the buffer passed as the argument.
Note
The buffer should be large enough to accommodate the largest possible hardware platform name (120 bytes including the termination byte). The name is truncated if it is too long for the supplied buffer.
Condition Values Returned
None.
Example
char hw_name[64];
...
sda$get_hw_name (hw_name, sizeof(hw_name));
sda$print ("Platform name: \"!AZ\"", hw_name);This example produces output of the form:
Platform name: "DEC 3000 Model 400"
10.5.29. SDA$GET_IMAGE_OFFSET
Maps a given virtual address onto an image or execlet.
Format
COMP_IMG_OFF sda$get_image_offset (VOID_PQ va, VOID_PQ img_info,VOID_PQ
subimg_info, VOID_PQ offset);
Arguments
va
| OpenVMS usage | address |
| type | quadword (unsigned) |
| access | read only |
| mechanism | by value |
Virtual address of interest.
img_info
| OpenVMS usage | address |
| type | quadword (unsigned) |
| access | write only |
| mechanism | by reference |
Pointer to return addr of LDRIMG or IMCB block.
subimg_info
| OpenVMS usage | address |
| type | quadword (unsigned) |
| access | write only |
| mechanism | by reference |
Pointer to return addr of ISD_OVERLAY or KFERES.
offset
| OpenVMS usage | quadword_unsigned |
| type | quadword (unsigned) |
| access | write only |
| mechanism | by reference |
Pointer to address to return offset from image.
Description
Given a virtual address, this routine finds in which image it falls and returns the image information and offset. The loaded image list is traversed first to find this information. If it is not found, then the activated image list of the currently selected process is traversed. If still unsuccessful, then the resident installed images are checked.
Condition Values Returned
| SDA_CIO$V_VALID | Set if image offset is found |
| SDA_CIO$V_PROCESS | Set if image is an activated image |
| SDA_CIO$V_SLICED | Set if the image is sliced |
| SDA_CIO$V_COMPRESSED | Set if activated image contains compressed data sections |
| SDA_CIO$V_ISD_INDEX | Index into ISD_LABELS table (on Alpha, only for LDRIMG execlets) |
The status returned indicates the type of image if a match was found.
| SDA_CIO$V_xxx flags set: | img_info type: | subimg_info type: |
|---|---|---|
| VALID | LDRIMG | n/a |
| VALID && SLICED | LDRIMG | ISD_OVERLAY |
| VALID && PROCESS | IMCB | n/a |
| VALID && PROCESS && SLICED | IMCB | KFERES_SECTION |
On IA-64, SDA_CIO$V_SLICED will always be set if SDA_CIO$V_VALID is set.
Table 10.2, ''Alpha ISD_LABELS Index'' and Table 10.3, ''IA-64 ISD_Labels Index'' describe the ISD_LABELS index on Alpha and IA-64 systems.
| Index | Name | Meaning |
|---|---|---|
| 0 | SDA_CIO$K_NPRO | Nonpaged read only |
| 1 | SDA_CIO$K_NPRW | Nonpaged read/write |
| 2 | SDA_CIO$K_PRO | Paged read only |
| 3 | SDA_CIO$K_PRW | Paged read/write |
| 4 | SDA_CIO$K_FIX | Fixup |
| 5 | SDA_CIO$K_INIT | Initialization |
| Index | Name | Meaning |
|---|---|---|
| 0 | SDA_CIO$K_FIX | Fixup |
| 1 | SDA_CIO$K_PROMO_CODE | Promote (code) |
| 2 | SDA_CIO$K_PROMO_DATA | Promote (data) |
| 3 | SDA_CIO$K_INIT_CODE | Initialization (code) |
| 4 | SDA_CIO$K_INIT_DATA | Initialization (data) |
| 5 | SDA_CIO$K_CODE | Code |
| 6 | SDA_CIO$K_SHORT_RW | Short data (read/write) |
| 7 | SDA_CIO$K_SHORT_RO | Short data (read only) |
| 8 | SDA_CIO$K_RW | Data (read/write) |
| 9 | SDA_CIO$K_RO | Data (read only) |
| 10 | SDA_CIO$K_SHORT_DZ | Short data (demand zero) |
| 11 | SDA_CIO$K_SHORT_TDZ | Short data (trailing demand zero) |
| 12 | SDA_CIO$K_DZERO | Demand zero |
| 13 | SDA_CIO$K_TR_DZERO | Trailing demand zero |
Example
VOID_PQ va = (VOID_PQ)0xFFFFFFFF80102030;
COMP_IMG_OFF sda_cio;
int64 img_info;
int64 subimg_info;
int64 offset;
...
sda_cio = sda$get_image_offset (va,
&img_info,
&subimg_info,
&offset);For an example of code that interprets the returned COMP_IMG_OFFstructure, see the supplied example program, SYS$EXAMPLES:MBX$SDA.C.
10.5.30. SDA$GET_INPUT
Reads input commands.
Format
int sda$get_input (char *prompt, char *buffer, uint32
buflen);
Arguments
prompt
| OpenVMS usage | char_string |
| type | character string |
| access | read only |
| mechanism | by reference |
Address of prompt string (zero-terminated ASCII string).
buffer
| OpenVMS usage | char_string |
| type | character string |
| access | write only |
| mechanism | by reference |
Address of buffer to store command.
buflen
| OpenVMS usage | longword_unsigned |
| type | longword (unsigned) |
| access | read only |
| mechanism | by value |
Maximum length of buffer.
Description
The command entered is returned as a zero-terminated string. The string is not uppercased. If you do not enter input but simply press<return> or <ctrl/Z>, the routine returns a null string.
Condition Values Returned
| SS$_NORMAL | Successful completion. |
| RMS$_EOF | User pressed <ctrl/Z> |
Example
int status; char buffer[128]; ... status = sda$get_input ( "MBX> ", buffer, sizeof (buffer) );
This call prompts you for input with "MBX> " and stores the responsein the buffer.
10.5.31. SDA$GET_LINE_COUNT
Obtains the number of lines currently printed on the current page.
Format
void sda$get_line_count (uint32 *line_count);
Arguments
line_count
| OpenVMS usage | longword_unsigned |
| type | longword (unsigned) |
| access | write only |
| mechanism | by reference |
The number of lines printed on current page.
Description
Returns the number of lines that have been printed so far on thecurrent page.
Condition Values Returned
None.
Example
uint32 line_count; ... sda$get_line_count (&line_count);
This call copies the current line count on the current page of outputto the location LINE_COUNT.
10.5.32. SDA$GETMEM
Reads dump or system memory and signals a warning if inaccessible.
Format
int sda$getmem (VOID_PQ start, void *dest, int
length,__optional_params);
Arguments
start
| OpenVMS usage | address |
| type | quadword (unsigned) |
| access | read only |
| mechanism | by value |
Starting virtual address in dump or system.
dest
| OpenVMS usage | address |
| type | varies |
| access | write only |
| mechanism | by reference |
Return buffer address.
length
| OpenVMS usage | longword_unsigned |
| type | longword (unsigned) |
| access | read only |
| mechanism | by value |
Length of transfer.
physical
| OpenVMS usage | longword_unsigned |
| type | longword (unsigned) |
| access | read only |
| mechanism | by value |
0: <start> is a virtual address. This is the default.
1: <start> is a physical address.
Description
This routine transfers an area from the memory in the dump file or the running system to the caller's return buffer. It performs the necessary address translation to locate the data in the dump file. SDA$GETMEM signals a warning and returns an error status if the data is inaccessible.
Related Routines
SDA$REQMEM and SDA$TRYMEM
Condition Values Returned
| SDA$_SUCCESS | Successful completion |
| SDA$_NOREAD | The data is inaccessible for some reason. |
| SDA$_NOTINPHYS | The data is inaccessible for some reason. |
| Others | The data is inaccessible for some reason. |
If a failure status code is returned, it has already been signaled as a warning.
Example
int status; PCB *current_pcb; PHD *current_phd; ... status = sda$getmem ((VOID_PQ)¤t_pcb->pcb$l_phd, ¤t_phd, 4);
This call returns the contents of the PCB$L_PHD field of the PCB, whosesystem address is in the pointer CURRENT_PCB, to the pointerCURRENT_PHD.
10.5.33. SDA$INSTRUCTION_DECODE
Translates one machine instruction into the assembler string equivalent.
Format
int sda$instruction_decode (void *istream_ptr, char *buffer,
uint32buflen,__optional_params);
Arguments
istream_ptr
| OpenVMS usage | address |
| type | longword (unsigned) |
| access | read/write |
| mechanism | by reference |
Address of the pointer that points to a copy of the i-stream in a local buffer.
buffer
| OpenVMS usage | char_string |
| type | character string |
| access | write only |
| mechanism | by reference |
Address of a string buffer into which to store the output assembler string.
buflen
| OpenVMS usage | longword_unsigned |
| type | longword (unsigned) |
| access | read only |
| mechanism | by value |
Maximum size of the string buffer.
template_buffer
| OpenVMS usage | char_string |
| type | character string |
| access | write only |
| mechanism | by reference |
(IA-64 only) Address of a string buffer into which to store the template string.
template_buflen
| OpenVMS usage | longword_unsigned |
| type | longword (unsigned) |
| access | read only |
| mechanism | by value |
(IA-64 only) Maximum size of the template buffer.
Description
Translates a machine instruction into the assembler string equivalent. Alpha instructions are always 4 bytes long; IA-64 instructions are always in bundles that are 16 bytes long. The instruction stream must first be read into local memory and then the address of a pointer to the local copy of the instruction stream is passed to the routine. For every successful translated instruction, the pointer is automatically updated to point to the next instruction on Alpha or slot on IA-64.
The output assembler string and optionally the template string is zero-terminated and in case of a failure a null string is returned.
The template_buffer and template_buflen arguments only apply to IA-64 and are optional.
Condition Values Returned
| SS$_NORMAL | Successful completion. |
| SS$_BADPARAM | Any of the following failures: |
| Output buffer too small Invalid register Invalid opcode class/format Could not translate instruction |
Examples
Alpha
int status; VOID_PQ va = (VOID_PQ)0xFFFFFFFF80102030; uint32 instruction; uint32 *istream = &instruction; char buffer[64]; ... sda$reqmem (va, &instruction, 4); status = sda$instruction_decode (&istream, buffer, sizeof (buffer)); if ( !$VMS_STATUS_SUCCESS (status) ) sda$print ( "SDA$INSTRUCTION_DECODE failed, status = !XL", status); else sda$print ( "VA: !AZ", buffer );)
This example on an Alpha system reads the instruction at dump locationVA and decodes it, putting the result into BUFFER, and displays theinstruction. Pointer ISTREAM is incremented (to the next longword).
IA-64
int status; VOID_PQ va = (VOID_PQ)0xFFFFFFFF80102030; uint64 instruction [2]; uint64 *istream = &instruction; char buffer [64]; char template [16]; sda$reqmem (va, &instruction, 16); status = sda$instruction_decode ( &istream, buffer, sizeof (buffer), template, sizeof (template) ); if ( !$VMS_STATUS_SUCCESS (status) ) sda$print ( "SDA$INSTRUCTION_DECODE failed, status = !XL", status); else { sda$print ( " { !AZ", template ); sda$print ( "VA: !AZ", buffer ); while (((int)istream & 7) != 0)// local buffer only has to be quadword aligned { status = sda$instruction_decode ( &istream, buffer, sizeof (buffer) ); if ( !$VMS_STATUS_SUCCESS (status) ) { sda$print ( "SDA$INSTRUCTION_DECODE failed, status = !XL", status); break; } else sda$print ( " !AZ", buffer ); } sda$print ( " }" ); }This example for IA-64 reads the instruction bundle at dump location VA and decodes it, displaying each of the instructions in the bundle. Pointer ISTREAM is incremented (to the next octaword bundle).
10.5.34. SDA$NEW_PAGE
Begins a new page of output.
Format
void sda$new_page ();
Arguments
None.
Description
This routine causes a new page to be written and outputs the page heading (established with SDA$FORMAT_HEADING) and the current subheading (established with SDA$SET_HEADING_ROUTINE).
Condition Values Returned
None.
Example
sda$new_page ();
This call outputs a page break and displays the current page heading and subheading (if any).
10.5.35. SDA$PARSE_COMMAND
Parses and executes an SDA command line.
Format
void sda$parse_command (char *cmd_line,
__optional_params);
Arguments
cmd_line
| OpenVMS usage | char_string |
| type | character string |
| access | read only |
| mechanism | by reference |
Address of a valid SDA command line (zero-terminated).
options
| OpenVMS usage | longword_unsigned |
| type | longword (unsigned) |
| access | read only |
| mechanism | by value |
The options argument has the following values:
| Value | Meaning |
|---|---|
| SDA_OPT$K_PARSE_DONT_SAVE | Indicates "do not save this command." This is the default. |
| SDA_OPT$K_PARSE_SAVE | Indicates "save this command." That is, it can be recalled with KP0 or REPEAT. |
Description
Not every SDA command has a callable extension interface. For example,to redirect SDA's output, you would pass the command string "SET OUTPUTMBX.LIS" to this parse command routine. Abbreviations are allowed.
Condition Values Returned
None.
Example
sda$parse_command ("SHOW ADDRESS 80102030");This call produces the following output:
FFFFFFFF.80102030 is an S0/S1 address
Mapped by Level-3 PTE at: FFFFFFFD.FFE00408
Mapped by Level-2 PTE at: FFFFFFFD.FF7FF800
Mapped by Level-1 PTE at: FFFFFFFD.FF7FDFF8
Mapped by Selfmap PTE at: FFFFFFFD.FF7FDFF0
Also mapped in SPT window at: FFFFFFFF.FFDF0408The "SHOW ADDRESS" command is not recorded as the most recent command for use with the KP0 key or the REPEAT command.
10.5.36. SDA$PRINT
Formats and prints a single line.
Format
int sda$print (char *ctrstr, __optional_params);
Arguments
ctrstr
| OpenVMS usage | char_string |
| type | character-coded text string |
| access | read only |
| mechanism | by reference |
Address of a zero-terminated FAO control string.
prmlst
| OpenVMS usage | varying_arg |
| type | quadword (signed or unsigned) |
| access | read only |
| mechanism | by value |
Optional FAO parameters. All arguments after the control string are copied into a quadword parameter list, as used by $FAOL_64.
Description
Formats and prints a single line. This is normally output to the terminal, unless you used the SDA commands SET OUTPUT or SET LOG to redirect or copy the output to a file.
Condition Values Returned
| SDA$_SUCCESS | Indicates a successful completion. |
| SDA$_CNFLTARGS | Indicates more than twenty FAO parameters given. |
| Other | Returns from the $PUT issued by SDA$PRINT (the error is also signaled). If the $FAOL_64 call issued by SDA$PRINT fails, the control string is output. |
Example
char buffer[32];
...
sda$get_block_name (0x6F, 0x20,
buffer,
sizeof (buffer));
sda$print ("Block type: !AZ", buffer);This example outputs the following line:
Block type: VCC_CFCB
10.5.37. SDA$READ_SYMFILE
Reads symbols from a given file.
Format
int sda$read_symfile (char *filespec, uint32
options,__optional_params);
Arguments
filespec
| OpenVMS usage | char_string |
| type | character string |
| access | read only |
| mechanism | by reference |
Address of file or directory specification from which to read the symbols (zero-terminated ASCII string).
options
| OpenVMS usage | longword_unsigned |
| type | longword (unsigned) |
| access | read only |
| mechanism | by value |
Indicates type of symbol file and flags, as shown in the following:
| Flags | Effect |
|---|---|
| SDA_OPT$M_READ_FORCE | read/force <file> |
| SDA_OPT$M_READ_IMAGE | read/image <file> |
| SDA_OPT$M_READ_SYMVA | read/symva <file> |
| SDA_OPT$M_READ_RELO | read/relo <file> |
| SDA_OPT$M_READ_EXEC | read/exec [<dir>] |
| SDA_OPT$M_READ_NOLOG | /nolog, suppress count of symbols read |
| SDA_OPT$M_READ_FILESPEC | <file> or <dir> given |
| SDA_OPT$M_READ_NOSIGNAL | return status, without signaling errors |
relocate_base
| OpenVMS usage | address |
| type | longword (unsigned) |
| access | read only |
| mechanism | by value |
Base address for symbols (nonsliced symbols).
symvect_va
| OpenVMS usage | address |
| type | longword (unsigned) |
| access | read only |
| mechanism | by value |
The symbol vector address (symbols are offsets into the symbol vector).
symvect_size
| OpenVMS usage | longword_unsigned |
| type | longword (unsigned) |
| access | read only |
| mechanism | by value |
Size of symbol vector.
loaded_img_info
| OpenVMS usage | address |
| type | longword (unsigned) |
| access | read only |
| mechanism | by reference |
The address of $LDRIMG data structure with execlet information.
Description
This command reads symbols from a given file to add symbol definitions to the working symbol table by reading GST entries. The file is usually a symbol file (.STB) or an image (.EXE). If SDA_OPT$M_READ_EXEC is specified in the options, then the filespec is treated as a directory specification, where symbol files and/or image files for all execlets may be found (as with READ/EXECUTIVE). If no directory specification is given, the logical name SDA$READ_DIR is used.
Note that when SDA reads symbol files and finds routine names, the symbol name that matches the routine name is set to the address of the procedure or function descriptor. A second symbol name, the routine name with "_C" appended, is set to the start of the routine's prologue.
Condition Values Returned
| SDA$_SUCCESS | Successful completion. |
| SDA$_CNFLTARGS | No filename given and SDA_OPT$M_READ_EXEC not set. |
Other errors are signaled and/or returned, exactly as though the equivalent SDA READ command had been used. Use HELP/MESSAGE for explanations.
Example
sda$read_symfile ("SDA$READ_DIR:SYSDEF", SDA_OPT$M_READ_NOLOG);The symbols in SYSDEF.STB are added to SDA's internal symbol table, and the number of symbols found is not output to the terminal.
10.5.38. SDA$REQMEM
Reads dump or system memory and signals an error if inaccessible.
Format
int sda$reqmem (VOID_PQ start, void *dest, int
length,__optional_params);
Arguments
start
| OpenVMS usage | address |
| type | quadword (unsigned) |
| access | read only |
| mechanism | by value |
Starting virtual address in dump or system.
dest
| OpenVMS usage | address |
| type | varies |
| access | write only |
| mechanism | by reference |
Return buffer address.
length
| OpenVMS usage | longword_unsigned |
| type | longword (unsigned) |
| access | read only |
| mechanism | by value |
Length of transfer.
physical
| OpenVMS usage | longword_unsigned |
| type | longword (unsigned) |
| access | read only |
| mechanism | by value |
0: <start> is a virtual address. This is the default.
1: <start> is a physical address.
Description
This routine transfers an area from the memory in the dump file or the running system to the caller's return buffer. It performs the necessary address translation to locate the data in the dump file. SDA$REQMEM signals an error and aborts the current command if the data is inaccessible.
Related Routines
SDA$GETMEM and SDA$TRYMEM
Condition Values Returned
| SDA$_SUCCESS | Successful completion. |
Any failure is signaled as an error and the current command aborts.
Example
VOID_PQ address;
uint32 instruction;
...
sda$symbol_value ("EXE_STD$ALLOCATE_C", (uint64 *)&address);
sda$reqmem (address, &instruction, 4);This example reads the first instruction of the routine EXE_STD$ALLOCATE into the location INSTRUCTION.
10.5.39. SDA$SET_ADDRESS
Stores a new address value as the current memory address (".").
Format
void sda$set_address (VOID_PQ address);
Arguments
address
| OpenVMS usage | quadword_unsigned |
| type | quadword (unsigned) |
| access | read only |
| mechanism | by value |
Address value to store in current memory location.
Description
The specified address becomes SDA's current memory address (the predefined SDA symbol ".").
Condition Values Returned
None.
Example
sda$set_address ((VOID_PQ)0xFFFFFFFF80102030);
This call sets SDA's current address to FFFFFFFF.80102030.
10.5.40. SDA$SET_CPU
Sets a new SDA CPU context.
Format
int sda$set_cpu (int cpu_id);
Arguments
cpu_id
| OpenVMS usage | longword_unsigned |
| type | longword (unsigned) |
| access | read only |
| mechanism | by value |
The desired CPU ID.
Description
This routine causes SDA to set the specified CPU as the currently selected CPU.
Condition Values Returned
| SDA$_SUCCESS | Successful completion. |
Any failure is signaled as an error and the current command aborts.
Example
int cpu_id = 2; status = sda$set_cpu ( cpu_id );
In this example, SDA's current CPU context is set to the CPU whose number is held in the variable CPU_ID.
10.5.41. SDA$SET_HEADING_ROUTINE
Sets the current heading routine to be called after each page break.
Format
void sda$set_heading_routine (void (*heading_rtn) ());
Arguments
heading_rtn
| OpenVMS usage | procedure |
| type | procedure value |
| access | read only |
| mechanism | by value |
Address of routine to be called after each new page.
Description
When SDA begins a new page of output (either because SDA$NEW_PAGE was called, or because the current page is full), it outputs two types of headings. The first is the page title, and is set by calling the routine SDA$FORMAT_HEADING. This is the title that is included in the index page of a listing file when you issue a SET OUTPUT command. The second heading is typically for column headings, and as this can vary from display to display, you must write a routine for each separate heading. When you call SDA$SET_HEADING_ROUTINE to specify a user-written routine, the routine is called each time SDA begins a new page.
To stop the routine from being invoked each time SDA begins a new page, call either SDA$FORMAT_HEADING to set a new page title, or SDA$SET_HEADING_ROUTINE and specify the routine address as NULL.
If the column headings need to be output during a display (that is, in the middle of a page), and then be re-output each time SDA begins a new page, call the user-written routine directly the first time, then call SDA$SET_HEADING_ROUTINE to have it be called automatically thereafter.
Condition Values Returned
None.
Example
void mbx$title (void)
{
sda$print ("Mailbox UCB ...");
sda$print (" Unit Address ...");
sda$print ("------------------------");
return;
}
...
sda$set_heading_routine (mbx$title);
...
sda$set_heading_routine (NULL);This example sets the heading routine to the routine MBX$TITLE, and later clears it. The routine is called if any page breaks are generated by the intervening code.
10.5.42. SDA$SET_LINE_COUNT
Sets the number of lines printed so far on the current page.
Format
void sda$set_line_count (uint32 line_count);
Arguments
line_count
| OpenVMS usage | longword_unsigned |
| type | longword (unsigned) |
| access | read only |
| mechanism | by value |
The number of lines printed on current page.
Description
The number of lines that have been printed so far on the current pageis set to the given value.
Condition Values Returned
None.
Example
sda$set_line_count (5);
This call sets SDA's current line count on the current page of output to 5.
10.5.43. SDA$SET_PROCESS
Sets a new SDA process context.
Format
int sda$set_process (const char *proc_name, int proc_index,
intproc_addr);
Arguments
proc_name
| OpenVMS usage | character_string |
| type | character string |
| access | read only |
| mechanism | by reference |
Address of the process name string (zero-terminated).
proc_index
| OpenVMS usage | longword_unsigned |
| type | longword (unsigned) |
| access | read only |
| mechanism | by value |
The index of the desired process.
proc_addr
| OpenVMS usage | address |
| type | longword (unsigned) |
| access | read only |
| mechanism | by value |
The address of the PCB for the desired process.
Description
This routine causes SDA to set the specified process as the currently selected process.
Note
The proc_name, proc_index, and proc_addr are mutually exclusive.
Condition Values Returned
| SDA$_SUCCESS | Successful completion. |
Any failure is signaled as an error and the current command aborts.
Example
status = sda$set_process ( "JOB_CONTROL", 0, 0);
In this example, SDA's current process context is set to the JOB_CONTROL process.
10.5.44. SDA$SKIP_LINES
This routine outputs a specified number of blank lines.
Format
void sda$skip_lines (uint32 lines);
Arguments
lines
| OpenVMS usage | longword_unsigned |
| type | longword (unsigned) |
| access | read only |
| mechanism | by value |
Number of lines to skip.
Description
The specified number of blank lines are output.
Condition Values Returned
None.
Example
sda$skip_lines (2);
This call causes two blank lines to be output.
10.5.45. SDA$SYMBOL_VALUE
Obtains the 64-bit value of a specified symbol.
Format
int sda$symbol_value (char *symb_name, uint64
*symb_value);
Arguments
symb_name
| OpenVMS usage | char_string |
| type | character string |
| access | read only |
| mechanism | by reference |
Zero-terminated string containing symbol name.
symb_value
| OpenVMS usage | quadword_unsigned |
| type | quadword (unsigned) |
| access | write only |
| mechanism | by reference |
Address to receive symbol value.
Description
A search through SDA's symbol table is made for the specified symbol.If found, its 64-bit value is returned.
Condition Values Returned
| SDA$_SUCCESS | Symbol found. |
| SDA$_BADSYM | Symbol not found. |
Example
int status;
VOID_PQ address;
...
status = sda$symbol_value ("EXE_STD$ALLOCATE_C", (uint64 *)&address);This call returns the start address of the prologue of routine
EXE_STD$ALLOCATE to location ADDRESS.
10.5.46. SDA$SYMBOLIZE
Converts a value to a symbol name and offset.
Format
int sda$symbolize (uint64 value, char *symbol_buf, uint32
symbol_len);
Arguments
value
| OpenVMS usage | quadword_unsigned |
| type | quadword (unsigned) |
| access | read only |
| mechanism | by value |
Value to be translated.
symbol_buf
| OpenVMS usage | char_string |
| type | character string |
| access | write only |
| mechanism | by reference |
Address of buffer to which to return string.
symbol_len
| OpenVMS usage | longword_unsigned |
| type | longword (unsigned) |
| access | read only |
| mechanism | by value |
Maximum length of string buffer.
Description
This routine accepts a value and returns a string that contains a symbol and offset corresponding to that value. First the value is checked in the symbol table. If no symbol can be found (either exact match or up to 0XFFF less than the specified value), the value is then checked to see if it falls within one of the loaded or activated images.
Condition Values Returned
| SS$_NORMAL | Successful completion. |
| SS$_BUFFEROVF | Buffer too small, string truncated. |
| SS$_NOTRAN | No symbolization for this value (null string returned). |
Example
VOID_PQ va = VOID_PQ(0xFFFFFFFF80102030);
char buffer [64]
status = sda$symbolize (va, buffer, sizeof(buffer));
sda$print ("FFFFFFFF.80102030 = \"!AZ\"", buffer);
This example outputs the following:
FFFFFFFF.80102030 = "EXE$WRITE_PROCESS_C+00CD0"
10.5.47. SDA$TRYMEM
Reads dump or system memory and returns the error status (without signaling) if inaccessible.
Format
int sda$trymem (VOID_PQ start, void *dest, int
length,__optional_params);
Arguments
start
| OpenVMS usage | address |
| type | quadword (unsigned) |
| access | read only |
| mechanism | by value |
Starting virtual address in dump or system.
dest
| OpenVMS usage | address |
| type | varies |
| access | write only |
| mechanism | by reference |
Return buffer address.
length
| OpenVMS usage | longword_unsigned |
| type | longword (unsigned) |
| access | read only |
| mechanism | by value |
Length of transfer.
physical
| OpenVMS usage | longword_unsigned |
| type | longword (unsigned) |
| access | read only |
| mechanism | by value |
0: <start> is a virtual address. This is the default.
1: <start> is a physical address.
Description
This routine transfers an area from the memory in the dump file or the running system to the caller's return buffer. It performs the necessary address translation to locate the data in the dump file. SDA$TRYMEM does not signal any warning or errors. It returns the error status if the data is inaccessible.
Related Routines
SDA$GETMEM and SDA$REQMEM
Condition Values Returned
| SDA$_SUCCESS | Successful completion. |
| SDA$_NOREAD | The data is inaccessible for some reason. |
| SDA$_NOTINPHYS | The data is inaccessible for some reason. |
| Others | The data is inaccessible for some reason. |
Example
int status;
DDB *ddb;
...
status = sda$trymem (ddb->ddb$ps_link, ddb, DDB$K_LENGTH);
if ($VMS_STATUS_SUCCESS (status))
sda$print ("Next DDB is successfully read from dump");
else
sda$print ("Next DDB is inaccessible");This example attempts to read the next DDB in the DDB list from thedump.
10.5.48. SDA$TYPE
Formats and types a single line to SYS$OUTPUT.
Format
int sda$type (char *ctrstr, __optional_params);
Arguments
ctrstr
| OpenVMS usage | char_string |
| type | character-coded text string |
| access | read only |
| mechanism | by reference |
Address of a zero-terminated FAO control string.
prmlst
| OpenVMS usage | varying_arg |
| type | quadword (signed or unsigned) |
| access | read only |
| mechanism | by value |
Optional FAO parameters. All arguments after the control string are copied into a quadword parameter list, as used by $FAOL_64.
Description
Formats and prints a single line to the terminal. This is unaffected by the use of the SDA commands SET OUTPUT or SET LOG.
Condition Values Returned
| SDA$_SUCCESS | Indicates a successful completion. |
| SDA$_CNFLTARGS | Indicates more than twenty FAO parameters given. |
| Other | Returns from the $PUT issued by SDA$TYPE (the error is also signaled). If the $FAOL_64 call issued by SDA$TYPE fails, the control string is output. |
Example
int status;
...
status = sda$type ("Invoking SHOW SUMMARY to output file...");This example displays the message "Invoking SHOW SUMMARY to output file..." to the terminal.
10.5.49. SDA$VALIDATE_QUEUE
Validates queue structures.
Format
void sda$validate_queue (VOID_PQ queue_header,
__optional_params);
Arguments
queue_header
| OpenVMS usage | address |
| type | quadword (unsigned) |
| access | read only |
| mechanism | by value |
Address from which to start search.
options
| OpenVMS usage | mask_longword |
| type | longword (unsigned) |
| access | read only |
| mechanism | by value |
The following table shows the flags that indicate the type of queue:
| Flag | Meaning |
|---|---|
| None | Defaults to doubly-linked longword queue |
| SDA_OPT$M_QUEUE_BACKLINK | Validates the integrity of a doubly-linked queue using the back links instead of the forward links |
| SDA_OPT$M_QUEUE_LISTQUEUE | Displays queue elements for debugging |
| SDA_OPT$M_QUEUE_QUADLINK | Indicates a quadword queue |
| SDA_OPT$M_QUEUE_SELF | Indicates a self-relative queue |
| SDA_OPT$M_QUEUE_SINGLINK | Indicates a singly-linked queue |
Description
You can use this routine to validate the integrity of doubly-linked,singly-linked or self-relative queues either with longword or quadword links. If you specify the option SDA_OPT$M_QUEUE_LISTQUEUE, the queue elements are displayed for debugging. Otherwise a one-line summary indicates how many elements were found and whether the queue is intact.
Condition Values Returned
None.
If an error occurs, it is signaled by SDA$VALIDATE_QUEUE.
Example
int64 temp;
int64 *queue;
...
sda$symbol_value ("EXE$GL_NONPAGED", &temp);
temp += 4;
sda$reqmem ((VOID_PQ)temp, &queue, 4);
sda$validate_queue (queue, SDA_OPT$M_QUEUE_SINGLINK);This sequence validates the nonpaged pool free list, and outputs a message of the form:
Queue is zero-terminated, total of 204 elements in the queue
Part II. OpenVMS System Code Debugger and System Dump Debugger
This part describes the System Code Debugger (SCD) and the System Dump Debugger (SDD). It presents how to use SCD and SDD by doing the following:
Building a system image to be debugged
Setting up the target system for connections
Setting up the host system
Starting SCD
Troubleshooting connections and network failures
Looking at a sample SCD session
Analyzing memory as recorded in a system dump
Looking at a sample SDD session
Chapter 11. OpenVMS System Code Debugger
This chapter describes the OpenVMS System Code Debugger (SCD) and how it can be used to debug nonpageable system code and device drivers running at any interrupt priority level (IPL).
You can use SCD to perform the following tasks:
Control the system software's execution----stop at points of interest, resume execution, intercept fatal exceptions, and so on
Trace the execution path of the system software
Monitor exception conditions
Examine and modify the values of variables
Test the effect of modifications, in some cases, without having to edit the source code, recompile, and relink
The use of SCD requires two systems:
The host system, probably also the system where the image to be debugged has been built
The target system, usually a standalone test system, where the image being debugged is executed
Host and target systems must be the same architecture, that is, both must be Alpha systems or IA-64 systems.
SCD is a symbolic debugger. You can specify variable names, routine names, and so on, precisely as they appear in your source code. SCD can also display the source code where the software is executing, and allow you to step by source line.
SCD recognizes the syntax, data typing, operators, expressions, scoping rules, and other constructs of a given language. If your code or driver is written in more than one language, you can change the debugging context from one language to another during a debugging session.
To use SCD, you must do the following:
Build a system image or device driver to be debugged.
Set up the target kernel on a standalone system.
The target kernel is the part of SCD that resides on the system that is being debugged. It is integrated with XDELTA and is part of the SYSTEM_DEBUG execlet.
Set up the host system environment, which is integrated with the OpenVMS Debugger.
The following sections cover these tasks in more detail, describe the available user-interface options, summarize applicable OpenVMS Debugger commands, and provide a sample SCD session.
11.1. User-Interface Options
SCD has the following user-interface options:
A DECwindows Motif interface for workstations
When using this interface, you interact with SCD by using a mouse and pointer to choose items from menus, click on buttons, select names in windows, and so on.
Note that you can also use OpenVMS Debugger commands with the DECwindows Motif interface.
A character cell interface for terminals and workstations
When using this interface, you interact with SCD by entering commands at a prompt. The sections in this chapter describe how to use the system code debugger with the character cell interface.
For more information about using the OpenVMS DECwindows Motif interface and OpenVMS Debugger commands with SCD, see the VSI OpenVMS Debugger Manual.
11.2. Building a System Image to Be Debugged
Compile the sources you want to debug, and be sure to use the /DEBUG and /NOOPT qualifiers.
Note
Debugging optimized code is much more difficult and is not recommended unless you know the Alpha or IA-64 architecture well. The instructions are reordered so much that single-stepping by source line will look like you are randomly jumping all over the code. Also note that you cannot access all variables. SCD reports that they are optimized away.
Link your image using the /DSF (debug symbol file) qualifier. Do not use the /DEBUG qualifier, which is for debugging user programs. The /DSF qualifier takes an optional filename argument similar to the /EXE qualifier. For more information, see the VSI OpenVMS Linker Utility Manual. If you specify a name in the /EXE qualifier, you will need to specify the same name for the /DSF qualifier. For example, you would use the following command:
$ LINK/EXE=EXE$:MY_EXECLET/DSF=EXE$:MY_EXECLET OPTIONS_FILE/OPT
The .DSF and .EXE file names must be the same. Only the extensions will be different, that is .DSF and .EXE.
The contents of the .EXE file should be exactly the same as if you had linked without the /DSF qualifier. The .DSF file will contain the image header and all the debug symbol tables for .EXE file. It is not an executable file, and cannot be run or loaded.
Put the .EXE file on your target system.
Put the .DSF file on your host system, because when you use SCD to debug code in your image, it will try to look for a .DSF file first and then look for an .EXE file. The .DSF file is better because it has symbols in it. Section 11.4, ''Setting Up the Host System'' describes how to tell SCD where to find your .DSF and .EXE files.
11.3. Setting Up the Target System for Connections
The target kernel is controlled by flags and devices specified when the system is booted, by XDELTA commands, by a configuration file, and by several system parameters. The following sections contain more information about these items.
Boot Flags
You can specify flags on the boot command line. Boot flags are specified as a hex number; each bit of the number represents a true or false value for a flag. The following flag values are relevant to the system code debugger.
8000
This is the SCD boot flag. It enables operation of the target kernel. If this SCD boot flag is not set, not only will it be impossible to use SCD to debug the system, but the additional XDELTA commands related to the target kernel will generate an XDELTA error message. If this boot flag is set, SYSTEM_DEBUG is loaded, and SCD is enabled.
0004
This is the initial breakpoint boot flag. It controls whether the system calls INI$BRK at the beginning and end of EXEC_INIT. Notice that if SCD is the default debugger, the first breakpoint is not as early as it is for XDELTA. It is delayed until immediately after the PFN database is set up.
0002
This is the XDELTA boot flag, which controls whether XDELTA is loaded. It behaves slightly differently when the SCD boot flag is also set.
If the SCD boot flag is clear, this flag simply determines if XDELTA is loaded. If the SCD boot flag is set, this flag determines whether XDELTA or the system code debugger is the default debugger. If the XDELTA flag is set, XDELTA will be the default debugger. In this state, the initial system breakpoints and any calls to INI$BRK trigger XDELTA, and you must enter an XDELTA command to start using SCD. If the XDELTA boot flag is clear, the initial breakpoints and calls to INI$BRK go to SCD. You cannot use XDELTA if the XDELTA boot flag is clear.
Boot Command
The form of the boot command varies depending on the platform and type OpenVMS system. However, all SCD boot commands have the concept of boot flags, boot device, and dedicated Ethernet device. In all environments, you must specify an Ethernet device on the target system to use to communicate with the host debugger. It is currently a restriction that this device must not be used for anything else (either for booting or network software such as DECnet, TCP/IP products, and LAT products).
To use Alpha SCD, you must specify the Ethernet device with the boot command. In this example, we are using DEC 3000 Model 400 Alpha Workstation syntax. We are booting from the DKB100 disk and using the ESA0 Ethernet device. We are also setting the SCD, XDELTA, and initial (earliest) breakpoint flags:
>>> show device
.
.
.
>>> boot dkb100,esa0 -fl 0,8006You can set these devices and flags to be the default values so that you will not have to specify them each time you boot:
>>> set bootdef_dev dkb100,esa0
>>> set boot_osflags 0,8006To use IA-64 SCD, you can specify an Ethernet device (debug_dev) BEFORE loading the Operating System and AFTER you have selected the device/partition. Setting debug_dev is sticky. That is, you only need to set it once. Using a VSI rx2600 syntax:
A sample IA-64 Boot Menu follows.
Please select a boot option
EFI Shell [Built-in]
PESOS - X8.2-AHI (Topaz BL2) on $1$DGA3890:[SYS2.]
PESOS - X8.2-AHI (Topaz BL2) on $1$DGA3890:[SYS2.] sysboot
PESOS - E8.2-ADH (Topaz BL1) on $1$DGA3891:[SYS2.]
PESOS - E8.2-ADH (Topaz BL1) on $1$DGA3891:[SYS2.] sysboot
Boot Option Maintenance Menu
System Configuration MenuSelect the EFI Shell [Built-in].
Loading.: EFI Shell [Built-in]
EFI Shell version 1.10 [14.61]
Device mapping table
fs0 : Acpi(HWP0002,100)/Pci(1|0)/Scsi(Pun0,Lun0)/HD(Part1,SigA02952
fs1 : Acpi(HWP0002,300)/Pci(1|0)/Fibre(WWN50001FE10011B15D,Lun2200)
fs2 : Acpi(HWP0002,300)/Pci(1|0)/Fibre(WWN50001FE10011B15D,Lun2200)
fs3 : Acpi(HWP0002,300)/Pci(1|0)/Fibre(WWN50001FE10011B15D,Lun2300)
.
.
.
Shell>Select the desired device/partition:
Shell> fs1:
fs1:\>Use the utilities in \efi\vms. Use vms_show to list the devices and vms_set to set Ethernet device (debug_dev), if necessary.
fs1:\> \efi\vms\vms_show device VMS: EIA0 EFI: Acpi(000222F0,0)/Pci(3|0)/Mac(00306E39F77B) VMS: DKB200 EFI: fs1: Acpi(000222F0,100)/Pci(1|1)/Scsi(Pun2,Lun0) VMS: DKB0 EFI: fs0: Acpi(000222F0,100)/Pci(1|1)/Scsi(Pun0,Lun0) VMS: EWA0 EFI: Acpi(000222F0,100)/Pci(2|0)/Mac(00306E3977C5) . . .
Set the Ethernet device.
fs1:\> \efi\vms\vms_set debug_dev eia0 VMS: EIA0 0-30-6E-39-F7-CF EFI: Acpi(000222F0,0)/Pci(3|0)/Mac(00306E39F7CF)
Finally, load the OS. In this example, the boot is with the SCD and initial (earliest) breakpoint flags using root 2 (SYS2), that will vary with system setups.
fs1:\> \efi\vms\vms_loader -flags "2,8004"
You can set the flags to be the default value instead of specifying them for each and every OS load:
fs1:\> set vms_flags "2,8004"
You can also build the entire boot device, OS load command with flags setting as a Boot Option. See the "Boot Option Maintenance Menu", described in the VSI OpenVMS System Manager's Manual, Volume 1: Essentials.
SCD Configuration File
The SCD target system reads a configuration file in SYS$SYSTEM named DBGTK$CONFIG.SYS. The first line of this file contains a default password, which must be specified by the host debug system to connect to the target. The default password may be the null string; in this case the host must supply the null string as the password (/PASSWORD="") on the connect command as described in Section 11.5, ''Starting the System Code Debugger'', or no password at all. Other lines in this file are reserved by VSI. Note that you must create this file because VSI does not supply it. If this file does not exist prior to booting with SCD enabled, you can only run SCD by specifying a default password with the XDELTA ;R command described in the following section.
XDELTA Commands
When the system is booted with both the XDELTA boot flag and the SCD boot flag, the following two additional XDELTA commands are enabled:
n\xxxx\;R ContRol SCD connection
You can use this command to do the following:Change the password which the SCD host must present
Disconnect the current session from SCD
Give control to SCD by simulating a call to INI$BRK
Any combination of these
Optional string argument xxxx specifies the password that the system code debugger must present for its connection to be accepted. If this argument is left out, the required password is unchanged. The initial password is taken from the first line of the SYS$SYSTEM:DBGTK$CONFIG.SYS file. The new password does not remain in effect across a boot of the target system.
The optional integer argument n controls the behavior of the ;R command as follows:
Value of N Action +1 Gives control to SCD by simulating a call to INI$BRK +2 Returns to XDELTA after changing the password. 2;R without a password is a no-op 0 Performs the default action -1 Changes the password, breaks any existing connection to SCD, and then simulates a call to INI$BRK (which will wait for a new connection to be established and then give control to SCD) -2 Returns to XDELTA after changing the password and breaking an existing connection Currently, the default action is the same action as +1.
If SCD is already connected, the ;R command transfers control to SCD, and optionally changes the password that must be presented the next time a system code debugger tries to make a connection. This new password does not last across a boot of the target system.
n;K Change inibrK behavior
If optional argument n is 1, future calls to INI$BRK will result in a breakpoint being taken by SCD. If the argument is 0, or no argument is specified, future calls to INI$BRK will result in a breakpoint being taken by XDELTA.
SYSTEM Parameters
BREAKPOINTS
This parameter is a bitmask, enabling existing INI$BRK calls within OpenVMS in the following situations:Bit 0 At the start of INIT Bit 1 At the end of INIT Bit 2 At the point in INIT just prior to starting secondary CPUs Bit 3 If INI$BRK is called from an outer mode Bit 4 Before calling the initialization routine of a newly-loaded executive image Bits 5-31 Reserved by VSI Notes on the use of BREAKPOINTS parameter:Calling INI$BRK from executive mode when bit 3 of BREAKPOINTS is not set will result in process exit, or a SSRVEXCEPT bugcheck (if SYSTEM_CHECK or BUGCHECKFATAL is also set).
Changing BREAKPOINTS from its default value of 3 may allow the security of the system to be compromised, and should only be used with caution.
DBGTK_SCRATCH
Bits 0 through 7 specify how many pages of memory are allocated for SCD. This memory is allocated only if system code debugging is enabled with the SCD boot flag (described earlier in this section). Usually, the default value of 1 is adequate; however, if SCD displays an error message, increase this value.
Bits 8 through 31 are reserved by VSI.
SCSNODE
Identifies the target kernel node name for SCD. See Section 11.3.1, ''Making Connections Between the Target Kernel and the System Code Debugger'' for more information.
S0_PAGING
If the image you are debugging includes pageable code or data, set S0_PAGING to 3 to ensure that such code and data are always resident in memory. SCD cannot examine, deposit to, set breakpoints at, and so on, any locations in pageable sections that are not currently valid. [This applies only to Alpha. IA-64 executive images and drivers do not contain pageable code or data.]
POOLPAGING
If the image you are debugging uses paged pool, set POOLPAGING to zero to ensure that paged pool is always resident in memory. SCD cannot examine or deposit to any locations in paged pool that are not currently valid.
- TIME_CONTROL This parameter is a bitmask, disabling certain time control functions within VMS:
Bit 0 Disables system clock Bit 1 Disables CPU sanity timeouts Bit 2 Disables CPU spinwait timeouts When XDELTA or SCD is loaded (bit 1 or bit 15 of boot flags is set), the value of TIME_CONTROL is changed from its default of zero to 6 (disable CPU sanity and CPU spinwait timeouts). This is to prevent these timeouts from occurring when the system is waiting at a breakpoint. If necessary, these settings can be altered, using the SYSGEN utility or a Deposit command within XDELTA or SCD. Bit 0 should never be set.
11.3.1. Making Connections Between the Target Kernel and the System Code Debugger
It is always SCD on the host system that initiates a connection to the target kernel. When SCD initiates this connection, the target kernel accepts or rejects the connection based on whether the remote debugger presents it with a node name and password that matches the password in the target system (either the default password from the SYS$SYSTEM:DBGTK$CONFIG.SYS file, or a different password specified via XDELTA). SCD obtains the node name from the SCSNODE system parameter.
The target kernel can accept a connection from SCD any time the system is running below IPL 22, or if XDELTA is in control (at IPL 31). However, the target kernel actually waits at IPL 31 for a connection from the SCD host in two cases: when it has no existing connection to an SCD host and (1) it receives a breakpoint caused by a call to INI$BRK (including either of the initial breakpoints), or (2) when you enter a 1;R or -1;R command to XDELTA.
11.3.2. Interactions Between XDELTA and the Target Kernel/System Code Debugger
XDELTA and the target kernel are integrated into the same system. Normally, you choose to use one or the other. However, XDELTA and the target kernel can be used together. This section explains how they interoperate.
The XDELTA boot flag controls which debugger (XDELTA or the SCD target kernel) gets control first. If it is not set, the target kernel gets control first, and it is not possible to use XDELTA without rebooting. If it is set, XDELTA gets control first, but you can use XDELTA commands to switch to the target kernel and to switch INI$BRK behavior such that the target kernel gets control when INI$BRK is called.
Breakpoints always stick to the debugger that set them; for example, if you set a breakpoint at location "A" with XDELTA, and then you enter the commands 1;K (switch INI$BRK to the system code debugger) and ;R (start using the system code debugger) then, from SCD, you can set a breakpoint at location "B". If the system executes the breakpoint at A, XDELTA reports a breakpoint, and SCD will see nothing (though you could switch to SCD by issuing the XDELTA ;R command). If the system executes the breakpoint at B, SCD will get control and report a breakpoint (you cannot switch to XDELTA from SCD).
Notice that if you examine location A with SCD, or location B with XDELTA, you will see a BPT instruction, not the instruction that was originally there. This is because neither debugger has any information about the breakpoints set by the other debugger.
One useful way to use both debuggers together is when you have a system that exhibits a failure only after hours or days of heavy use. In this case, you can boot the system with SCD enabled (8000), but with XDELTA the default (0002) and with initial breakpoints enabled (0004). When you reach the initial breakpoint, set an XDELTA breakpoint at a location that will only be reached when the error occurs. Then proceed. When the error breakpoint is reached, possibly days later, then you can set up a remote system to debug it and enter the ;R command to XDELTA to switch control to SCD.
Here is another technique to use on Alpha when you do not know where to put an error breakpoint as previously mentioned. Boot the system with only the SCD boot flag set. When you see that the error has occurred, halt the system and initiate an IPL 14 interrupt, as you would to start XDELTA. The target kernel will get control and wait for a connection for SCD.
The equivalent technique on IA-64 is as follows:
Boot the system with only the SCD flag set (bit 15). When you see that the error has occurred, type Ctrl/P at the console. This will give control to XDELTA (even though the XDELTA boot flag is not set) and you can now type 1;R. The target kernel will get control and wait for a connection for SCD.
11.3.3. Interactions between the Target Kernel, the System Code Debugger, and other system components
The target kernel must have exclusive use of its Ethernet device. Some system components, such as DECnet, will not start if the System Code Debugger is loaded. If there are multiple Ethernet devices, and the system is configured to give exclusive access of the SCD Ethernet device to the target kernel, the logical name DBGTK$OVERRIDE must be defined, indicating that the affected system components should start up as normal. The logical name can either be defined systemwide, or in the process where the startup command for the system component will be executed.
11.4. Setting Up the Host System
To set up the host system, you need access to all system images and drivers that are loaded (or can be loaded) on the target system. You should have access to a source listings kit or a copy of the following directories:
SYS$LOADABLE_IMAGES: SYS$LIBRARY: SYS$MESSAGE:
You need all the .EXE files in those directories. The .DSF files are available with the OpenVMS source listings kit.
Optionally, you need access to the source files for the images to be debugged. SCD will look for the source files in the directory where they were compiled. If your build system and host system are different, you must use the SET SOURCE command to point SCD to the location of the source code files. For an example of the SET SOURCE command, see Section 11.12, ''Sample System Code Debugging Session''.
Before making a connection to the target system, you must set up the logical name DBGHK$IMAGE_PATH, which must be set up as a search list to the area where the system images or .DSF files are kept. For example, if the copies are in the following directories:
DEVICE:[SYS$LDR] DEVICE:[SYSLIB] DEVICE:[SYSMSG]
you would define DBGHK$IMAGE_PATH as follows:
$ define dbghk$image_path DEVICE:[SYS$LDR],DEVICE:[SYSLIB],DEVICE:[SYSMSG]
This works well for debugging using all the images normally loaded on a given system. However, you might be using the debugger to test new code in an execlet or a new driver. Because that image is most likely in your default directory, you must define the logical name as follows:
$ define dbghk$image_path [],DEVICE:[SYS$LDR],DEVICE:[SYSLIB],DEVICE:[SYSMSG]
If SCD cannot find one of the images through this search path, a warning message is displayed. SCD will continue initialization as long as it finds at least two images. If SCD cannot find the SYS$BASE_IMAGE and SYS$PUBLIC_VECTORS files, which are the OpenVMS operating system's main image files, an error message is displayed and the debugger exits.
If and when this happens, check the directory for the image files and compare it to what is loaded on the target system.
11.5. Starting the System Code Debugger
To start SCD on the host side, enter the following command:
$ DEBUG/KEEP
SCD displays the DBG> prompt. With the DBGHK$IMAGE_PATH logical name defined, you can invoke the CONNECT command and the optional qualifiers /PASSWORD and /IMAGE_PATH.
To use the CONNECT command and the optional qualifiers (/PASSWORD and /IMAGE_PATH) to connect to the node with name nodename, enter the following command:
DBG> CONNECT %NODE_NAME nodename /PASSWORD="password"
If a password has been set up on the target system, you must use the /PASSWORD qualifier. If a password is not specified, a zero length string is passed to the target system as the password.
The /IMAGE_PATH qualifier is also optional. If you do not use this qualifier, SCD uses the DBGHK$IMAGE_PATH logical name as the default. The /IMAGE_PATH qualifier is a quick way to change the logical name. However, when you use it, you cannot specify a search list. You can use only a logical name or a device and directory, although the logical name can be a search list.
Usually, SCD obtains the source file name from the object file. This is put there by the compiler when the source is compiled with the /DEBUG qualifier. The SET SOURCE command can take a list of paths as a parameter. It treats them as a search list.
11.6. Summary of System Code Debugger Commands
|
In general, any OpenVMS debugger command can be used in SCD. For a complete list, refer to the VSI OpenVMS Debugger Manual. The following are a few examples:
You can also use the OpenVMS debugger command SDA to examine the target system with System Dump Analyzer semantics. This command, which is not available when debugging user programs, is described in the next section. |
11.7. Using System Dump Analyzer Commands
Once a connection has been established to the target system, you can use the commands listed in the previous section to examine the target system. You can also use some System Dump Analyzer (SDA) commands, such as SHOW SUMMARY and SHOW DEVICE. This feature allows the system programmer to take advantage of the strengths of both the OpenVMS Debugger and SDA to examine the state of the target system and to debug system programs such as device drivers.
To obtain access to SDA commands, you simply type "SDA" at the OpenVMS Debugger prompt ("DBG>") at any time after a connection has been established to the target system. SDA initializes itself and then outputs the "SDA>" prompt. Enter SDA commands as required. (See Chapter 4, "SDA Commands" for more information.) To return to the OpenVMS Debugger, you enter "EXIT" at the "SDA>" prompt. Optionally, you may invoke SDA to perform a single command and then return immediately to the OpenVMS Debugger, as in the following example:
DBG>SDA SHOW SUMMARY
You may reenter SDA at any time, with or without the optional SDA command. Once SDA has been initialized, the SDA> prompt is output more quickly on subsequent occasions.
Note that there are some limitations on the use of SDA from within SCD.
You cannot switch between processes, whether requested explicitly (SET PROCESS <name>) or implicitly (SHOW PROCESS <name>). The exception to this is that access to the system process is possible.
You cannot switch between CPUs.
SDA has no knowledge of the OpenVMS debugger's Motif or Windows interfaces. Therefore, all SDA input and output occurs at the terminal or window where the OpenVMS debugger was originally invoked. Also, while using SDA, the OpenVMS debugger window is not refreshed; you must exit SDA to allow the OpenVMS debugger window to be refreshed.
When you invoke SDA from SCD with an immediate command, and that command produces a full screen of output, SDA displays the message "Press RETURN for more." followed by the "SDA>" prompt before continuing. If you enter another SDA command at this prompt, SDA does not automatically return to SCD upon completion. To do this, you must enter an EXIT command.
11.8. System Code Debugger Network Information
The SCD host and the target kernel use a private Ethernet protocol to communicate. The best way to ensure that the two systems can see each other is for them both to be on the same Ethernet segment. Otherwise, your network and its bridges must be set up to pass through the packets with the protocol 08-00-2B-80-4B and multicast address 09-00-2B-02-01-0F.
The network portion of the target system uses the specified Ethernet device and communicates through it. The network portion of the host system finds the first Ethernet device and communicates through it. If the host SCD picks the wrong device for your needs, then you can force it to use the correct device by defining the logical DBGHK$ADAPTOR as the template device name for the appropriate adaptor.
11.9. Troubleshooting Checklist
If you have trouble starting a connection, perform the following tasks to correct the problem:
Check SCSNODE on the target system.
It must match the name you are using in the host CONNECT command.
Make sure that both the Ethernet and boot device have been specified correctly.
Make sure that the host system is using the correct Ethernet device, and that the host and target systems are connected to the same Ethernet segment.
Check the version of the operating system and make sure that both the host and target systems are running the same version of the OpenVMS operating system.
11.10. Troubleshooting Network Failures
There are three possible network errors:
NETRETRY
Indicates the system code debugger connection is lost
SENDRETRY
Indicates a message send failure
NETFAIL
Results from the two previous errors
The netfail error message has a status code that can be one of the following values:
| Value | Status |
|---|---|
| 2, 4, 6 | Internal network error, submit a problem report to VSI. |
| 8,10,14,16,18,20,26,28,34,38 | Network protocol error, submit a problem report to VSI. |
| 22,24 | Too many errors on the network device most likely due to congestion. Reduce the network traffic or switch to another network backbone. |
| 30 | Target system scratch memory not available. Check DBGTK_SCRATCH. If increasing this value does not help, submit a problem report to VSI. |
| 32 | Ran out of target system scratch memory. Increase value of DBGTK_SCRATCH. |
| All others | There should not be any other network error codes printed. If one occurs that does not match the previous ones, submit a problem report to VSI. |
11.11. Access to Symbols in OpenVMS Executive Images
Accessing OpenVMS executive images' symbols is not always straightforward with SCD. Only a subset of the symbols may be accessible at one time and in some cases, the symbol value the debugger currently has may be stale. To understand these problems and their solutions, you must understand how the debugger maintains its symbol tables and what symbols exist in the OpenVMS executive images. The following sections briefly summarize these topics.
11.11.1. Overview of How the OpenVMS Debugger Maintains Symbols
The debugger can access symbols from any image in the OpenVMS loaded system image list by reading in either the .DSF or .EXE file for that particular image. The .EXE file contains information only about symbols that are part of the symbol vector for that image. The current image symbols for any set module are defined. (You can tell if you have the .DSF or .EXE file by doing a SHOW MODULE. If there are no modules, you have the .EXE file.) This includes any symbols in the SYS$BASE_IMAGE.EXE symbol vector for which the code or data resides in the current image. However, you cannot access a symbol that is part of the SYS$BASE_IMAGE.EXE symbol vector that resides in another image.
In general, at any one point in time, the debugger can access only the symbols from one image. It does this to reduce the time it takes to search for a symbol in a table. To load the symbols for a particular image, use the SET IMAGE command. When you set an image, the debugger loads all the symbols from the new image and makes that image the current image. The symbols from the previous image are in memory, but the debugger will not look through them to translate symbols.
There is a set of modules for each image the debugger accesses. The symbol tables in the image that are part of these modules are not loaded with the SET IMAGE command. Instead they can be loaded with the SET MODULE <module-name> or SET MODULE/ALL commands. As they are loaded, a new symbol table is created in memory under the symbol table for the image. The figure below shows what this looks like.
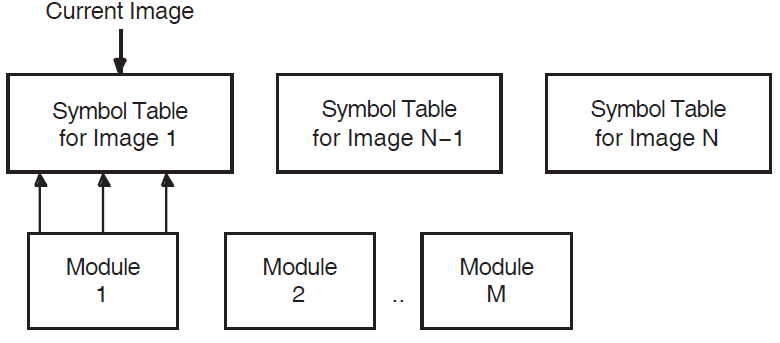
When the debugger needs to look up a symbol name, it first looks at the current image to find the information. If it does not find it there, it then looks into the appropriate module. It determines which module is appropriate by looking at the module range symbols which are part of the image symbol table.
To see the symbols that are currently loaded, use the debugger's SHOW SYMBOL command. This command has a few options to obtain more than just the symbol name and value. (See the VSI OpenVMS Debugger Manual for more details.)
11.11.2. Overview of OpenVMS Executive Image Symbols
Depending on whether the debugger has access to the .DSF or .EXE file, different kinds of symbols could be loaded. Most users will have the .EXE file for the OpenVMS executive images and a .DSF file for their private images---that is, the images they are debugging.
The OpenVMS executive consists of two base images, SYS$BASE_IMAGE.EXE and SYS$PUBLIC_VECTORS.EXE, and a number of separately loadable executive images.
The two base images contain symbol vectors. For SYS$BASE_IMAGE.EXE, the symbol vector is used to define symbols accessible by all the separately loadable images. This allows these images to communicate with each other through cross-image routine calls and memory references. For SYS$PUBLIC_VECTORS.EXE, the symbol vector is used to define the OpenVMS system services. Because these symbol vectors are in the .EXE and the .DSF files, the debugger can load these symbols no matter which one you have.
All images in the OpenVMS executive also contain global and local symbols. However, none of these symbols ever gets into the .EXE file for the image. These symbols are put in the specific module's section of the .DSF file if that module was compiled using /DEBUG and the image was linked using /DSF.
11.11.3. Possible Problems You May Encounter
Access to All Executive Image Symbols
When the current image is not SYS$BASE_IMAGE, but one of the separately loaded images, the debugger does not have access to any of the symbols in the SYS$BASE_IMAGE symbol vector. This means you cannot access (set breakpoints, and so on) any of the cross-image routines or data cells. The only symbols you have access to are the ones defined by the current image.
If the debugger has access only to the .EXE file, then only symbols that have vectors in the base image are accessible. For .DSF files, the current image symbols for any set module are defined. (You can tell if you have the .DSF or .EXE by using the SHOW MODULE command---if there are no modules you have the .EXE). This includes any symbols in the SYS$BASE_IMAGE.EXE symbol vector for which the code or data resides in the current image. However, the user cannot access a symbol that is part of the SYS$BASE_IMAGE.EXE symbol vector that resides in another image. For example, if you are in one image and you want to set a breakpoint in a cross-image routine from another image, you do not have access to the symbol. Of course, if you know in which image it is defined, you can do a SET IMAGE, SET MODULE/ALL, and then a SET BREAK.
There is a debugger workaround for this problem. The debugger and SCD let you use the SET MODULE command on an image by prefixing the image name with SHARE$ (SHARE$SYS$BASE_IMAGE, for example). This treats that image as a module which is part of the current image. In the previous figure, think of it as another module in the module list for an image. Note, however, that only the symbols for the symbol vector are loaded. None of the symbols for the modules of the SHARE$xxx image are loaded. Therefore, this command is only useful for base images.
So, in other words, by doing SET MODULE SHARE$SYS$BASE_IMAGE, the debugger gives you access to all cross-image symbols for the OpenVMS executive.
11.12. Sample System Code Debugging Session
This section provides a sample session that shows the use of some OpenVMS debugger commands as they apply to SCD. The examples in this session show how to work with C code that has been linked into the SYSTEM_DEBUG execlet. It is called as an initialization routine for SYSTEM_DEBUG.
To reproduce this sample session, the host system needs access to the SYSTEM_DEBUG.DSF matching the SYSTEM_DEBUG.EXE file on your target system, and to the source file C_TEST_ROUTINES.C, which is available in SYS$EXAMPLES. The target system is booted with the boot flags 0, 8004, so it stops at an initial breakpoint. The system disk is DKB200, and the network device is ESA0 in the Alpha examples and EIA0 in the IA-64 examples.
Note that the example displays from Example 11-5 onwards are all taken from an OpenVMS IA-64 system. On an OpenVMS Alpha system, some of the output is different, but the commands entered are the same on both platforms, except in one case, as noted in the accompanying text.
>>> b -fl 0,8004 dkb200,esa0
INIT-S-CPU...
INIT-S-RESET_TC...
INIT-S-ASIC...
INIT-S-MEM...
INIT-S-NVR...
INIT-S-SCC...
INIT-S-NI...
INIT-S-SCSI...
INIT-S-ISDN...
INIT-S-TC0...
AUDIT_BOOT_STARTS ...
AUDIT_CHECKSUM_GOOD
AUDIT_LOAD_BEGINS
AUDIT_LOAD_DONE
%SYSBOOT-I-GCTFIL, Using a configuration file to boot as a Galaxy instance.
OpenVMS (TM) Alpha Operating System, Version V8.3
© Copyright 1976-2006 Hewlett-Packard Development Company, L.P.
DBGTK: Initialization succeeded. Remote system debugging is now possible.
DBGTK: Waiting at breakpoint for connection from remote host.A sample IA-64 Boot Menu follows (long lines wrapped for clarity).
Please select a boot option
EFI Shell [Built-in]
PESOS - X8.2-AHI (Topaz BL2) on $1$DGA3890:[SYS2.]
PESOS - X8.2-AHI (Topaz BL2) on $1$DGA3890:[SYS2.] sysboot
PESOS - E8.2-ADH (Topaz BL1) on $1$DGA3891:[SYS2.]
PESOS - E8.2-ADH (Topaz BL1) on $1$DGA3891:[SYS2.] sysboot
Boot Option Maintenance Menu
System Configuration Menu
Select the "EFI Shell [Built-in]"
Loading.: EFI Shell [Built-in]
EFI Shell version 1.10 [14.61]
Device mapping table
fs0 : Acpi(HWP0002,100)/Pci(1|1)/Scsi(Pun0,Lun0)/HD(Part2,
SigB3A4A931-1F2A-11D8-9EA1-AA000400FEFF)
fs1 : Acpi(HWP0002,100)/Pci(1|1)/Scsi(Pun2,Lun0)/HD(Part1,
SigF7B864C3)
fs2 : Acpi(HWP0002,300)/Pci(1|0)/Fibre(WWN50001FE10011B15D,
Lun2200)/HD(Part1,Sig51C7BEE1-070B-11D9-8099-AA000400FEFF)
fs3 : Acpi(HWP0002,300)/Pci(1|0)/Fibre(WWN50001FE10011B15D,
Lun2200)/HD(Part4,Sig51C7BEE0-070B-11D9-809A-AA000400FEFF)
.
.
.
Shell>
Select the desired device/partion:
Shell> fs1:
fs1:\>Use the utilities in \efi\vms. Use vms_show to list the devices and vms_set to set Ethernet device (debug_dev), if necessary. Note that this set is sticky so it only needs to be done once. Then load the operating system with the desired flags. Note that Alpha and IA-64 use the same flags with the same meanings.
fs1:\> dir \efi\vms
Directory of: fs1:\efi\vms
09/13/04 10:13a <DIR> 2,048 .
09/13/04 10:13a <DIR> 2,048 ..
09/13/04 10:13a <DIR> 2,048 tools
09/13/04 10:13a 3,101,184 ipb.exe
09/13/04 10:13a <DIR> 2,048 update
09/13/04 10:13a 846,336 vms_loader.efi
09/13/04 10:13a 244,224 vms_bcfg.efi
09/13/04 10:13a 218,112 vms_set.efi
09/13/04 10:13a 215,040 vms_show.efi
5 File(s) 4,624,896 bytes
4 Dir(s)
fs1:\> \efi\vms\vms_show device
VMS: EIA0
EFI: Acpi(000222F0,0)/Pci(3|0)/Mac(00306E39F77B)
VMS: DKB200
EFI: fs1: Acpi(000222F0,100)/Pci(1|1)/Scsi(Pun2,Lun0)
VMS: DKB0
EFI: fs0: Acpi(000222F0,100)/Pci(1|1)/Scsi(Pun0,Lun0)
VMS: EWA0
EFI: Acpi(000222F0,100)/Pci(2|0)/Mac(00306E3977C5)
.
.
.
Set the debug_dev to one of the connected Ethernet devices:
fs1:\> \efi\vms\vms_set debug_dev eia0
VMS: EIA0 0-30-6E-39-F7-CF
EFI: Acpi(000222F0,0)/Pci(3|0)/Mac(00306E39F7CF)
fs1:\> \efi\vms\vms_show debug_dev
VMS: EIA0 0-30-6E-39-F7-CF
EFI: Acpi(000222F0,0)/Pci(3|0)/Mac(00306E39F7CF)
Boot up the OS. In this example, the boot is with the SCD and initial (early) breakpoint flags, using root 2 (SYS2), that will vary with system setups:
fs1:\> \efi\vms\vms_loader -flags "2,8004"
HP OpenVMS Industry Standard 64 Operating System, V8.3
© Copyright 1976-2006 Hewlett-Packard Development Company, L.P.
%EIA-I-BOOTDRIVER, Starting auto-negotiation
%EIA-I-BOOTDRIVER, Auto-negotiation selected 100BaseTX FDX
DBGTK: Initialization succeeded. Remote system debugging is now possible.
DBGTK: Waiting at breakpoint for connection from remote host.$ define dbg$decw$display " "
$ debug/keep
OpenVMS Alpha Debug64 Version V8.3-003
DBG>$ define dbg$decw$display " "
$ debug/keep
OpenVMS I64 Debug64 Version V8.3-003
DBG>Use the CONNECT command to connect to the target system. In this example, the target system's default password is the null string, and the logical name DBGHK$IMAGE_PATH is used for the image path; so the command qualifiers /PASSWORD and /IMAGE_PATH are not being used. You may need to use them.
When you have connected to the target system, the DBG> prompt is displayed. Enter the SHOW IMAGE command to see what has been loaded. Because you are reaching a breakpoint early in the boot process, there are very few images. See the example below. Notice that SYS$BASE_IMAGE has an asterisk next to it. This is the currently set image, and all symbols currently loaded in the debugger come from that image.
DBG> connect %node_name TSTSYS %DEBUG-I-INIBRK, target system interrupted DBG> show image image name set base address end address ERRORLOG no 0000000000000000 FFFFFFFFFFFFFFFF EXEC_INIT no 0000000000000000 FFFFFFFFFFFFFFFF SYS$ACPI no 0000000000000000 FFFFFFFFFFFFFFFF *SYS$BASE_IMAGE yes 0000000000000000 FFFFFFFFFFFFFFFF SYS$DKBTDRIVER no 0000000000000000 FFFFFFFFFFFFFFFF SYS$DKBTDRIVER no 0000000000000000 FFFFFFFFFFFFFFFF SYS$DKBTDRIVER no 0000000000000000 FFFFFFFFFFFFFFFF SYS$EGBTDRIVER no 0000000000000000 FFFFFFFFFFFFFFFF SYS$OPDRIVER no 0000000000000000 FFFFFFFFFFFFFFFF SYS$PKMBTDRIVER no 0000000000000000 FFFFFFFFFFFFFFFF SYS$PKMBTDRIVER no 0000000000000000 FFFFFFFFFFFFFFFF SYS$PKMBTDRIVER no 0000000000000000 FFFFFFFFFFFFFFFF SYS$PLATFORM_SUPPORT no 0000000000000000 FFFFFFFFFFFFFFFF SYS$PUBLIC_VECTORS no 0000000000000000 FFFFFFFFFFFFFFFF SYS$SRBTDRIVER no 0000000000000000 FFFFFFFFFFFFFFFF SYSTEM_DEBUG no 0000000000000000 FFFFFFFFFFFFFFFF SYSTEM_PRIMITIVES no 0000000000000000 FFFFFFFFFFFFFFFF SYSTEM_SYNCHRONIZATION no 0000000000000000 FFFFFFFFFFFFFFFF total images: 18 DBG>
The example below shows the target system's console display during the connect sequence. Note that for security reasons, the name of the host system, the user's name, and process ID are displayed.
DBGTK: Connection attempt from host HSTSYS user GUEST process 2E801C2F DBGTK: Connection attempt succeeded
To set a breakpoint at the first routine in the C_TEST_ROUTINES module of the SYSTEM_DEBUG.EXE execlet, do the following:
Load the symbols for the SYSTEM_DEBUG image with the DEBUG SET IMAGE command.
Use the SET MODULE command to obtain the symbols for the module.
Set the language to be C and set a breakpoint at the routine test_c_code.
The language must be set because C is case sensitive and test_c_code needs to be specified in lowercase. The language is normally set to the language of the main image, in this example SYS$BASE_IMAGE.EXE. Currently that is not C.
DBG> set image system_debug %DEBUG-I-DYNLNGSET, setting language IMACRO DBG> show module module name symbols language size AUX_TARGET no C 0 BUFSRV_TARGET no C 0 BUGCHECK_CODES no BLISS 0 C_TEST_ROUTINES no C 0 LIB$$UNWIND_WEAK no BLISS 0 LIB$EF no IMACRO 0 LIB$MALLOC no C 0 LIB$MALLOC_64 no C 0 LINMGR_TARGET no C 0 OBJMGR no C 0 PLUMGR no C 0 POOL no C 0 PROTOMGR_TARGET no C 0 SOCMGR no C 0 SYS$DOINIT yes IMACRO 122526 TMRMGR_TARGET no C 0 total modules: 16 DBG> set module c_test_routines DBG> show module c_test_routines module name symbols size C_TEST_ROUTINES yes 5672 total C modules: 1 DBG> set language c DBG> show symbol test_c_code* routine C_TEST_ROUTINES\test_c_code routine C_TEST_ROUTINES\test_c_code2 routine C_TEST_ROUTINES\test_c_code3 routine C_TEST_ROUTINES\test_c_code4 routine C_TEST_ROUTINES\test_c_code5 DBG> set break test_c_code
Now that the breakpoint is set, you can proceed and activate the breakpoint. When that occurs, the debugger tries to open the source code for that location in the same place as where the module was compiled. Because that is not the same place as on your system, you need to tell the debugger where to find the source code. This is done with the debugger's SET SOURCE command, which takes a search list as a parameter so you can make it point to many places.
DBG> set source/latest sys$examples,sys$library DBG> go break at routine C_TEST_ROUTINES\test_c_code 113: x = c_test_array[0];
Now that the debugger has access to the source, you can put the debugger into screen mode to see exactly where you are and the code surrounding it.
DBG> Set Mode Screen; Set Step Nosource
- SRC: module C_TEST_ROUTINES -scroll-source------------------------------------
98: c_test_array[5] = in64;
99: c_test_array[6] = in32;
100: if (c_test_array[9] > 0)
101: *pVar = (*pVar + c_test_array[17]) & c_test_array[9];
102: else
103: *pVar = (*pVar + c_test_array[17]);
104: c_test_array[7] = test_c_code3(10);
105: c_test_array[3] = test;
106: return c_test_array[23];
107: }
108: void test_c_code(void)
109: {
110: int x,y;
111: __int64 x64,y64;
112:
-> 113: x = c_test_array[0];
114: y = c_test_array[1];
115: x64 = c_test_array[2];
116: y64 = c_test_array[3];
117: c_test_array[14] = test_c_code2(x64+y64,x+y,x64+x,&y64);
118: test_c_code4();
119: return;
120: }
- OUT -output-------------------------------------------------------------------
- PROMPT -error-program-prompt--------------------------------------------------
DBG>Now, you want to set another breakpoint inside the test_c_code3 routine. You use the debugger's SCROLL/UP command (8 on the keypad) to move to that routine and see that line 93 would be a good place to set the breakpoint. It is at a recursive call. Then you proceed to that breakpoint with the GO command.
- SRC: module C_TEST_ROUTINES -scroll-source------------------------------------
80: void test_c_code4(void)
81: {
82: int i,k;
83: for(k=0;k<1000;k++)
84: {
85: test_c_code5(&i);
86: }
87: return;
88: }
89: int test_c_code3(int subrtnCount)
90: {
91: subrtnCount = subrtnCount - 1;
92: if (subrtnCount != 0)
93: subrtnCount = test_c_code3(subrtnCount);
94: return subrtnCount;
95: }
96: int test_c_code2(__int64 in64,int in32, __int64 test, __int64* pVar)
97: {
98: c_test_array[5] = in64;
99: c_test_array[6] = in32;
100: if (c_test_array[9] > 0)
101: *pVar = (*pVar + c_test_array[17]) & c_test_array[9];
102: else
- OUT -output-------------------------------------------------------------------
- PROMPT -error-program-prompt--------------------------------------------------
DBG> Scroll/Up
DBG> set break %line 93
DBG> go
DBG>When you reach that breakpoint, the source code display is updated to show where you currently are, which is indicated by an arrow. A message also appears in the OUT display indicating you reach the breakpoint at that line.
- SRC: module C_TEST_ROUTINES -scroll-source------------------------------------
82: int i,k;
83: for(k=0;k<1000;k++)
84: {
85: test_c_code5(&i);
86: }
87: return;
88: }
89: int test_c_code3(int subrtnCount)
90: {
91: subrtnCount = subrtnCount - 1;
92: if (subrtnCount != 0)
-> 93: subrtnCount = test_c_code3(subrtnCount);
94: return subrtnCount;
95: }
96: int test_c_code2(__int64 in64,int in32, __int64 test, __int64* pVar)
97: {
98: c_test_array[5] = in64;
99: c_test_array[6] = in32;
100: if (c_test_array[9] > 0)
101: *pVar = (*pVar + c_test_array[17]) & c_test_array[9];
102: else
103: *pVar = (*pVar + c_test_array[17]);
104: c_test_array[7] = test_c_code3(10);
- OUT -output-------------------------------------------------------------------
break at C_TEST_ROUTINES\test_c_code3\%LINE 93
- PROMPT -error-program-prompt--------------------------------------------------
DBG> Scroll/Up
DBG> set break %line 93
DBG> go
DBG>Now you try the debugger's STEP command. The default behavior for STEP is STEP/OVER, unlike XDELTA and DELTA, which is STEP/INTO, so, normally you would expect to step to line 94 in the code. However, because you have a breakpoint inside test_c_code3 that is called at line 93, you will reach that event first.
- SRC: module C_TEST_ROUTINES -scroll-source------------------------------------
82: int i,k;
83: for(k=0;k<1000;k++)
84: {
85: test_c_code5(&i);
86: }
87: return;
88: }
89: int test_c_code3(int subrtnCount)
90: {
91: subrtnCount = subrtnCount - 1;
92: if (subrtnCount != 0)
-> 93: subrtnCount = test_c_code3(subrtnCount);
94: return subrtnCount;
95: }
96: int test_c_code2(__int64 in64,int in32, __int64 test, __int64* pVar)
97: {
98: c_test_array[5] = in64;
99: c_test_array[6] = in32;
100: if (c_test_array[9] > 0)
101: *pVar = (*pVar + c_test_array[17]) & c_test_array[9];
102: else
103: *pVar = (*pVar + c_test_array[17]);
104: c_test_array[7] = test_c_code3(10);
- OUT -output-------------------------------------------------------------------
break at C_TEST_ROUTINES\test_c_code3\%LINE 93
break at C_TEST_ROUTINES\test_c_code3\%LINE 93
- PROMPT -error-program-prompt--------------------------------------------------
DBG>
DBG> set break %line 93
DBG> go
DBG> Step
DBG>Now, you try a couple of other commands, EXAMINE and SHOW CALLS. The EXAMINE command allows you to look at all the C variables. Note that the C_TEST_ROUTINES module is compiled with the /NOOPTIMIZE switch which allows access to all variables. The SHOW CALLS command shows you the call sequence from the beginning of the stack. In this case, you started out in the image EXEC_INIT. (The debugger prefixes all images other than the main image with SHARE$ so it shows up as SHARE$EXEC_INIT. The suffix _CODE0 is appended if the executive image is sliced.)
- SRC: module C_TEST_ROUTINES -scroll-source------------------------------------
82: int i,k;
83: for(k=0;k<1000;k++)
84: {
85: test_c_code5(&i);
86: }
87: return;
88: }
89: int test_c_code3(int subrtnCount)
90: {
91: subrtnCount = subrtnCount - 1;
92: if (subrtnCount != 0)
-> 93: subrtnCount = test_c_code3(subrtnCount);
94: return subrtnCount;
95: }
96: int test_c_code2(__int64 in64,int in32, __int64 test, __int64* pVar)
97: {
98: c_test_array[5] = in64;
99: c_test_array[6] = in32;
100: if (c_test_array[9] > 0)
101: *pVar = (*pVar + c_test_array[17]) & c_test_array[9];
102: else
103: *pVar = (*pVar + c_test_array[17]);
104: c_test_array[7] = test_c_code3(10);
- OUT -output-------------------------------------------------------------------
C_TEST_ROUTINES\test_c_code3\subrtnCount: 8
module name routine name line rel PC abs PC
*C_TEST_ROUTINES test_c_code3 93 0000000000000DC0 FFFFFFFF800BAFC0
*C_TEST_ROUTINES test_c_code3 93 0000000000000DE0 FFFFFFFF800BAFE0
*C_TEST_ROUTINES test_c_code2 104 0000000000000F40 FFFFFFFF800BB140
*C_TEST_ROUTINES test_c_code 117 00000000000010B0 FFFFFFFF800BB2B0
XDT$INIT 00000000000015C0 FFFFFFFF880955C0
*SYS$DOINIT EXE$INITIALIZE 1973 0000000000000360 FFFFFFFF88094360
SHARE$EXEC_INIT_CODE0 000000000005C240 FFFFFFFF803BB640
SHARE$EXEC_INIT_CODE0 0000000000057F20 FFFFFFFF803B7320
SHARE$EXEC_INIT_CODE0 0000000000047850 FFFFFFFF803A6C50
SHARE$EXEC_INIT_CODE0 0000000000042E90 FFFFFFFF803A2290
- PROMPT -error-program-prompt--------------------------------------------------
DBG> set break %line 93
DBG> go
DBG> Step
DBG> examine subrtnCount
DBG> show calls
DBG>If you want to proceed because you are done debugging this code, first cancel all the breakpoints and then enter the GO command. Notice, however, that you do not keep running but receive a message that you have stepped to line 94. This happens because the STEP command used earlier never completed. It was interrupted by the breakpoint on line 93.
Note that the debugger remembers all step events and only removes them once they have completed.
- SRC: module C_TEST_ROUTINES -scroll-source------------------------------------
83: for(k=0;k<1000;k++)
84: {
85: test_c_code5(&i);
86: }
87: return;
88: }
89: int test_c_code3(int subrtnCount)
90: {
91: subrtnCount = subrtnCount - 1;
92: if (subrtnCount != 0)
93: subrtnCount = test_c_code3(subrtnCount);
-> 94: return subrtnCount;
95: }
96: int test_c_code2(__int64 in64,int in32, __int64 test, __int64* pVar)
97: {
98: c_test_array[5] = in64;
99: c_test_array[6] = in32;
100: if (c_test_array[9] > 0)
101: *pVar = (*pVar + c_test_array[17]) & c_test_array[9];
102: else
103: *pVar = (*pVar + c_test_array[17]);
104: c_test_array[7] = test_c_code3(10);
105: c_test_array[3] = test;
- OUT -output-------------------------------------------------------------------
module name routine name line rel PC abs PC
*C_TEST_ROUTINES test_c_code3 93 0000000000000DC0 FFFFFFFF800BAFC0
*C_TEST_ROUTINES test_c_code3 93 0000000000000DE0 FFFFFFFF800BAFE0
*C_TEST_ROUTINES test_c_code2 104 0000000000000F40 FFFFFFFF800BB140
*C_TEST_ROUTINES test_c_code 117 00000000000010B0 FFFFFFFF800BB2B0
XDT$INIT 00000000000015C0 FFFFFFFF880955C0
*SYS$DOINIT EXE$INITIALIZE 1973 0000000000000360 FFFFFFFF88094360
SHARE$EXEC_INIT_CODE0 000000000005C240 FFFFFFFF803BB640
SHARE$EXEC_INIT_CODE0 0000000000057F20 FFFFFFFF803B7320
SHARE$EXEC_INIT_CODE0 0000000000047850 FFFFFFFF803A6C50
SHARE$EXEC_INIT_CODE0 0000000000042E90 FFFFFFFF803A2290
stepped to C_TEST_ROUTINES\test_c_code3\%LINE 94
- PROMPT -error-program-prompt--------------------------------------------------
DBG> Step
DBG> examine subrtnCount
DBG> show calls
DBG> cancel break/all
DBG> go
DBG>The STEP/RETURN command, a different type of step command, single steps assembly code until it finds a return instruction. This command is useful if you want to see the return value for the routine, which is done here by examining the R0 register on Alpha, or the R8 register on IA-64.
For more information about using other STEP command qualifiers, see the VSI OpenVMS Debugger Manual.
- SRC: module C_TEST_ROUTINES -scroll-source------------------------------------
83: for(k=0;k<1000;k++)
84: {
85: test_c_code5(&i);
86: }
87: return;
88: }
89: int test_c_code3(int subrtnCount)
90: {
91: subrtnCount = subrtnCount - 1;
92: if (subrtnCount != 0)
93: subrtnCount = test_c_code3(subrtnCount);
-> 94: return subrtnCount;
95: }
96: int test_c_code2(__int64 in64,int in32, __int64 test, __int64* pVar)
97: {
98: c_test_array[5] = in64;
99: c_test_array[6] = in32;
100: if (c_test_array[9] > 0)
101: *pVar = (*pVar + c_test_array[17]) & c_test_array[9];
102: else
103: *pVar = (*pVar + c_test_array[17]);
104: c_test_array[7] = test_c_code3(10);
105: c_test_array[3] = test;
- OUT -output-------------------------------------------------------------------
*C_TEST_ROUTINES test_c_code3 93 0000000000000DE0 FFFFFFFF800BAFE0
*C_TEST_ROUTINES test_c_code2 104 0000000000000F40 FFFFFFFF800BB140
*C_TEST_ROUTINES test_c_code 117 00000000000010B0 FFFFFFFF800BB2B0
XDT$INIT 00000000000015C0 FFFFFFFF880955C0
*SYS$DOINIT EXE$INITIALIZE 1973 0000000000000360 FFFFFFFF88094360
SHARE$EXEC_INIT_CODE0 000000000005C240 FFFFFFFF803BB640
SHARE$EXEC_INIT_CODE0 0000000000057F20 FFFFFFFF803B7320
SHARE$EXEC_INIT_CODE0 0000000000047850 FFFFFFFF803A6C50
SHARE$EXEC_INIT_CODE0 0000000000042E90 FFFFFFFF803A2290
stepped to C_TEST_ROUTINES\test_c_code3\%LINE 94
stepped on return from C_TEST_ROUTINES\test_c_code3\%LINE 94 to C_TEST_ROUTINES\test_c_code3\%LINE 94+17
C_TEST_ROUTINES\test_c_code3\%R8: 0
- PROMPT -error-program-prompt--------------------------------------------------
DBG> show calls
DBG> cancel break/all
DBG> go
DBG> step/return
DBG> examine r8
DBG>After you finish the SCD session, enter the GO command to leave this module. You will encounter another INI$BRK breakpoint at the end of EXEC_INIT. An error message is displayed indicating there are no source lines, because debug information on INI$BRK is not available.
Also notice that there is no message in the OUT display for this event. That is because INI$BRKs are special breakpoints that are handled as SS$_DEBUG signals. They are a method for the system code to break into the debugger and there is no real breakpoint in the code.
Enter the SHOW IMAGE command. You will see more images displayed as the boot path has progressed further.
Finally, enter GO, allowing the target system to boot completely, because there are no more breakpoints in the boot path. The debugger will wait for another event to occur.
- SRC: module C_TEST_ROUTINES -scroll-source------------------------------------
83: for(k=0;k<1000;k++)
84: {
85: test_c_code5(&i);
86: }
87: return;
88: }
89: int test_c_code3(int subrtnCount)
90: {
91: subrtnCount = subrtnCount - 1;
92: if (subrtnCount != 0)
93: subrtnCount = test_c_code3(subrtnCount);
-> 94: return subrtnCount;
95: }
96: int test_c_code2(__int64 in64,int in32, __int64 test, __int64* pVar)
97: {
98: c_test_array[5] = in64;
99: c_test_array[6] = in32;
100: if (c_test_array[9] > 0)
101: *pVar = (*pVar + c_test_array[17]) & c_test_array[9];
102: else
103: *pVar = (*pVar + c_test_array[17]);
104: c_test_array[7] = test_c_code3(10);
105: c_test_array[3] = test;
- OUT -output-------------------------------------------------------------------
SYS$UTC_SERVICES no 0000000000000000 FFFFFFFFFFFFFFFF
SYS$VM no 0000000000000000 FFFFFFFFFFFFFFFF
SYS$XFCACHE_MON no 0000000000000000 FFFFFFFFFFFFFFFF
SYSDEVICE no 0000000000000000 FFFFFFFFFFFFFFFF
SYSGETSYI no 0000000000000000 FFFFFFFFFFFFFFFF
SYSLDR_DYN no 0000000000000000 FFFFFFFFFFFFFFFF
SYSLICENSE no 0000000000000000 FFFFFFFFFFFFFFFF
SYSTEM_DEBUG yes 0000000000000000 FFFFFFFFFFFFFFFF
SYSTEM_PRIMITIVES no 0000000000000000 FFFFFFFFFFFFFFFF
SYSTEM_SYNCHRONIZATION no 0000000000000000 FFFFFFFFFFFFFFFF
total images: 53
- PROMPT -error-program-prompt--------------------------------------------------
DBG> go
%DEBUG-I-INIBRK, target system interrupted
%DEBUG-I-DYNIMGSET, setting image SYS$BASE_IMAGE
%DEBUG-W-SCRNOSRCLIN, No source line for address: FFFFFFFF80000310
DBG> show image
DBG> goChapter 12. OpenVMS System Dump Debugger
This chapter describes the OpenVMS System Dump Debugger (SDD) and how you can use it to analyze system crash dumps.
SDD is similar in concept to SCD as described in Chapter 11, "OpenVMS System Code Debugger". Where SCD allows connection to a running system with control of the system's execution and the examination and modification of variables, SDD allows analysis of memory as recorded in a system dump.
Use of the SDD usually involves two systems, although all the required environment can be set up on a single system. The description that follows assumes that two systems are being used:
The build system, where the image that causes the system crash has been built
The test system, where the image is executed and the system crash occurs
In common with SCD, the OpenVMS debugger's user interface allows you to specify variable names, routine names, and so on, precisely as they appear in your source code. Also, SDD can display the source code where the software was executing at the time of the system crash.
SDD recognizes the syntax, data typing, operators, expressions, scoping rules, and other constructs of a given language. If your code or driver is written in more than one language, you can change the debugging context from one language to another during a debugging session.
To use SDD, you must do the following:
Build the system image or device driver that is causing the system crash.
Boot a system, including the system image or device driver, and perform the necessary steps to cause the system crash.
Reboot the system and save the dump file.
Invoke SDD, which is integrated with the OpenVMS debugger.
The following sections cover these tasks in more detail, describe the available user-interface options, summarize applicable OpenVMS Debugger commands, and provide a sample SDD session.
12.1. User-Interface Options
SDD has the following user-interface options.
A DECwindows Motif interface for workstations.
When using this interface, you interact with SDD by using a mouse and pointer to choose items from menus, click on buttons, select names in windows, and so on.
Note that you can also use OpenVMS Debugger commands with the DECwindows Motif interface.
A character cell interface for terminals and workstations.
When using this interface, you interact with SDD by entering commands at a prompt. The sections in this chapter describe how to use the system dump debugger with the character cell interface.
For more information about using the OpenVMS DECwindows Motif interface and OpenVMS Debugger commands with SDD, see the VSI OpenVMS Debugger Manual.
12.2. Preparing a System Dump to Be Analyzed
To prepare a system dump for analysis, perform the following steps:
Compile the sources you will want to analyze, and use the /DEBUG (mandatory) and /NOOPT (preferred) qualifiers.
Note
Because you are analyzing a snapshot of the system, it is not as vital to use unoptimized code as it is with the system code debugger. But note that you cannot access all variables. SDD may report that they are optimized away.
Link your image using the /DSF (debug symbol file) qualifier. Do not use the /DEBUG qualifier, which is for debugging user programs. The /DSF qualifier takes an optional filename argument similar to the /EXE qualifier. For more information, see the VSI OpenVMS Linker Utility Manual. If you specify a name in the /EXE qualifier, you will need to specify the same name for the /DSF qualifier. For example, you would use the following command:
$ LINK/EXE=EXE$:MY_EXECLET/DSF=EXE$:MY_EXECLET OPTIONS_FILE/OPT
The .DSF and .EXE file names must be the same. Only the extensions will be different, that is, .DSF and .EXE.
The contents of the .EXE file should be exactly the same as if you had linked without the /DSF qualifier. The .DSF file will contain the image header and all the debug symbol tables for .EXE file. It is not an executable file, and cannot be run or loaded.
Put the .EXE file on your test system.
Boot the test system and perform the necessary steps to cause the system crash.
Reboot the test system and copy the dump to the build system using the System Dump Analyzer (SDA) command COPY. See Chapter 4, "SDA Commands".
12.3. Setting Up the Test System
The only requirement for the test system is that the .DSF file matching the .EXE file that causes the crash is available on the build system.
There are no other steps necessary in the setup of the test system. With the system image copied to the test system, it can be booted in any way necessary to produce the system crash. Since SDD can analyze most system crash dumps, any system can be used, from a standalone system to a member of a production cluster.
Note
It is assumed that the test system has a dump file large enough for the system dump to be recorded. Any dump style may be used (full or selective, compressed or uncompressed). A properly AUTOGENed system will meet these requirements.
12.4. Setting Up the Build System
To set up the build system, you need access to all system images and drivers that were loaded on the test system. You should have access to a source listings kit or a copy of the following directories:
SYS$LOADABLE_IMAGES: SYS$LIBRARY: SYS$MESSAGE:
You need all the .EXE files in those directories. The .DSF files are available with the OpenVMS source listings kits.
Optionally, you need access to the source files for the images to be debugged. SDD will look for the source files in the directory where they were compiled. You must use the SET SOURCE command to point SDD to the location of the source code files if they are not in the directories used when the image was built. For an example of the SET SOURCE command, see Section 12.9, ''Access to Symbols in OpenVMS Executive Images''.
Before you can analyze a system dump with SDD, you must set up the logical name DBGHK$IMAGE_PATH, which must be set up as a search list to the area where the system images or .DSF files are kept. For example, if the copies are in the following directories:
DEVICE:[SYS$LDR] DEVICE:[SYSLIB] DEVICE:[SYSMSG]
you would define DBGHK$IMAGE_PATH as follows:
$ define dbghk$image_path DEVICE:[SYS$LDR],DEVICE:[SYSLIB],DEVICE:[SYSMSG]
This works well for analyzing a system dump using all the images normally loaded on a given system. However, you might be using SDD to analyze new code either in an execlet or a new driver. Because that image is most likely in your default directory, you must define the logical name as follows:
$ define dbghk$image_path [],DEVICE:[SYS$LDR],DEVICE:[SYSLIB],DEVICE:[SYSMSG]
If SDD cannot find one of the images through this search path, a warning message is displayed. SDD will continue initialization as long as it finds at least two images. If SDD cannot find the SYS$BASE_IMAGE and SYS$PUBLIC_VECTORS files, which are the OpenVMS operating system's main image files, an error message is displayed and the debugger exits.
If and when this happens, check the directory for the image files and compare it to what was loaded on the test system.
12.5. Starting the System Dump Debugger
To start SDD on the build system, enter the following command.
$ DEBUG/KEEP
SDD displays the DBG> prompt. With the DBGHK$IMAGE_PATH logical name defined, you can invoke the ANALYZE/CRASH_DUMP command and optional qualifier /IMAGE_PATH.
To use the ANALYZE/CRASH_DUMP command and optional qualifier (/IMAGE_PATH) to analyze the dump in file <file-name> enter the following command:
DBG> ANALYZE/CRASH_DUMP file-name
The /IMAGE_PATH qualifier is optional. If you do not use this qualifier, SDD uses the DBGHK$IMAGE_PATH logical name as the default. The /IMAGE_PATH qualifier is a quick way to change the logical name. However, when you use it, you cannot specify a search list. You can use only a logical name or a device and directory, although the logical name can be a search list.
Usually, SDD obtains the source file name from the object file. This is put there by the compiler when the source is compiled with the /DEBUG qualifier. The SET SOURCE command can take a list of paths as a parameter. It treats them as a search list.
12.6. Summary of System Dump Debugger Commands
Only a subset of OpenVMS debugger commands can be used in SDD. The following are a few examples of commands that you can use in SDD:
Commands to manipulate the source display, such as TYPE and SCROLL
Commands used in OpenVMS debugger command programs, such as DO and IF
Commands that affect output formats, such as SET RADIX
Commands that manipulate symbols and scope, such as EVALUATE, SET LANGUAGE, and CANCEL SCOPE
Commands that read the contents of memory and registers, such as EXAMINE
Examples of commands that cannot be used in SDD are as follows:
Commands that cause code to be executed, such as STEP and GO
Commands that manipulate breakpoints, such as SET BREAK and CANCEL BREAK
Commands that modify memory or registers, such as DEPOSIT
You can also use the OpenVMS debugger command SDA to examine the system dump with System Dump Analyzer semantics. This command, which is not available when debugging user programs, is described in the next section.
12.7. Using System Dump Analyzer Commands
Once a dump file has been opened, you can use the commands listed in the previous section to examine the system dump. You can also use some System Dump Analyzer (SDA) commands, such as SHOW SUMMARY and SHOW DEVICE. This feature allows the system programmer to take advantage of the strengths of both the OpenVMS Debugger and SDA to examine the system dump and to debug system programs such as device drivers, without having to invoke both the OpenVMS debugger and SDA separately.
To obtain access to SDA commands, you simply type "SDA" at the OpenVMS Debugger prompt ("DBG>") at any time after the dump file has been opened. SDA initializes itself and then outputs the "SDA>" prompt. Enter SDA commands as required. (See Chapter 4, "SDA Commands" for more information.) To return to the OpenVMS Debugger, you enter "EXIT" at the "SDA>" prompt. Optionally, you may invoke SDA to perform a single command and then return immediately to the OpenVMS Debugger, as in the following example:
DBG> SDA SHOW SUMMARY
SDA may be reentered at any time, with or without the optional SDA command. Once SDA has been initialized, the SDA> prompt is output more quickly on subsequent occasions.
Note that there are some limitations on the use of SDA from within SDD:
You cannot switch between processes, whether requested explicitly (SET PROCESS <name>) or implicitly (SHOW PROCESS <name>). The exception to this is that access to the system process is possible.
You cannot switch between CPUs.
SDA has no knowledge of the OpenVMS debugger's Motif or Windows interfaces. Therefore, all SDA input and output occurs at the terminal or window where the OpenVMS debugger was originally invoked. Also, while using SDA, the OpenVMS debugger window is not refreshed; you must exit SDA to allow the OpenVMS debugger window to be refreshed.
When you invoke SDA from SDD with an immediate command, and that command produces a full screen of output, SDA displays the message "Press RETURN for more." followed by the "SDA>" prompt before continuing. At this prompt, if you enter another SDA command, SDA does not automatically return to SDD upon completion. To do this, you must enter an EXIT command.
If the need arises to switch between processes or CPUs in the system dump, then you must invoke SDA separately using the DCL command ANALYZE/CRASH_DUMP.
12.8. Limitations of the System Dump Debugger
SDD provides a narrow window into the context of the system that was current at the time that the system crashed (stack, process, CPU, and so on). It does not provide full access to every part of the system as is provided by SDA. However, it does provide a view of the failed system using the semantics of the OpenVMS debugger---source correlation and display, call frame traversal, examination of variables by name, language constructs, and so on.
SDD therefore provides an additional approach to analyzing system dumps that is difficult to realize with SDA, often allowing quicker resolution of system crashes than is possible with SDA alone. When SDD cannot provide the needed data from the system dump, you should use SDA instead.
12.9. Access to Symbols in OpenVMS Executive Images
For a discussion and explanation of how the OpenVMS debugger accesses symbols in OpenVMS executive images, see Section 11.11, ''Access to Symbols in OpenVMS Executive Images''.
12.10. Sample System Dump Debugging Session
This section provides a sample session that shows the use of some OpenVMS debugger commands as they apply to the system dump debugger. The examples in this section show how to work with a dump created as follows:
Follow the steps in Section 11.12, ''Sample System Code Debugging Session'', up to and including Example 11.9, ''Using the Set Mode Screen Command'' (Using the Set Mode Screen Command).
Enter the following OpenVMS Debugger commands:
DBG> SET BREAK TEST_C_CODE5 DBG> GO DBG> DEPOSIT K=0 DBG> GO
The system then crashes and a dump is written.
When the system reboots, copy the contents of SYS$SYSTEM:SYSDUMP.DMP to the build system with SDA:
$ analyze/crash sys$system:sysdump.dmp
OpenVMS (TM) system dump analyzer ...analyzing a selective memory dump... %SDA-W-NOTSAVED, global pages not saved in the dump file Dump taken on 1-JAN-1998 00:00:00.00 INVEXCEPTN, Exception while above ASTDEL SDA> copy hstsys::sysdump.dmp SDA>
To reproduce this sample session, you need access to the SYSTEM_DEBUG.DSF matching the SYSTEM_DEBUG.EXE file on your test system and to the source file C_TEST_ROUTINES.C, which is available in SYS$EXAMPLES.
The example begins by invoking the system dump debugger's character cell interface on the build system.
Note that the example displays from Example 12-1 onwards are all taken from an OpenVMS IA-64 system. On an OpenVMS Alpha system, some of the output is different, but the commands entered are the same on both platforms.
$ define dbg$decw$display " "
$ debug/keep
OpenVMS I64 Debug64 Version V8.3-003
DBG>Use the ANALYZE/CRASH_DUMP command to open the system dump. In this example, the logical name DBGHK$IMAGE_PATH is used for the image path, so the command qualifier /IMAGE_PATH is not being used. You may need to use it.
When you have opened the dump file, the DBG> prompt is displayed. You should now do the following:
Set the language to be C, the language of the module that was active at the time of the system crash.
Set the source directory to the location of the source of the module. Use the debugger's SET SOURCE command, which takes a search list as a parameter so you can make it point to many places.
DBG> analyze/crash_dump sysdump.dmp %SDA-W-NOTSAVED, global pages not saved in the dump file %DEBUG-I-INIBRK, target system interrupted %DEBUG-I-DYNIMGSET, setting image SYSTEM_DEBUG %DEBUG-I-DYNMODSET, setting module C_TEST_ROUTINES DBG> set language c DBG> set source/latest sys$examples,sys$library DBG>
Now that the debugger has access to the source, you can put the debugger into screen mode to see exactly where you are and the code surrounding it.
DBG> Set Mode Screen; Set Step Nosource
- SRC: module C_TEST_ROUTINES -scroll-source------------------------------------
67:
68: /* We want some global data cells */
69: volatile __int64 c_test_array[34];
70:
71: void test_c_code5(int *k)
72: {
73: int i;
74: char str[100];
75: for(i=0;i<100;i++)
76: str[i]= 'a';
77: str[99]=0;
-> 78: *k = 9;
79: }
80: void test_c_code4(void)
81: {
82: int i,k;
83: for(k=0;k<1000;k++)
84: {
85: test_c_code5(&i);
86: }
87: return;
88: }
89: int test_c_code3(int subrtnCount)
- OUT -output-------------------------------------------------------------------
- PROMPT -error-program-prompt--------------------------------------------------
%DEBUG-I-SCRNOTORIGSRC, original version of source file not found for display in SRC
file used is SYS$COMMON:[SYSHLP.EXAMPLES]C_TEST_ROUTINES.C;1
DBG>Now, you try a couple of other commands, EXAMINE and SHOW CALLS. The EXAMINE command allows you to look at all the C variables. Note that the C_TEST_ROUTINES module is compiled with the /NOOPTIMIZE switch which allows access to all variables. The SHOW CALLS command shows you the call sequence from the beginning of the stack. In this case, you started out in the image EXEC_INIT. (The debugger prefixes all images other than the main image with SHARE$ so it shows up as SHARE$EXEC_INIT.)
DBG> Set Mode Screen; Set Step Nosource
- SRC: module C_TEST_ROUTINES -scroll-source------------------------------------
67:
68: /* We want some global data cells */
69: volatile __int64 c_test_array[34];
70:
71: void test_c_code5(int *k)
72: {
73: int i;
74: char str[100];
75: for(i=0;i<100;i++)
76: str[i]= 'a';
77: str[99]=0;
-> 78: *k = 9;
79: }
80: void test_c_code4(void)
81: {
82: int i,k;
83: for(k=0;k<1000;k++)
84: {
85: test_c_code5(&i);
86: }
87: return;
88: }
89: int test_c_code3(int subrtnCount)
- OUT -output-------------------------------------------------------------------
C_TEST_ROUTINES\test_c_code5\i: 100
C_TEST_ROUTINES\test_c_code5\k: 0
module name routine name line rel PC abs PC
*C_TEST_ROUTINES test_c_code5 78 0000000000000CD0 FFFFFFFF800BAED0
*C_TEST_ROUTINES test_c_code4 85 0000000000000D60 FFFFFFFF800BAF60
*C_TEST_ROUTINES test_c_code 118 00000000000010D0 FFFFFFFF800BB2D0
XDT$INIT 00000000000015C0 FFFFFFFF880955C0
*SYS$DOINIT EXE$INITIALIZE 1973 0000000000000360 FFFFFFFF88094360
SHARE$EXEC_INIT_CODE0 000000000005C240 FFFFFFFF803BB640
SHARE$EXEC_INIT_CODE0 0000000000057F20 FFFFFFFF803B7320
SHARE$EXEC_INIT_CODE0 0000000000047850 FFFFFFFF803A6C50
SHARE$EXEC_INIT_CODE0 0000000000042E90 FFFFFFFF803A2290
- PROMPT -error-program-prompt--------------------------------------------------
%DEBUG-I-SCRNOTORIGSRC, original version of source file not found for display in SRC
file used is SYS$COMMON:[SYSHLP.EXAMPLES]C_TEST_ROUTINES.C;1
DBG> examine i,k
DBG> show calls
DBG>Part III. OpenVMS Alpha Watchpoint Utility
This part describes the Alpha Watchpoint utility. It presents how to use the Watchpoint utility by doing the following:
Loading the watchpoint driver
Creating and deleting watchpoints
Looking at watchpoint driver data
Acquiring collected watchpoint data
Looking at the protection attributes and access fault mechanism
Looking at some watchpoint restrictions
Chapter 13. Watchpoint Utility (Alpha Only)
The Alpha Watchpoint utility (WP) enables you to monitor write access to user-specified locations. The chapter contains the following sections:
Section 13.1, ''Introduction'' presents an introduction of the Watchpoint utility.
Section 13.2, ''Initializing the Watchpoint Utility'' describes how to load the watchpoint driver.
Section 13.3, ''Creating and Deleting Watchpoints'' describes the creation and deletion of watchpoints and the constraints upon watchpoint locations.
Section 13.4, ''Data Structures'' contains detailed descriptions of the watchpoint driver data structures, which you might need to know to analyze collected watchpoint data.
Section 13.5, ''Analyzing Watchpoint Results'' discusses acquiring collected watchpoint data.
Section 13.6, ''Watchpoint Protection Overview'' describes the watchpoint protection facility.
Section 13.7, ''Restrictions'' describes the utility's restrictions.
13.1. Introduction
A watchpoint is a data field to which write access is monitored. The field is from 1 to 8 bytes long and must be contained within a single page. Typically, watchpoints are in nonpaged pool. However, subject to certain constraints (see Section 13.3.1, ''Using the $QIO Interface''), they can be defined in other areas of system space. The Watchpoint facility can simultaneously monitor a large number (50 or more) watchpoints.
The utility is implemented in the WPDRIVER device driver and the utility program WP. This document concentrates on the device driver, which can be invoked directly or through the WP utility.
For information on the WP utility, see its help files, which can be displayed with the following DCL command:
$ HELP/LIBRARY=SYS$HELP:WP
Once the driver has been loaded, a suitably privileged user can designate a watchpoint in system space. Any write to a location designated as a watchpoint is trapped. Information is recorded about the write, including its time, the register contents, and the program counter (PC) and processor status longword (PSL) of the writing instruction. Optionally, one or both of the following user-specified actions can be taken:
An XDELTA breakpoint (see the note below) or SCD breakpoint which occurs just after the write to the watchpoint
A fatal watchpoint bugcheck which occurs just after the write to the watchpoint
You define a watchpoint by issuing QIO requests to the watchpoint driver; entering commands to the WP utility, which issues requests to the driver; or, from kernel mode code, invoking a routine within the watchpoint driver.
The WPDRIVER data structures store information about writes to a watchpoint. This information can be obtained either through QIO requests to the WPDRIVER, commands to the WP utility, XDELTA commands issued during a requested breakpoint, or SDA commands issued during the analysis of a requested crashdump.
Note
For simplicity, this chapter only mentions XDELTA. Any reference to XDELTA breakpoints also implies SCD breakpoints.
13.2. Initializing the Watchpoint Utility
From a process with CMKRNL privilege, run the SYSMAN utility to load the watchpoint driver, SYS$WPDRIVER.EXE. Enter the following commands:
$ RUN SYS$SYSTEM:SYSMAN SYSMAN> IO CONNECT WPA0:/NOADAPTER/DRIVER=SYS$WPDRIVER SYSMAN> EXIT
SYSMAN creates system I/O data structures for the pseudo-device WPA0, loads WPDRIVER, and invokes its initialization routines. WPDRIVER initialization includes the following actions:
Allocating nonpaged pool and physical memory for WPDRIVER data structures
Appropriating the SCB vector specific to access violations
Recording in system space the addresses of the WPDRIVER routines invoked by kernel mode code to create and delete watchpoints
Memory requirements for WPDRIVER and its data structures are:
Device driver and UCB---approximately 3K bytes of nonpaged pool
Trace table and a related array---36 bytes for each of system parameter WPTTE_SIZE trace table entries
Watchpoint restore entries---system parameter WPRE_SIZE pages of physically contiguous memory
Each watchpoint---176 bytes of nonpaged pool
It is advisable to load the watchpoint driver relatively soon after system initialization to ensure its allocation of physically contiguous memory. If the driver cannot allocate enough physically contiguous memory, it does not set WPA0: online. If the unit is offline, you will not be able to use the watchpoint utility.
13.3. Creating and Deleting Watchpoints
There are three different ways to create and delete watchpoints:
An image can assign a channel to device WPA0: and then request the Queue I/O Request ($QIO) system service to create or delete a watchpoint.
Code running in kernel mode can dispatch directly to routines within the WPDRIVER to create and delete watchpoints.
You can enter commands to the WP utility.
The first two methods are described in detail in the sections that follow.
13.3.1. Using the $QIO Interface
An image first assigns a channel to the pseudo-device WPA0: and then issues a $QIO request on that channel. The process must have the privilege PHY_IO; otherwise, the $QIO request is rejected with the error SS$_NOPRIV.
The table below shows the functions that the driver supports.
| Function | Activity |
|---|---|
| IO$_ACCESS | Creates a watchpoint |
| IO$_DEACCESS | Deletes a watchpoint |
| IO$_RDSTATS | Receives trace information on a watchpoint |
The IO$_ACCESS function requires the following device/function dependent arguments:
P2---Length of the watchpoint. A number larger than 8 is reduced to 8.
P3---Starting address of the watchpoint area.
The following are the constraints on the watchpoint area. It must be:
Nonpageable system space.
Write-accessible from kernel mode.
Within one page. If it is not, the requested length is reduced to what will fit within the page containing the starting address.
Within a page accessed only from kernel mode and by instructions that incur no pagefaults.
Within a page whose protection is not altered while the watchpoint is in place.
Outside of certain address ranges. These are the WPDRIVER code, its data structures, and the system page table.
Because of the current behavior of the driver, there is an additional requirement that there be no "unexpected" access violations referencing a page containing a watchpoint. See Section 13.7, ''Restrictions'' for further details.
To specify that an XDELTA breakpoint or a fatal bugcheck occur if the watchpoint is written, use the following I/O function code modifiers:
IO$M_CTRL to request an XDELTA breakpoint
IO$M_ABORT to request a fatal bugcheck
For an XDELTA breakpoint to be taken, OpenVMS must have been booted specifying that XDELTA and/or the SCD be resident (bit 1 or bit 15 in the boot flags must be set). If both watchpoint options are requested, the XDELTA breakpoint is taken first. At exit from the breakpoint, the driver crashes the system.
A request to create a watchpoint can succeed completely, succeed partially, or fail. The table below shows the status codes that can be returned in the I/O status block.
| Status Code | Meaning |
|---|---|
| SS$_NORMAL | Success. |
| SS$_BUFFEROVF | A watchpoint was established, but its length is less than was requested because the requested watchpoint would have straddled a page boundary. |
| SS$_EXQUOTA | The watchpoint could not be created because too many watchpoints already exist. |
| SS$_INSFMEM | The watchpoint could not be created because there was insufficient nonpaged pool to create data structures specific to this watchpoint. |
| SS$_IVADDR | The requested watchpoint resides in one of the areas in which the WPDRIVER is unable to create watchpoints. |
| SS$_WASSET | An existing watchpoint either coincides or overlaps with the requested watchpoint. |
The following example MACRO program assigns a channel to the WPA0 device and creates a watchpoint of 4 bytes, at starting address 80001068. The program requests neither an XDELTA breakpoint nor a system crash for that watchpoint.
$IODEF
.PSECT RWDATA,NOEXE,RD,WRT,LONG
;
WP_IOSB: .BLKL 2 ; I/O status block.
WP_ADDR: .LONG ^X80001068 ; Address of watchpoint to create.
WP_NAM: .ASCID /WPA0:/ ; Device to which to assign channel.
WP_CHAN: .BLKW 1 ; Channel number.
.PSECT PROG,EXE,NOWRT
;
START: .CALL_ENTRY
$ASSIGN_S DEVNAM=WP_NAM,CHAN=WP_CHAN
BLBC R0,RETURN
$QIOW_S CHAN=WP_CHAN,-
FUNC=#IO$_ACCESS,-
IOSB=WP_IOSB,-
P2=#4,-
P3=WP_ADDR
BLBC R0,RETURN
MOVL WP_IOSB,R0 ; Move status to R0.
RETURN: RET ; Return to caller.
.END STARTA watchpoint remains in effect until it is explicitly deleted. (Note, however, that watchpoint definitions do not persist across system reboots.) To delete an existing watchpoint, issue an IO$_DEACCESS QIO request.
The IO$_DEACCESS function requires the following device/function dependent argument: P3 - Starting address of the watchpoint to be deleted.
The table below shows the status values that are returned in the I/O status block.
| Status Value | Meaning |
|---|---|
| SS$_NORMAL | Success. |
| SS$_IVADDR | The specified watchpoint does not exist. |
Section 13.5, ''Analyzing Watchpoint Results'' describes the use of the IO$_RDSTATS QIO request.
13.3.2. Invoking WPDRIVER Entry Points from System Routines
When the WPDRIVER is loaded, it initializes two locations in system space with the addresses of routines within the driver. These locations, WP$CREATE_WATCHPOINT and WP$DELETE_WATCHPOINT, enable dispatch to create and delete watchpoint routines within the loaded driver. Input arguments for both routines are passed in registers.
Code running in kernel mode can execute the following instructions:
JSB @G^WP$CREATE_WATCHPOINT ; create a watchpoint
and
JSB @G^WP$DELETE_WATCHPOINT ; delete a watchpoint
Both these routines save IPL at entry and set it to the fork IPL of the WPDRIVER, IPL 11. Thus, they should not be invoked by code threads running above IPL 11. At exit, the routines restore the entry IPL.
These two locations contain an RSB instruction prior to the loading of the driver. As a result, if a system routine tries to create or delete a watchpoint before the WPDRIVER is loaded, control immediately returns.
WP$CREATE_WATCHPOINT has the following register arguments:
R0---User-specified watchpoint options
Bit 1 equal to 1 specifies that a fatal OPERCRASH bugcheck should occur after a write to the watchpoint area.
Bit 2 equal to 1 specifies that an XDELTA breakpoint should occur after a write to the watchpoint area.
R1---Length of the watchpoint area
R2---Starting address of the watchpoint area
Status is returned in R0. The status values and their interpretations are identical to those for the QIO interface to create a watchpoint. The only difference is that the SS$_NOPRIV status cannot be returned with this interface.
WPS$DELETE_WATCHPOINT has the following register argument:
R2---Starting address of the watchpoint area
Status is returned in R0. The status values and their interpretations are identical to those for the QIO interface.
13.4. Data Structures
The WPDRIVER uses three different kinds of data structures:
One watchpoint restore entry (WPRE) for each page of system space in which one or more active watchpoints are located
One watchpoint control block (WPCB) for each active watchpoint
Trace table entries (WPTTEs) in a circular trace buffer which maintains a history of watchpoint writes
These data structures are described in detail and illustrated in the sections that follow.
13.4.1. Watchpoint Restore Entry (WPRE)
There is one WPRE for each system page that contains a watchpoint. That is, if nine watchpoints are defined which are in four different system pages, four WPREs are required to describe those pages. When WPDRIVER is loaded, its initialization routine allocates physically contiguous memory for the maximum number of WPREs. The number of pages to be allocated is specified by system parameter WPRE_SIZE.
The WPDRIVER allocates WPREs starting at the beginning of the table and maintains a tightly packed list. That is, when a WPRE in the middle of those in use is "deallocated," its current contents are replaced with the contents of the last WPRE in use. The number in use at any given time is in the driver variable WP$L_WP_COUNT. The system global EXE$GA_WP_WPRE points to the beginning of the WPRE table.
The WPRE for a page contains information useful for:
Determining whether a given access violation refers to an address in the page associated with this WPRE
Restoring the original SPTE value for the associated page
Reestablishing the modified SPTE value when watchpoints are reenabled
Invalidating the translation buffer when the SPTE is modified
Locating the data structures associated with individual watchpoints defined in this system page
13.4.2. Watchpoint Control Blocks (WPCB)
The WPCBs associated with a given system page are singly-linked to a list header in the associated WPRE. A WPCB is allocated from a nonpaged pool when a watchpoint is created. A WPCB contains static information about the watchpoint such as the following:
Its starting address and length
Original contents of the watchpoint at the time it was established
User-specified options for this watchpoint
In addition, the WPCB contains dynamic data associated with the most recent write reference to the watchpoint. This data includes the following:
Number of times that the watchpoint has been written.
Address of the first byte within the watchpoint that was modified at the last write reference.
PC-PSL pair that made the last write reference.
System time at the last write reference.
Contents of the general registers at the time of the last write reference.
A copy of up to 15 bytes of instruction stream data beginning at the program counter (PC) of the instruction that made the last write reference. The amount of instruction stream data that is copied here is the lesser of 15 bytes and the remaining bytes on the page containing the PC.
Contents of the watchpoint before the last write reference.
Contents of the watchpoint after the last write reference. This value is presumably the current contents of the watchpoint.
A pointer to an entry in the global circular trace buffer where all recent references to watchpoints are traced.
13.4.3. Trace Table Entries (WPTTEs)
Whenever a watchpoint is written, all the relevant data is recorded in the WPCB associated with the watchpoint. In addition, to maintain a history, the WPDRIVER copies a subset of the data to the oldest WPTTE in the circular trace buffer. Thus, the circular trace buffer contains a history of the last N references to watchpoints. The driver allocates nonpaged pool to accommodate the number of trace table entries specified by the system parameter WPTTE_SIZE. The WPTTEs for all watchpoints are together in the table, but the ones for a particular watchpoint are chained together.
The subset of data in a WPTTE includes the following:
Starting address of the watchpoint
Relative offset of the first byte modified on this reference
Opcode of the instruction that modified the watchpoint
A relative backpointer to the previous WPTTE of this watchpoint
PC-PSL of the write reference
System time of the write reference
Contents of the watchpoint before this reference
13.5. Analyzing Watchpoint Results
Analyzing watchpoint results is a function of the mode in which the WPDRIVER is used. For example, if you have only one watchpoint and have specified that an XDELTA breakpoint and/or a bugcheck occur on a write to the watchpoint, then when the reference occurs, simply find the program counter (PC) that caused the reference.
This PC (actually the PC of the next instruction) and its processor status longword (PSL) are on the stack at the time of the breakpoint and/or bugcheck. The layout that follows is the stack as it appears within an XDELTA breakpoint. Examined from a crash dump, the stack is similar but does not contain the return address from the JSB to INI$BRK.
+--------------------------------------+
|address in WPDRIVER from JSB G^INI$BRK| :SP
|PC of next instruction |
|PSL at watchpoint access |
+--------------------------------------+Furthermore, R0 contains the address of the WPCB associated with that watchpoint. You can examine the WPCB to determine the original contents of the watchpoint area and the registers at the time of the write.
Definitions for the watchpoint data structures are in SYS$LIBRARY:LIB.MLB. Build an object module with its symbol definitions by entering the following DCL commands:
$ MACRO/OBJ=SYS$LOGIN:WPDEFS SYS$INPUT: + SYS$LIBRARY:LIB/LIB
$WPCBDEF GLOBAL !n.b. GLOBAL must be capitalized
$WPREDEF GLOBAL
$WPTTEDEF GLOBAL
.END
CTRL/ZThen, within SDA, you can format watchpoint data structures. For example, enter the following SDA commands:
SDA>READ SYS$LOGIN:WPDEFS.OBJ SDA>FORMAT @R0 /TYPE=WPCB !type definition is required SDA>DEF WPTTE = @R0 + WPCB$L_TTE SDA>FORMAT WPTTE /TYPE=WPTTE
An alternative to crashing the system or using XDELTA to get watchpoint information is the QIO function IO$_RDSTAT. This function returns watchpoint control block contents and trace table entries for a particular watchpoint.
It requires the following device/function dependent arguments:
P1---Address of buffer to receive watchpoint data.
P2---Length of the buffer. The minimum size buffer of 188 bytes is only large enough for WPCB contents.
P3---Watchpoint address.
The data returned in the buffer has the format shown in the figure below.
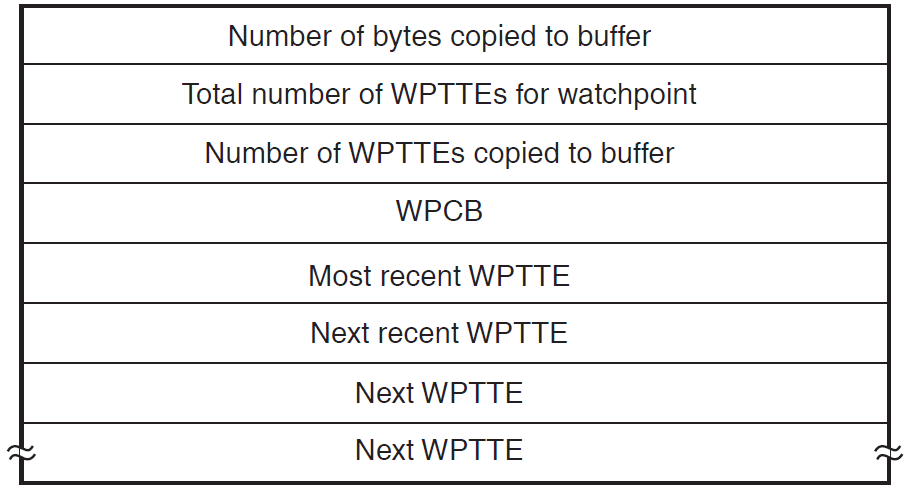
13.6. Watchpoint Protection Overview
The overall design of the watchpoint facility uses protection attributes on system pages and the access violation fault mechanism. To establish a watchpoint within a page of system space, the WPDRIVER changes the protection of the page to disallow writes. The WPDRIVER modifies the access violation vector to point to its own routine, WP$ACCVIO.
Any subsequent write to this page causes an access violation and dispatch to WP$ACCVIO. Thus, the WPDRIVER gains control on all write references to watchpoints and can monitor such accesses.
When WP$ACCVIO is entered, it raises IPL to 31 to block all other threads of execution. It first must determine whether the faulting address (whose reference caused the access violation) is within a page containing a watchpoint. However, any major amount of CPU processing at this point might access an area in system space whose protection has been altered to establish watchpoints. As a result, such processing might cause a reentry into WP$ACCVIO. To avoid recursive reentry, WP$ACCVIO first restores all SPTEs that it had modified to their values prior to the establishment of any watchpoints. From this point until this set of SPTEs are remodified, no watchpoints are in effect. Now WP$ACCVIO can determine whether the reference was to a page containing a watchpoint.
To determine whether the reference is to a watchpoint page, WP$ACCVIO compares the faulting address to addresses of pages whose protection has been altered by WPDRIVER. If the faulting address is not in one of these pages, then WP$ACCVIO passes the access violation to the usual OpenVMS service routine, EXE$ACVIOLAT. If the faulting address is within a page containing a watchpoint, more extensive processing is required.
As a temporary measure, WP$ACCVIO first records all data related to the reference in its UCB. It cannot immediately associate the access violation with a particular watchpoint. This ambiguity arises from imprecision in the faulting virtual address recorded at the access violation. The CPU need merely place on the stack "some virtual address in the faulting page."
As a result, when a reference to a page with a watchpoint results in an access violation, the watchpoint driver first merely captures the data in its UCB. The data captured at this point includes the following:
PC and PSL of the faulting instruction
Current system time
Values of all the general registers from R0 through SP
A copy of up to 15 bytes of the instruction stream, beginning at the PC previously captured
If the reference later turns out not to be one to a watchpoint, the captured data is discarded. If the reference is to a watchpoint, the data is copied to the WPCB and circular trace buffer.
The watchpoint driver distinguishes between these two possibilities by reexecuting the faulting instruction under a controlled set of circumstances.
Once the instruction has reexecuted, WP$TBIT can determine whether watchpoint data has been modified by comparing the current contents of all watchpoints within the page of interest to the contents that they had prior to this reference. Because the driver has run at IPL 31 since the write access that caused an access violation, any change in the contents is attributable to the reexecuted instruction. If the contents of a watchpoint are different, WP$TBIT copies the data temporarily saved in its UCB to the WPCB associated with this watchpoint and records a subset of this data in a WPTTE.
The driver can cause either or both an XDELTA breakpoint or a bugcheck, depending on what action was requested with the watchpoint definition. If an XDELTA breakpoint was requested, the driver invokes XDELTA. After the user proceeds from the XDELTA breakpoint, if a bugcheck was not requested, the driver restores the SPTEs of pages containing watchpoints, the saved registers and IPL, and REIs to dismiss the exception.
13.7. Restrictions
The WPDRIVER can monitor only those write references to system space addresses that arise in a CPU. I/O devices can write to memory and thereby modify watchpoints without the WPDRIVER's becoming aware of the write.
Because a write access to a watchpoint is determined by comparing the contents of the watchpoint before and after the write, a write of data identical to the original contents is undetectable.
Because the WPDRIVER modifies SPTEs, a device page that directly interprets tables may experience access violations when it attempts to write into a memory page whose protection has been modified to monitor watchpoints. In other words, a page containing a watchpoint should not also contain a buffer for such a controller.
When you create a watchpoint, you should ensure that the system is quiet with respect to activity affecting the watchpoint area. Otherwise, an inconsistent copy of the original contents of the watchpoint area may be saved. WPDRIVER raises IPL to 11 to copy the watchpoint area's original contents. This means that if the area is modified from a thread of execution running as the result of an interrupt above 11, WPDRIVER can copy inconsistent contents. An inconsistent copy of the original contents may result in spuriously detected writes and missed writes.
If the page containing the watchpoint area is written by an instruction that incurs a page fault, the system can crash with a fatal PGFIPLHI bugcheck. As described in the previous section, after detecting an attempt to write to a page with a watchpoint, the WPDRIVER re-executes the writing instruction at IPL 31. Page faults at IPL 31 are not allowed.
If an outer access mode reference to a watchpointed page causes an access violation, the system will likely crash. When an access violation occurs on a page with a watchpoint, the current driver does not probe the intended access and faulting mode against the page's original protection code. Instead, it assumes that any access violation to that page represents a kernel mode instruction that can be reexecuted at IPL 31. The driver's subsequent attempt to REI, restoring a program status longword (PSL) with an outer mode and IPL 31, causes a reserved operand fault and, generally, a fatal INVEXCEPTN bugcheck.
You must be knowledgeable about the accesses to the page with the watchpoint and careful in using the driver. You should test the watchpoint creation on a standalone system. You should leave the watchpoint in effect long enough to have some confidence that pagefaults in instructions accessing that page are unlikely.
An attempt to CONNECT a WPA unit other than zero results in a fatal WPDRVRERR bugcheck.
The WPDRIVER is suitable for use only on a single CPU system. That is, it should not be used on a symmetric multiprocessing system. There are no plans to remove this restriction in the near future.
Part IV. OpenVMS System Service Logging Utility
This part describes the System Service Logging utility. It explains how to:
Start logging
Stop logging
Display logged information
Chapter 14. System Service Logging
This chapter presents an overview of the System Service Logging utility and describes the System Service Logging commands.
14.1. Overview
System service logging (SSLOG) is used to record system service activity in a process. Its primary purpose is to troubleshoot process failure or misbehavior. This utility is available on OpenVMS Alpha and IA-64 platforms.
Once enabled, the SSLOG mechanism records information about system services requested by code running in the context of that process. The system services logged are:
Executive and kernel-mode services
Within privileged shareable image services
Within the OpenVMS executive
SSLOG does not log the mode of caller services.
SSLOG information is initially recorded in process space buffers. When a buffer is full, it is written to a disk file in the process's default disk and directory. After the disk file is closed, you can analyze it with the ANALYZE/SSLOG utility.
Recorded Information
SSLOG records the following information for each service:
Service identification
Location of service request - image and offset
Access mode of requester
Service arguments (passed by value; only the addresses of arguments passed by reference)
Timestamp
Completion status
Kernel thread, POSIX thread (PTHREAD), and CPU identifiers
The information is recorded as follows:
It is initially recorded in a ring of P2 space buffers with each process having its own P2 space buffers.
A full buffer is written to a disk file. By default, the file is SSLOG.DAT in the current default disk and directory. However, if the logical name SSLOG is defined, its equivalence string is used to form the log file name.
14.2. Enabling Logging
To enable any system service logging, check that the dynamic system parameter SYSSER_LOGGING is 1. If not, set it to a value of 1. Once logging is enabled, you can start system service logging for a particular process by DCL command, as shown in the following example.
$ SET PROCESS /SSLOG=(STATE=ON,COUNT=4)
By default, execution of this command affects the current process. To target another process, use the /ID qualifier or specify the process by name.
Use the COUNT keyword to specify the number of P2 space buffers to allocate for the process you are logging.
Buffers are pageable and therefore are charged against PGFLQUOTA. They are not deallocated until the process is deleted.
For additional information on this command, see the full description of the the section called “SET PROCESS/SSLOG” command.
14.3. Disabling Logging
There are two ways to disable logging, depending on whether you want the option to enable logging again on the same process.
If you might want to re-enable logging on this process, use the following command to disable logging:
$ SET PROCESS /SSLOG=(STATE=OFF)
You can then re-enable logging later by executing the same command with STATE=ON.
If you want to permanently end logging on this process, use the following command to close and truncate the log file:
$ SET PROCESS /SSLOG=(STATE=UNLOAD)
After you execute this command, you cannot enable logging on this process again.
14.4. Displaying Logged Information
You display logged information with the DCL command ANALYZE/SSLOG filename , where the default filename is SSLOG.DAT. For additional information on this command and examples, see the command the section called “ANALYZE/SSLOG”.
ANALYZE/SSLOG
Displays the collected data.
Format
ANALYZE/SSLOG [/BRIEF | /FULL | /NORMAL | /STATISTICS] [/OUTPUT=filename]
[/SELECT=(option[,...])] [/WIDE] [filespec]
Parameters
- filespec
Optional name of the log file to be analyzed. The default filename is SSLOG.DAT.
Qualifiers
- /BRIEF
Displays abbreviated logged information.
- /FULL
Displays logged information, error status messages and sequence numbers.
- /NORMAL (Default)
Displays basic logged information.
- /STATISTICS[=BY_STATUS]
Displays statistics on system services usage; accepts BY_STATUS keyword. Outputs a summary of the services logged with a breakdown by access mode. Output is ordered with the most frequently requested services first. If BY_STATUS is included, the summary is further separated by completion status. Output is displayed up to 132 columns wide.
- /OUTPUT=filename
Identifies the output file for storing the results of the log analysis. An asterisk (*) and percent sign (%) are not allowed as wildcards in the file specification. There is no default file type or filename. If you omit the qualifier, results are output to the current SYS$OUTPUT device.
- /SELECT=([option[,...]])
Selects entries based on your choice of options. You must specify at least one of the following:
Keyword Meaning ACCESS_MODE= mode Selects data by access mode. IMAGE= image-name Selects data by image name. STATUS[= n] Selects data by status. n is optional. /SELECT=STATUS displays all entries that have an error status. SYSSER= service-name Selects data by service name. - /WIDE
Provides for a display of logged information up to 132 columns wide.
Description
The ANALYZE/SSLOG command displays the collected logged data. Note that a system service log must be analyzed on the same platform type as the one on which it was created; for example, a log created on an OpenVMS Alpha system must be analyzed on an OpenVMS Alpha system.
Examples
The following examples demonstrate usage of the ANALYZE/SSLOG command.
$ ANALYZE /SSLOG /BRIEF START 1.1 00000414 HERE IA64 !25-MAY-2004 14:55:17.77 NAK ::SYSTEM 4 65024 SYS$EXIT_INT sts: -------- acmode: U !14:55:17.80 image: IMAGE_MANAGEMENT+00047ed0 argct: 01 SYS$RMSRUNDWN sts: 00010001 acmode: S !14:55:17.80 image: DCL+00070370 argct: 02 SYS$DCLAST sts: 00000001 acmode: E !14:55:17.80 image: RMS+000e5840 argct: 03 SYS$RMS_CLOSE sts: 00010001 acmode: E !14:55:17.80 image: RMS+000d66c0 argct: 03 SYS$SETEF sts: 00000009 acmode: E !14:55:17.80 image: RMS+00125df0 argct: 01 SYS$RMS_CLOSE sts: 00010001 acmode: E !14:55:17.80 image: RMS+000d66c0 argct: 03 SYS$SETEF sts: 00000009 acmode: E !14:55:17.80 image: RMS+00125df0 argct: 01 SYS$ERNDWN sts: 00000001 acmode: S !14:55:17.80 image: IMAGE_MANAGEMENT+000274d0 argct: 01 SYS$CMKRNL sts: 8318ae00 acmode: E !14:55:17.80 image: IMAGE_MANAGEMENT+00027890 argct: 02 [...]The above example shows abbreviated SSLOG output.
The first entry displayed is a START message that describes the enabling of system service logging. The major and minor version numbers associated with this log file are both 1. Logging was initiated by process ID 0000041416 whose username was SYSTEM. This log file is from an OpenVMS IA-64 platform. The timestamp shows when logging was started. The process whose services were logged was named HERE and ran on node NAK. Logging was done into four buffers of 65024 bytes each.
Each subsequent entry describes a system service request. The leftmost column is the service name. The next item displayed is the hexadecimal completion status from that service request. If the status is displayed as "--------", one of the following circumstances occurred:
The buffer filled and was written to disk before the service completed.
The service returned to the system service dispatcher at an interrupt priority level (IPL) above 2. Because the process space buffers are pageable and page faults are not allowed above IPL 2, completion status cannot be logged when a service returns above IPL 2.
The next item displayed is the access mode from which the service was requested, followed by the time at which the service was requested. The next line shows the image and offset within the image of the service request and the number of arguments with which the service was requested. Service arguments are not displayed when you enter the command ANALYZE/SSLOG/BRIEF.
$ ANALYZE /SSLOG /FULL
START version: 1.2 process: 0000042f ! 5-JUN-2006 14:03:20.07 username: SYSTEM node: XK150S platform: ALPHA buffer count: 6 size: 65024 start_flags: 00000003 SYS$SETEXV acmode: U !14:03:20.20 sts: %SYSTEM-S-NORMAL, normal successful completion image: PROCESS_MANAGEMENT_MON+00008f3c argct: 04 arg 1:0000000000000002 2:ffffffff818e8510 3:0000000000000000 arg 4:0000000000000000 entry number: 00000002 number at completion: 00000002 cpu id: 000 kernel thread ID: 0000 Pthread ID: 0 [...] SYS$GETDVI acmode: U !14:03:20.28 sts: %SYSTEM-S-NORMAL, normal successful completion image: SYSTEM_PRIMITIVES+00054dec argct: 08 arg 1:0000000000000000 2:0000000000000000 3:000000000004000c arg 4:000000007ae59e10 5:000000007ae59e08 6:0000000000000000 arg 7:0000000000000000 8:0000000000000000 entry number: 00000193 number at completion: 00000193 cpu id: 000 kernel thread ID: 0000 Pthread ID: 1 MOUNTSHR :00010000 acmode: U !14:03:20.28 sts: %SYSTEM-S-NORMAL, normal successful completion image: MOUNTSHR+0009008c argct: 02 arg 1:0000000000000003 2:0000000000000000 entry number: 00000194 number at completion: 00000195 cpu id: 000 kernel thread ID: 0000 Pthread ID: 1 SYS$SETPRT acmode: E !14:03:20.28 sts: %SYSTEM-S-NORMAL, normal successful completion image: MOUNTSHR+00091d94 argct: 05 arg 1:000000007ff8bf88 2:0000000000000000 3:0000000000000000 arg 4:0000000000000004 5:0000000000000000 entry number: 00000195 number at completion: 00000195 cpu id: 000 kernel thread ID: 0000 Pthread ID: 1 SYS$SETSFM acmode: U !14:03:20.28 sts: %SYSTEM-S-NORMAL, normal successful completion image: MOUNTSHR+000900a8 argct: 01 arg 1:0000000000000000 entry number: 00000196 number at completion: 00000196 cpu id: 000 kernel thread ID: 0000 Pthread ID: 1 MOUNTSHR :00010000 acmode: U !14:03:20.28 sts: %SYSTEM-S-NORMAL, normal successful completion image: MOUNTSHR+000901ac argct: 02 arg 1:0000000000000001 2:000000007ae5a080 entry number: 00000197 number at completion: 0000019B cpu id: 000 kernel thread ID: 0000 Pthread ID: 1 [...]The above example shows full SSLOG output.
In the /FULL display, the START entry also shows the flags with which logging was initiated:
Bit 0, when set, means that service arguments were logged.
Bit 1, which is always set, means that the P2 space buffers are being written to a file.
The /FULL display shows the arguments for each system service request, as well as its entry number, and interprets the completion status. The display includes kernel thread and POSIX thread identifiers in addition to the identifier of the CPU on which the system service began.
The system service name is not available for services implemented in privileged shareable images. Instead the image name and an internally generated service number are displayed.
When logging is initiated for a particular service, an entry sequence number is associated with that entry. The sequence number is incremented with each attempt to log a system service. The /FULL display shows the sequence number associated with each service request and the number current at the time the service completed. If the service requests no other loggable system services, the two numbers are identical; otherwise, the two numbers differ.
Note that the number at completion is 0 for a service whose completion status could not be logged.
In this example, the number when the second MOUNTSHR system service request is issued is 19716, and the number at completion is 19B16. From this you can infer that four other services were requested as part of processing MOUNTSHR system service request, namely, the services whose entry numbers are 19816 through 19B16.
$ ANALYZE /SSLOG /BRIEF /WIDE
START 1.2 0000042e XK150S ::USER ALPHA 2 65024 ! 5-JUN-2006 10:52:51.95 service status mode imagename+offset time ------- ------ ---- ---------------- ---- SYS$SETEXV 00000001 U PROCESS_MANAGEMENT_MON+00008f3c !10:52:52.06 SYS$SETPRT 00000001 U PROCESS_MANAGEMENT_MON+0005274c !10:52:52.06 SYS$SETPRT 00000024 U PROCESS_MANAGEMENT_MON+0005274c !10:52:52.06 SYS$SETPRT 00000024 U PROCESS_MANAGEMENT_MON+0005274c !10:52:52.06 SYS$IMGACT 00000001 U IMAGE_MANAGEMENT+000163b8 !10:52:52.06 SYS$CMKRNL 00000001 U LOGINOUT+00030174 !10:52:52.06 SYS$GETJPI 00000001 U PROCESS_MANAGEMENT_MON+000527e4 !10:52:52.06 SYS$GETDVI 00000001 U SYSTEM_PRIMITIVES+00054dec !10:52:52.06 SYS$SETPRV 00000001 U LOGINOUT+0003323c !10:52:52.06 SYS$SETPRV 00000001 U LOGINOUT+00033278 !10:52:52.06 SYS$PERSONA_EXPORT_ARB 00000001 K PROCESS_MANAGEMENT_MON+0004e9e8 !10:52:52.06 SYS$TRNLNM 000001bc U LOGINOUT+000365f8 !10:52:52.06 SYS$SETPRV 00000001 U LOGINOUT+00030a08 !10:52:52.06 [...] SYS$ASSIGN_LOCAL 00000154 E IO_ROUTINES_MON+0001a544 !10:52:52.14 SYS$CMKRNL 8180e100 E MOUNTSHR+000964a8 !10:52:52.14 missing entry numbers: curr:1082 prev: 721 SYS$SYNCH_INT -------- S PROCESS_MANAGEMENT_MON+00035634 !10:52:52.15 SYS$SYNCH_INT -------- S PROCESS_MANAGEMENT_MON+00035634 !10:52:52.15 SYS$RMS_FLUSH 00018001 S RMS+00056808 !10:53:52.10 SYS$QIO 00000001 E RMS+000742bc !10:53:52.10 [...]
The above example shows abbreviated SSLOG output in a wide format.
Sometimes system services are requested too quickly for logging to keep up. When a buffer fills, it is written asynchronously to the log file. If there are only two buffers, as in this example, the second can fill while the first is still being written and thus not yet available. In that case, entries are lost.
Because each attempt to log a service request has an entry number associated with it, the ANALYZE/SSLOG utility can detect gaps in entry numbers. In this example, the line that begins "missing entry numbers" indicates a gap of 361 entries.
$ ANALYZE /SSLOG /NORMAL
START version: 1.1 process: 00000414 HERE !25-MAY-2004 14:55:17.77 username: SYSTEM node: NAK platform: IA64 buffer count: 4 size: 65024 start_flags: 00000003 SYS$EXIT_INT sts: -------- acmode: U !14:55:17.80 image: IMAGE_MANAGEMENT+00047ed0 argct: 01 arg 1:0000000010000001 entry number: 00000002 number at completion: 00000000 SYS$RMSRUNDWN sts: 00010001 acmode: S !14:55:17.80 image: DCL+00070370 argct: 02 arg 1:000000007ffabf14 2:0000000000000000 entry number: 00000003 number at completion: 00000008 SYS$DCLAST sts: 00000001 acmode: E !14:55:17.80 image: RMS+000e5840 argct: 03 arg 1:ffffffff832f70b0 2:0000000000000002 3:0000000000000000 entry number: 00000004 number at completion: 00000004 SYS$RMS_CLOSE sts: 00010001 acmode: E !14:55:17.80 image: RMS+000d66c0 argct: 03 arg 1:000000007ff67e20 2:0000000000000000 3:0000000000000000 entry number: 00000005 number at completion: 00000006 SYS$SETEF sts: 00000009 acmode: E !14:55:17.80 image: RMS+00125df0 argct: 01 arg 1:000000000000001e entry number: 00000006 number at completion: 00000006 SYS$RMS_CLOSE sts: 00010001 acmode: E !14:55:17.80 image: RMS+000d66c0 argct: 03 arg 1:000000007ff67e20 2:0000000000000000 3:0000000000000000 entry number: 00000007 number at completion: 00000008 [...]The above example shows normal SSLOG output in narrow format.
The difference between the /NORMAL and /FULL displays is that the service completion status is interpreted in a /FULL display.
$ ANALYZE /SSLOG /WIDE
START version: 1.1 process: 20200224 HERE2 !28-APR-2004 14:17:58.54 username: USER node: NODEAZ platform: ALPHA SYS$EXIT_INT sts: -------- acmode: U image: IMAGE_MANAGEMENT+00010838 !14:17:58.82 argct:01 1:0000000010000001 SYS$RMSRUNDWN sts: 00010001 acmode: S image: DCL.EXE+000804b0 !14:17:58.82 argct:02 1:000000007ff9cb34 2:0000000000000000 SYS$DCLAST sts: 00000001 acmode: E image: RMS+0004e200 !14:17:58.82 argct:03 1:00000000811338b0 2:0000000000000002 3:0000000000000000 SYS$RMS_CLOSE sts: 00010001 acmode: E image: RMS+000484b8 !14:17:58.82 argct:03 1:000000007ff8beb0 2:0000000000000000 3:0000000000000000 SYS$SETEF sts: 00000009 acmode: E image: RMS+0005fe70 !14:17:58.82 argct:01 1:000000000000001e SYS$RMS_CLOSE sts: 00010001 acmode: E image: RMS+000484b8 !14:17:58.82 argct:03 1:000000007ff8beb0 2:0000000000000000 3:0000000000000000 SYS$SETEF sts: 00000009 acmode: E image: RMS+0005fe70 !14:17:58.82 argct:01 1:000000000000001e [...]The above example shows normal (default) SSLOG output in a wide format.
$ ANALYZE /SSLOG /WIDE /FULL
START version: 1.1 process: 00000415 HERE !11-MAY-2006 10:41:38.82 username: SYSTEM node: NAK platform: IA64 SYS$EXIT_INT sts: -------- acmode: U image: IMAGE_MANAGEMENT+00047600 !10:41:38.85 argct:01 1:0000000010000001 entry number: 00000002 number at completion: 00000000 cpu id: 000 kernel thread ID: 0000 Pthread ID: 0 SYS$RMSRUNDWN acmode: S image: DCL+0006fdb0 !10:41:38.85 sts: %RMS-S-NORMAL, normal successful completion argct:02 1:000000007ffabf14 2:0000000000000000 entry number: 00000003 number at completion: 00000008 cpu id: 000 kernel thread ID: 0000 Pthread ID: 0 SYS$DCLAST acmode: E image: RMS+000e3ca0 !10:41:38.85 sts: %SYSTEM-S-NORMAL, normal successful completion argct:03 1:ffffffff842f68b0 2:0000000000000002 3:0000000000000000 entry number: 00000004 number at completion: 00000004 cpu id: 000 kernel thread ID: 0000 Pthread ID: 0 SYS$RMS_CLOSE acmode: E image: RMS+000d4d90 !10:41:38.85 sts: %RMS-S-NORMAL, normal successful completion argct:03 1:000000007ff67e20 2:0000000000000000 3:0000000000000000 entry number: 00000005 number at completion: 00000006 cpu id: 000 kernel thread ID: 0000 Pthread ID: 0 SYS$SETEF acmode: E image: RMS+00123740 !10:41:38.85 sts: %SYSTEM-S-ACCVIO, access violation, reason mask=!XB, virtual address=!XH, PC=!XH, PS=!XL argct:01 1:000000000000001e entry number: 00000006 number at completion: 00000006 cpu id: 000 kernel thread ID: 0000 Pthread ID: 0 SYS$RMS_CLOSE acmode: E image: RMS+000d4d90 !10:41:38.85 sts: %RMS-S-NORMAL, normal successful completion argct:03 1:000000007ff67e20 2:0000000000000000 3:0000000000000000 entry number: 00000007 number at completion: 00000008 cpu id: 000 kernel thread ID: 0000 Pthread ID: 0 )The above example shows full SSLOG output in a wide format.
$ ANALYZE /SSLOG /WIDE /SELECT=(IMAGE=DCL,SYSSER=SYS$IMGACT)- _$ /OUTPUT=SSL_SEL2.LOG SSLOG.DAT
START version: 1.1 process: 2020041b SYSTEM !30-AUG-2004 18:30:28.79 username: SYSTEM node: WFGLX4 platform: ALPHA SYS$IMGACT sts: 00000001 acmode: S image: DCL+0007eb40 !18:30:44.26 argct:08 1:000000007ff9cd58 2:000000007ff9cd50 3:000000007ffcf800 4:0000000000000000 5:0000000000000000 6:0000000000000000 7:0000000000000000 8:0000000000000000 entry number: 0000002E number at completion: 000000B7 SYS$IMGACT sts: 00000001 acmode: S image: DCL+0007eb40 !18:30:49.81 argct:08 1:000000007ff9cd58 2:000000007ff9cd50 3:000000007ffcf800 4:0000000000000000 5:0000000000000000 6:0000000000000000 7:0000000000000000 8:0000000000000000 entry number: 00000195 number at completion: 00000203 SYS$IMGACT sts: 00000001 acmode: S image: DCL+0007eb40 !18:31:06.19 argct:08 1:000000007ff9cd58 2:000000007ff9cd50 3:000000007ffcf800 4:0000000000000000 5:0000000000000000 6:0000000000000000 7:0000000000000000 8:0000000000000000 entry number: 000003FB number at completion: 0000046A STOP !30-AUG-2004 18:31:06.19The above example selects only those entries that describe SYS$IMGACT requests made from DCL and writes the analysis to file SSL_SEL2.LOG. (Parts of the display have been moved left to fit within manual page boundaries.)
$ ANALYZE /SSLOG /STATISTICS /OUTPUT=SSL_STAT.LOG SSLOG.DAT
START version: 1.1 process: 2020041b SYSTEM !30-AUG-2004 18:30:28.79 username: SYSTEM node: WFGLX4 platform: ALPHA buffer count: 2 size: 65024 start_flags: 00000003 Service Count User Super Exec Kernel Rate/sec -------- ------ ------ ------ ------ ------ -------- SYS$TRNLNM 168 4 0 164 0 4.5 SYS$RMS_SEARCH 129 129 0 0 0 3.4 SYS$QIO 121 0 0 94 27 3.2 SYS$SYNCH_INT 92 88 4 0 0 2.5 SYS$RMS_PUT 85 85 0 0 0 2.3 SYS$CMKRNL 55 0 0 55 0 1.5 SYS$SETPRT 51 36 0 15 0 1.4 SYS$DASSGN 49 0 0 24 25 1.3 SYS$GETDVI 46 2 0 44 0 1.2 SYS$ASSIGN_LOCAL 44 0 0 44 0 1.2 SYS$MGBLSC 40 0 0 40 0 1.1 SYS$CRMPSC 27 0 0 27 0 0.7 SYS$GETJPI 22 22 0 0 0 0.6 SYS$RMS_OPEN 21 0 0 21 0 0.6 SYS$DEQ 19 0 0 8 11 0.5 SYS$IMGACT 18 15 3 0 0 0.5 SYS$CRETVA 16 0 0 16 0 0.4 SYS$ENQ 15 0 0 8 7 0.4 SYS$SETRWM 12 0 0 6 6 0.3 SYS$DELTVA 12 0 0 0 12 0.3 SYS$PERSONA_ASSUME 12 0 0 12 0 0.3 SYS$EXPREG 12 9 0 3 0 0.3 SYS$RMS_CLOSE 7 1 0 6 0 0.2 SYS$CLRCLUEVT 6 0 0 0 6 0.2 SYS$SETEF 6 0 0 6 0 0.2 SYS$DACEFC 6 0 0 0 6 0.2 SYS$PERSONA_EXTENSION_LOOKUP 6 0 0 0 6 0.2 SYS$GETSYI 5 5 0 0 0 0.1 SYS$DCLAST 5 0 0 5 0 0.1 SYS$RMSRUNDWN 3 0 3 0 0 0.1 SYS$ERNDWN 3 0 3 0 0 0.1 SYS$SETEXV 3 3 0 0 0 0.1 SYS$KRNDWN 3 0 3 0 0 0.1 SYS$EXIT_INT 3 3 0 0 0 0.1 SYS$RMS_GET 3 0 3 0 0 0.1 SYS$DCLEXH 3 0 3 0 0 0.1 SYS$PERSONA_EXPORT_ARB 3 0 0 0 3 0.1 SYS$DALLOC 3 0 0 0 3 0.1 SYS$SETPFM 3 0 0 0 3 0.1 SYS$PERSONA_CLONE 2 0 0 2 0 0.1 SYS$PERSONA_DELETE 2 0 0 2 0 0.1 SYS$RMS_CREATE 2 2 0 0 0 0.1 SYS$RMS_CONNECT 2 2 0 0 0 0.1 SYS$SET_PROCESS_PROPERTIESW 1 1 0 0 0 0.0 SYS$RMS_PARSE 1 1 0 0 0 0.0 SYS$PROCESS_SCAN 1 1 0 0 0 0.0 SYS$SETPRV 1 1 0 0 0 0.0The above example shows the use of the /STATISTICS qualifier. The output lists the most frequently requested service first. Each entry shows the total number of requests for that service, a breakdown by access mode, and the rate per second.
Note that only OpenVMS executive services are listed in a /STATISTICS display; services in privileged shareable images are omitted.
$ ANALYZE /SSLOG /STATISTICS=BY_STATUS
START version: 1.1 process: 2020041b SYSTEM !30-AUG-2004 18:30:28.79 username: SYSTEM node: WFGLX4 platform: ALPHA buffer count: 2 size: 65024 start_flags: 00000003 Service Count User Super Exec Kernel Status Rate/sec -------- ------ ------ ------ ------ ------ ------- -------- SYS$TRNLNM 168 4 0 164 0 All 4.5 46 0 0 46 0 000001BC 1.2 122 4 0 118 0 00000001 3.3 SYS$RMS_SEARCH 129 129 0 0 0 All 3.4 2 2 0 0 0 00018001 0.1 126 126 0 0 0 00010001 3.4 1 1 0 0 0 000182CA 0.0 SYS$QIO 121 0 0 94 27 All 3.2 4 0 0 0 4 0000026C 0.1 117 0 0 94 23 00000001 3.1 SYS$SYNCH_INT 92 88 4 0 0 All 2.5 92 88 4 0 0 00000000 2.5 SYS$RMS_PUT 85 85 0 0 0 All 2.3 84 84 0 0 0 00018001 2.2 1 1 0 0 0 00000000 0.0 [...]The above example shows the use of /STATISTICS = BY_STATUS. Similar to the previous example, it also has an additional line for each status returned by a system service.
RUN/SSLOG_ENABLE
Creates a process with system service logging enabled.
Requires CMEXEC, CMKRNL, or SETPRV privilege to log argument values. The SYSGEN parameter SYSSER_LOGGING must be enabled or the command will fail.
Refer to online help or the VSI OpenVMS DCL Dictionary for other qualifiers that can be used with the RUN command when creating a process.
Format
RUN /SSLOG_ENABLE[=(COUNT=n [,FLAGS=[NO]ARG])]
Parameters
- COUNT=n
Specifies how many P2-space buffers to log. The default is 2.
- FLAGS=[NO]ARG
Specifies whether or not service argument values are to be logged. The default is ARG, which requires privileges. If the value is ARG but you lack privilege, no argument values are logged.
If both COUNT and FLAGS are specified, they must be separated by a comma. If only one is specified, the parentheses may be omitted.
Qualifiers
None.
Description
The RUN/SSLOG_ENABLE command creates a process with system service logging enabled.
When enabling SSLOG for a process, you can specify the number of buffers to be used for logging. Buffers are allocated in P2 space and are charged against the process's paging file quota. Each buffer is 65,02410 bytes or FE0016 bytes. The buffer space remains allocated and the quota charged until the process is deleted.
Before you delete the process, stop the logging and close the log file by executing the SET PROCESS/SSLOG=STATE=UNLOAD command. The log file does not close automatically.
To analyze the log file, use the DCL command ANALYZE/SSLOG.
Examples
$ RUN /SSLOG_ENABLE SSLOG_TEST.EXE
This command creates a new process to run the image SSLOG_TEST.EXE and log the results.
$ RUN /SSLOG_ENABLE SSLOG_TEST.EXE /PROCESS_NAME=SUBA
This command creates a new process named SUBA to run the image SSLOG_TEST.EXE and log the results.
SET PROCESS/SSLOG
Enables or disables system service logging on the current process or on a specified process.
Requires GROUP privilege to change other processes in your group. Requires WORLD privilege to change processes outside your group. Requires CMEXEC, CMKRNL, or SETPRV privilege to log argument values. SYSGEN parameter SYSSER_LOGGING must be enabled or the command will fail.
Refer to online help or the VSI OpenVMS DCL Dictionary for other SET PROCESS command qualifiers.
Format
SET PROCESS/SSLOG=(STATE={ON|OFF|UNLOAD} [,COUNT=n] [,FLAGS=[NO]ARGUMENTS])
[/ID=id_number] [process-name]
Parameters
- process-name
Specifies the name of the process for which logging is to be enabled or disabled.
- COUNT=n
Specifies how many P2-space buffers to log. The default is 2.
- FLAGS=[NO]ARG
Specifies whether or not service argument values are to be logged. The default is ARG, which requires privileges. If the value is ARG but you lack privilege, no argument values are logged.
- STATE=state
Turns system service logging on or off. Possible states are:
ON Enables system service logging. OFF Disables (turns off) system service logging; logging can still be reenabled. UNLOAD Stops logging and closes the log file, which is named SSLOG.DAT by default.
Qualifiers
- /IDENTIFICATION=identification_number
Specify to target a specific process by number.
Description
The SET PROCESS/SSLOG command:
Enables or disables system service logging
Opens the log file used to log data
Can specify a specific process by name or ID (identification number)
Can stop logging and close the file of logged data
When enabling SSLOG for a process, you specify the number of buffers to be used for logging. The buffers are allocated in P2 space and are charged against the process's paging file quota. Each buffer is 65,02410 bytes or FE0016 bytes. The buffer space remains allocated and the quota charged until the process is deleted.
Between the time when SSLOG is first enabled and when the log file is closed, logging can be stopped and resumed.
Before you delete the process, stop the logging and close the log file. The log file does not close automatically.
To analyze the log file, use the DCL command ANALYZE/SSLOG.
Examples
$ SET PROCESS /SSLOG=(STATE=ON,COUNT=4)
This command turns on system service logging with four P2 space buffers, each having a size of FE0016 bytes. If the process has SETPRV, CMKRNL, or CMEXEC privilege, argument values are logged.
$ SET PROCESS /SSLOG=(STATE=UNLOAD)
This command stops logging and closes the log file.